

Effects of antibiotics on bacterial cell morphology and their physiological origins
- PMID: 36093840
- PMCID: PMC10152891
- DOI: 10.1042/BST20210894
Effects of antibiotics on bacterial cell morphology and their physiological origins
Abstract
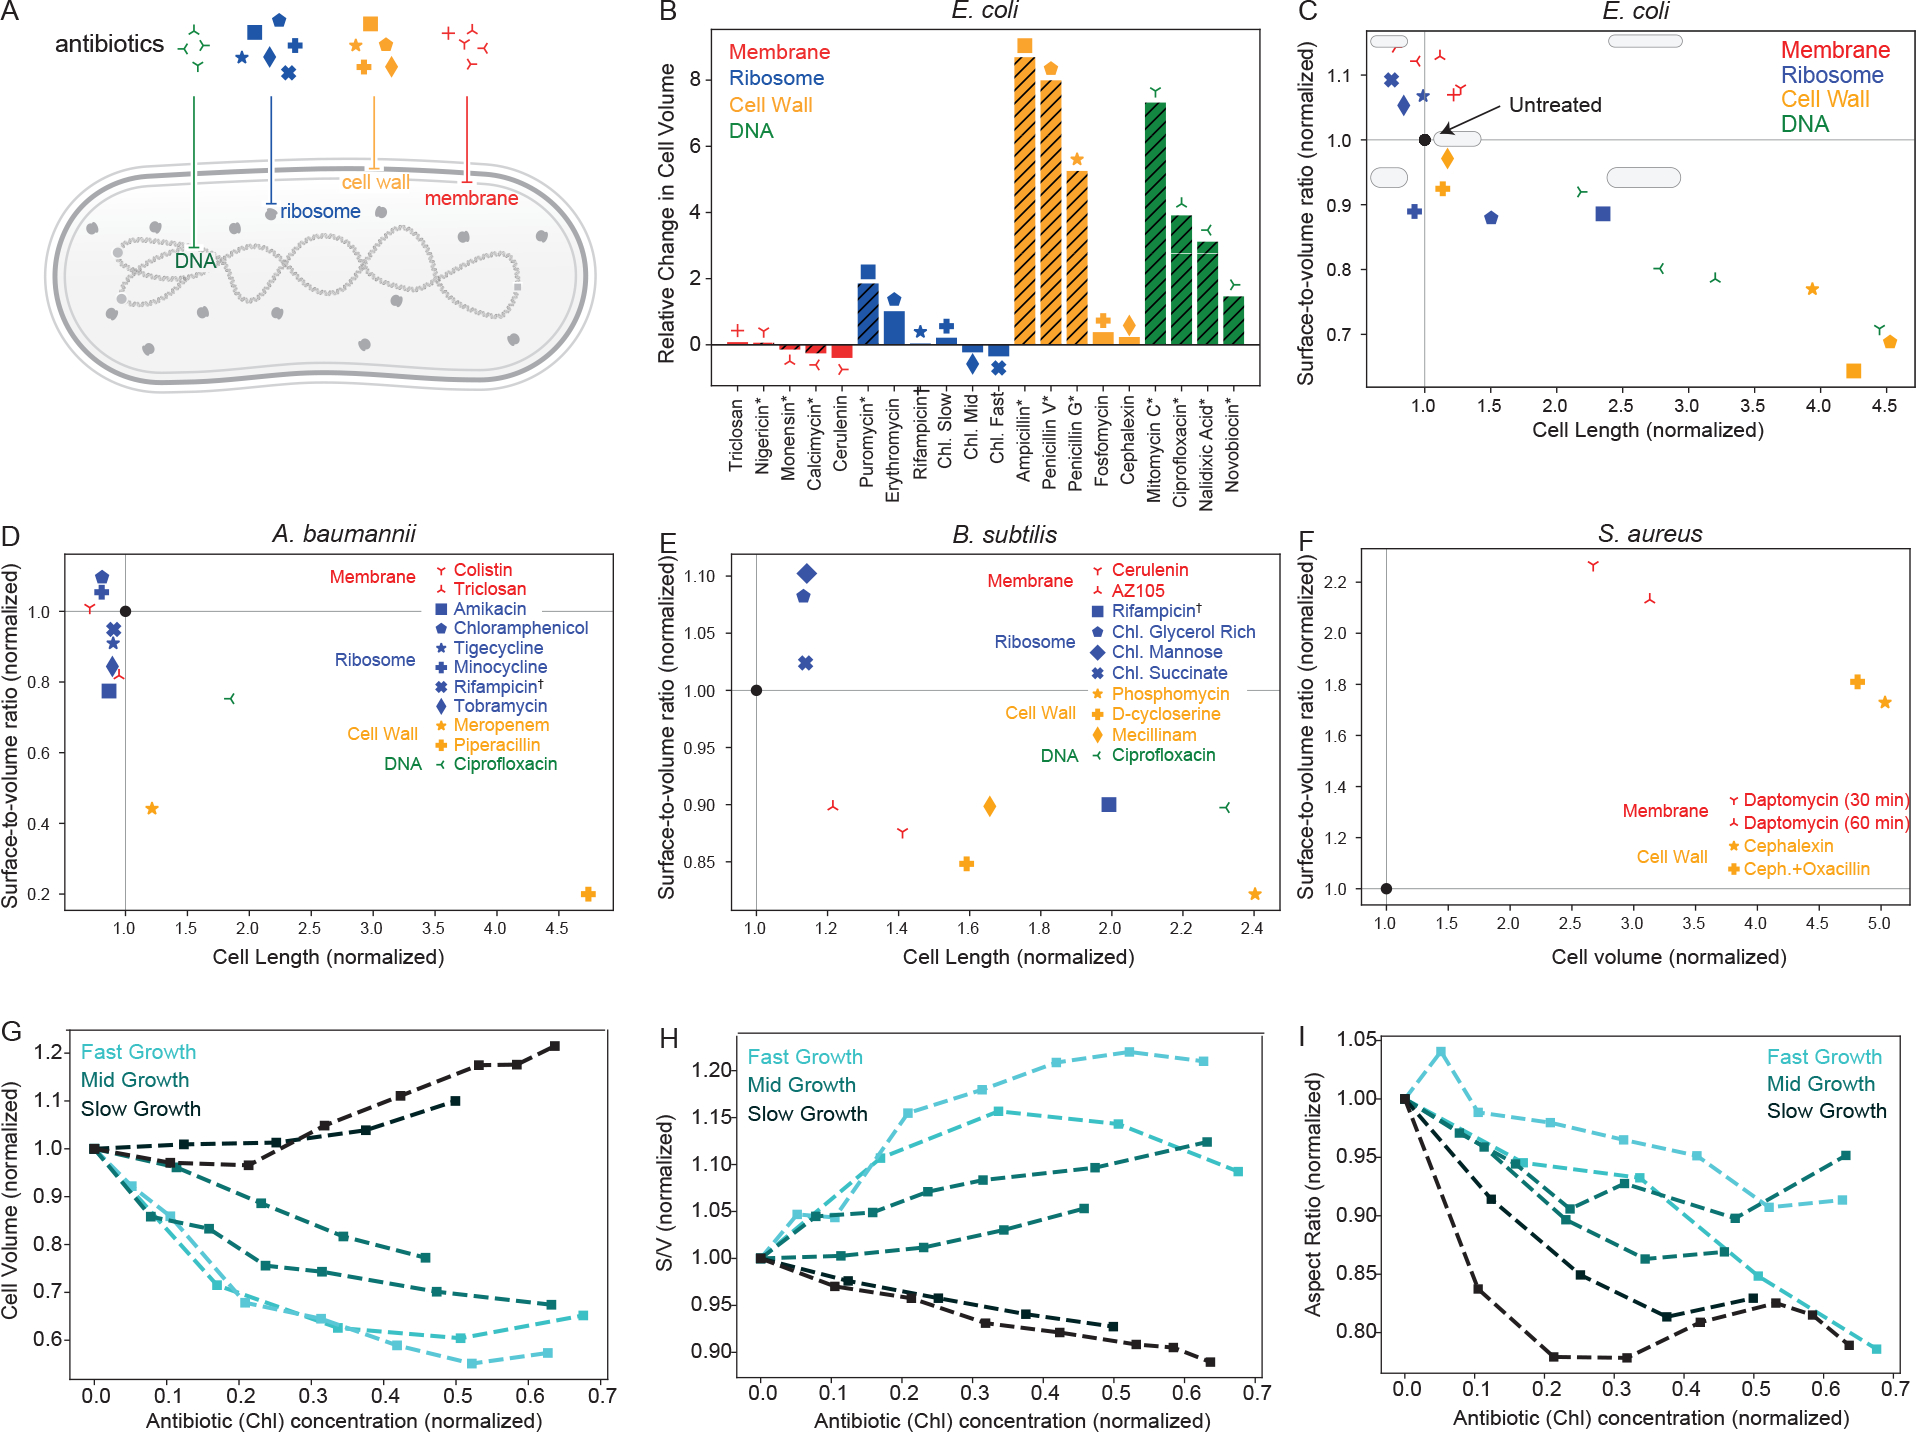
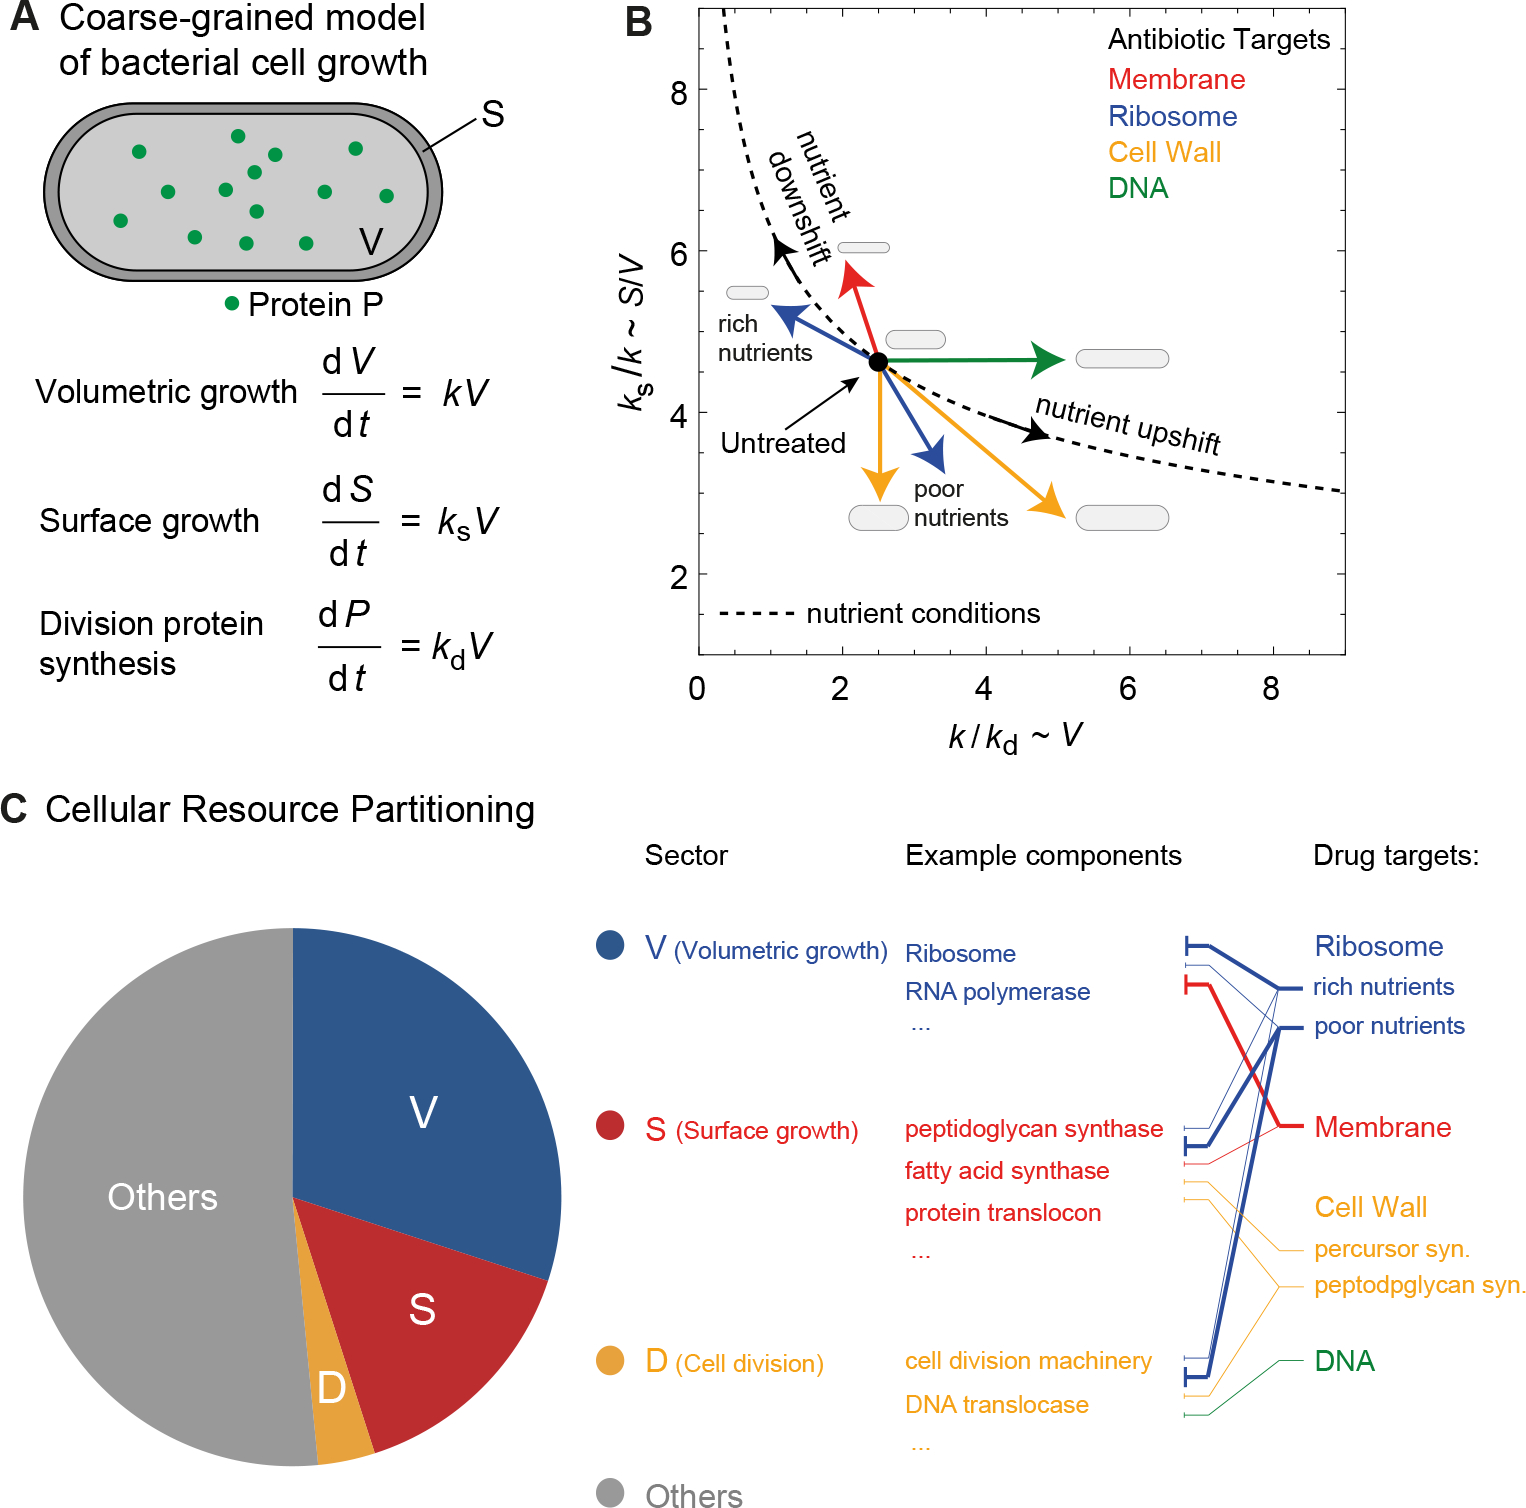
Characterizing the physiological response of bacterial cells to antibiotic treatment is crucial for the design of antibacterial therapies and for understanding the mechanisms of antibiotic resistance. While the effects of antibiotics are commonly characterized by their minimum inhibitory concentrations or the minimum bactericidal concentrations, the effects of antibiotics on cell morphology and physiology are less well characterized. Recent technological advances in single-cell studies of bacterial physiology have revealed how different antibiotic drugs affect the physiological state of the cell, including growth rate, cell size and shape, and macromolecular composition. Here, we review recent quantitative studies on bacterial physiology that characterize the effects of antibiotics on bacterial cell morphology and physiological parameters. In particular, we present quantitative data on how different antibiotic targets modulate cellular shape metrics including surface area, volume, surface-to-volume ratio, and the aspect ratio. Using recently developed quantitative models, we relate cell shape changes to alterations in the physiological state of the cell, characterized by changes in the rates of cell growth, protein synthesis and proteome composition. Our analysis suggests that antibiotics induce distinct morphological changes depending on their cellular targets, which may have important implications for the regulation of cellular fitness under stress.
Keywords: antibiotic resistance; antibiotics; bacteria; cell shape; growth physiology; size control.
© 2022 The Author(s). Published by Portland Press Limited on behalf of the Biochemical Society.
Conflict of interest statement
Competing interests
The authors declare that there are no competing interests associated with the manuscript.
Figures
Similar articles
-
Antibiotic Resistance via Bacterial Cell Shape-Shifting.mBio. 2022 Jun 28;13(3):e0065922. doi: 10.1128/mbio.00659-22. Epub 2022 May 26. mBio. 2022. PMID: 35616332 Free PMC article.
-
Bacterial resistance mechanism: what proteomics can elucidate.FASEB J. 2013 Apr;27(4):1291-303. doi: 10.1096/fj.12-221127. Epub 2013 Jan 24. FASEB J. 2013. PMID: 23349550 Review.
-
Antibiotic efficacy is linked to bacterial cellular respiration.Proc Natl Acad Sci U S A. 2015 Jul 7;112(27):8173-80. doi: 10.1073/pnas.1509743112. Epub 2015 Jun 22. Proc Natl Acad Sci U S A. 2015. PMID: 26100898 Free PMC article.
-
The physiology and genetics of bacterial responses to antibiotic combinations.Nat Rev Microbiol. 2022 Aug;20(8):478-490. doi: 10.1038/s41579-022-00700-5. Epub 2022 Mar 3. Nat Rev Microbiol. 2022. PMID: 35241807 Review.
-
Antibacterial mechanism of daptomycin antibiotic against Staphylococcus aureus based on a quantitative bacterial proteome analysis.J Proteomics. 2017 Jan 6;150:242-251. doi: 10.1016/j.jprot.2016.09.014. Epub 2016 Sep 29. J Proteomics. 2017. PMID: 27693894
Cited by
-
Investigating topical delivery of erythromycin laden into lipid nanocarrier for enhancing the anti-bacterial activity.Saudi Pharm J. 2024 Sep;32(9):102152. doi: 10.1016/j.jsps.2024.102152. Epub 2024 Jul 28. Saudi Pharm J. 2024. PMID: 39165579 Free PMC article.
-
Multipad agarose plate: a rapid and high-throughput approach for antibiotic susceptibility testing.J R Soc Interface. 2024 Mar;21(212):20230730. doi: 10.1098/rsif.2023.0730. Epub 2024 Mar 27. J R Soc Interface. 2024. PMID: 38531408 Free PMC article.
-
Antibiotic resistant bacteria survive treatment by doubling while shrinking.mBio. 2024 Dec 11;15(12):e0237524. doi: 10.1128/mbio.02375-24. Epub 2024 Nov 20. mBio. 2024. PMID: 39565111 Free PMC article.
-
Cell morphology as biomarker of carbapenem exposure.J Antibiot (Tokyo). 2024 Sep;77(9):600-611. doi: 10.1038/s41429-024-00749-9. Epub 2024 Jun 12. J Antibiot (Tokyo). 2024. PMID: 38866921
-
Gene expression tradeoffs determine bacterial survival and adaptation to antibiotic stress.bioRxiv [Preprint]. 2024 Jan 23:2024.01.20.576495. doi: 10.1101/2024.01.20.576495. bioRxiv. 2024. Update in: PRX Life. 2024 Jan-Mar;2(1):013010. doi: 10.1103/prxlife.2.013010. PMID: 38328084 Free PMC article. Updated. Preprint.
References
-
- Andrews Jennifer M. Determination of minimum inhibitory concentrations. Journal of Antimicrobial Chemotherapy, 48(suppl_1):5–16, 2001. - PubMed
-
- Scott Matthew, Gunderson Carl W, Mateescu Eduard M, Zhang Zhongge, and Hwa Terence. Interdependence of cell growth and gene expression: origins and consequences. Science, 330(6007):1099–1102, 2010. - PubMed
Publication types
MeSH terms
Substances
Grants and funding
LinkOut - more resources
Full Text Sources
Medical