. 2022 Dec;530(18):3270-3287.
doi: 10.1002/cne.25413. Epub 2022 Sep 12.

Quantitative spatial analysis reveals that the local axons of lamina I projection neurons and interneurons exhibit distributions that predict distinct roles in spinal sensory processing

Affiliations

Quantitative spatial analysis reveals that the local axons of lamina I projection neurons and interneurons exhibit distributions that predict distinct roles in spinal sensory processing

Éva Kókai et al. J Comp Neurol. 2022 Dec.

Abstract

Our knowledge about the detailed wiring of neuronal circuits in the spinal dorsal horn (DH), where initial sensory processing takes place, is still very sparse. While a substantial amount of data is available on the somatodendritic morphology of DH neurons, the laminar and segmental distribution patterns and consequential function of individual axons are much less characterized. In the present study, we fully reconstructed the axonal and dendritic processes of 10 projection neurons (PNs) and 15 interneurons (INs) in lamina I of the rat, to reveal quantitative differences in their distribution. We also performed whole-cell patch-clamp recordings to test the predicted function of certain axon collaterals. In line with our earlier qualitative description, we found that lamina I INs in the lateral aspect of the superficial DH send axon collaterals toward the medial part and occupy mostly laminae I-III, providing anatomical basis for a lateromedial flow of information within the DH. Local axon collaterals of PNs were more extensively distributed including dorsal commissural axon collaterals that might refer to those reported earlier linking the lateral aspect of the left and right DHs. PN collaterals dominated the dorsolateral funiculus and laminae IV-VI, suggesting propriospinal and ventral connections. Indeed, patch-clamp recordings confirmed the existence of a dorsoventral excitatory drive upon activation of neurokinin-1 receptors that, although being expressed in various lamina I neurons, are specifically enriched in PNs. In summary, lamina I PNs and INs have almost identical dendritic input fields, while their segmental axon collateral distribution patterns are distinct. INs, whose somata reside in lamina I, establish local connections, may show asymmetry, and contribute to bridging the medial and lateral halves of the DH. PNs, on the other hand, preferably relay their integrated dendritic input to deeper laminae of the spinal gray matter where it might be linked to other ascending pathways or the premotor network, resulting in a putative direct contribution to the nociceptive withdrawal reflex.

Keywords: dorsoventral excitatory drive; laminar axon density; mediolateral asymmetry; quantitative analysis; withdrawal reflex.


Conflict of interest statement

The authors declare no conflict of interest.

Figures

FIGURE 1
FIGURE 1
Representative examples of PN and IN axons. Neurolucida reconstructions allowing comparison of the density of collaterals in a lateral‐collateral‐type (a) and a mixed‐collateral‐type PN (b). Note that the majority of collaterals target laminae deeper than lamina II. (c, d) Two examples for novel types of commissural PN axon collaterals. (c) Ventrally oriented axon collateral branching from the main axon on the ipsilateral side and crossing the midline in the dorsal gray commissure through lamina X. (d) Collateral branching on the contralateral side from the main axon after crossing the midline. (e) Photomicrograph showing the boxed region from panel d, where the collateral branches from the main axon just below the central canal. (f) Aligned reconstruction of a lamina I IN with a compact slightly asymmetrical axon, dominating the lateral side of the cell. (g) Lamina I IN with a sparser, more symmetrical axon centered on the soma. Note that in both cases (f, g), the axon occupies mostly laminae I–II. (h) Reconstruction of a laterally positioned IN with a recurrent axon that fills also the medial aspect of the DH. (i) Photomicrograph showing a dorsally spanning lower order collateral that branches from a higher order axon in a perpendicular, candle‐like manner. Note that for all aligned reconstructions, the spinal cord, gray matter, and central canal contours were taken from the section that contains the soma; therefore, some of the processes in distant sections may appear to fall outside the boundaries of the contours. The irregularity of the contours is due to faithful representation of the section contours after the shrinkage and distortions that occurred during histological processing. Arrow, axon collateral in PNs/lower order branch in INs; arrowhead, main axon in PNs/higher order branch in INs; dashed line, gray matter border toward dorsal funiculus. Scale bars: 250 μm in the reconstructions; 50 μm in panel e; 100 μm in panel i. Soma and dendrites are in blue, and axon is orange in all the reconstructions.
FIGURE 2
FIGURE 2
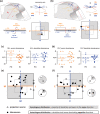
Mediolateral and rostrocaudal symmetry of PN and IN processes. (a, b) Schematic drawings explaining spatial distribution analyses of labeled cell processes in the reconstructed and aligned serial sections. (a) For determining mediolateral symmetry of the processes, a dorsoventral guideline was drawn perpendicular to the tangential line touching the dorsal horn (DH) surface at the point where the soma was located. Guidelines are indicated by the red‐dashed lines. The same guideline was used in all the aligned serial sections. Processes medial (M) and lateral (L) to the guideline were considered to be on the corresponding side of the soma. The percentage of processes medial and lateral to the soma was then compared to a 50−50% (absolute symmetry) case resulting in a lateral or medial dendrite and axon dominance value. These dominance values were then used as coordinates of the given neuron in the symmetry matrix. A neuron with absolutely symmetric distribution of its dendrites and axon would be located in the center of the symmetry matrix. Cells that fall in gray quadrants of the symmetry matrix have dendrites and axon that show similar distribution (homologous), while cells in the white quadrants have contrasting process distributions (heterologous). The dotted square indicates the −25% to 25% dominance area of the symmetry matrix. (b) Rostrocaudal symmetry was analyzed in the same manner using an imaginary plane (zero level in Z) crossing the largest diameter of the soma. The location of the zero plane in the serial reconstruction is indicated with the dashed red line. (c) Mediolateral axon (orange) and dendrite (blue) dominance values of PNs (hollow circles) and INs (full circles). Axon collaterals of PNs showed a significant lateral dominance compared to axons of INs. (d) Rostrocaudal axon (orange) and dendrite (blue) dominance of PNs (hollow circles) and INs (full circles). While both axon collaterals and dendrites of PNs showed a wider distribution, there were no significant differences of the means compared to similar processes of INs. (e) Mediolateral symmetry matrix of PNs (hollow circles) and INs (full circles). Majority (78%) of PNs showed homologous distribution of axon collaterals and dendritic processes, while distribution of IN axonal and dendritic processes was mostly heterologous. (f) Rostrocaudal symmetry matrix of PNs and INs showing mostly (78%) heterologous distribution of PNs and no preference for homologous or heterologous distribution of INs, as roughly half of them fell in either category.
FIGURE 3
FIGURE 3
Mediolateral (a) and rostrocaudal (b) symmetry matrices of PNs and INs. Each cell is represented by a symbol reflecting its somatodendritic type (Lima & Coimbra, 1986), while the color of the symbol indicates the firing pattern (Luz et al., 2014). None of the investigated features correlated with the symmetry preference.
FIGURE 4
FIGURE 4
For the soma‐centered‐distribution analysis (a), the rostrocaudal guideline and the zero Z level guiding plane have been used together. The resulting spatial quadrants around the soma are labeled as rostromedial (RM), caudomedial (CM), rostrolateral (RL), and caudolateral (CL). Dendrites, blue; axon, orange. Axon and dendrite distribution of the schematic neuron in RM, RL, CM, and CL spatial quadrants. The percentage of axon falling in a given spatial quadrant is indicated by the orange color scale in larger squares, while dendrite distribution is shown in the overlying smaller squares using the blue color scale. (b) PNs with the axon originating from a major dendrite or from the soma. The spatial quadrant where the axon‐bearing dendrite resides is indicated by a hole in the blue square. The majority of axon bearing dendrites in PNs are located medial to the soma. (c) Soma‐centered distribution of PNs based on their firing pattern reveals that axon‐bearing dendrites are more frequent among the multipolar type. (d) Flattened and pyramidal PNs more often showed polarized soma‐centered distribution than multipolar PNs. (e) INs with axon‐bearing dendrites and ones with (f) regular somatic axon origin. Axon‐bearing dendrites were more often located laterally and caudally to the soma. (g) Axon‐bearing dendrites were present in INs with all firing types. (c) Similar to PNs, axon‐bearing dendrites were more frequent in multipolar INs.
FIGURE 5
FIGURE 5
Dendrite and axon distribution of PNs and INs in gray matter laminae and white matter funiculi. (a) The mean dendritic length of both PNs and INs was the highest in superficial laminae (I–II) and in the lateral funiculus of the white matter. The distribution pattern of the two groups was almost identical. (b) Mean axon length showed significant differences between the PNs and INs in most parts of the DH and in the lateral funiculus. While laminae II and III–IV contained most parts of the IN axons, the largest portion of PN axon collaterals was located in laminae V–VI and in the lateral funiculus. Mann–Whitney test: *p < .05; **p < .01; ***p < .001. (c) Dendritic prevalence maps (percentage of neurons with process pieces in the particular region) projected in the transverse plane along the rostrocaudal axis centered on the soma‐containing section also show almost identical occurrence of PN and IN dendrites in the investigated laminae. (d) The axon prevalence map projected to the transverse plane and individual prevalences in the serial sections centered to the soma.
FIGURE 6
FIGURE 6
Total axon length and average varicosity densities of PN and IN axons. While the total axon length nicely reflected the proportional distributions shown in Figure 5, INs had at least 10 times more axon (a) than PN collaterals (b) in all the investigated gray matter laminae and white matter funiculi. (c, d) The average density of varicosities along IN axons and PN axon collaterals was almost identical in all investigated regions.
FIGURE 7
FIGURE 7
Ventrally directed axons of DH NK1 receptor expressing neurons contribute to an excitatory drive onto neurons in ventral laminae. (a) Application of substance P (SP; 1 μM) in acute spinal cord slices increases the number of spontaneous EPSPs recorded from neurons located in laminae V–VII. Repeated application of SP resulted in a similar but less pronounced increase. (b) The mean EPSP number was significantly increased during application of SP. Although the increase in the mean EPSP number was not fully blocked by a low concentration (10 nM) of the SP antagonist SR140333, the SP‐induced modest increase in the EPSP frequency did not reach significance threshold. Higher concentrations of the antagonist (50 nM, 200 nM) blocked the effect of SP. Application of TTX and the mechanical separation of the DH effectively blocked the SP‐induced mean EPSP number increase. (c) The average ratio of SP evoked mean EPSP number and control mean EPSP number was significantly reduced (close to 1) in case of effective concentrations of SR140333 (50–200 nM) and TTX (500 nM) or mechanical separation of the DH, as compared to the mean EPSP number ratio (2.59 ± 0.58) for the application of SP alone. Dashed line, ratio = 1; white numbers, numbers of experiments; two‐sample Student's t‐test with Welch correction: *p < .05. (d) The scheme shows the locations of the recorded neurons, and color code reflects the type of the experiment. Full circles indicate cells that had been recovered, while hollow circles show locations of the cell based on the maps drawn from the slice during the recording. (e) Hypothetical scheme showing how ventral collaterals (orange) of (1) ipsilateral PNs (hollow; blue), (2) commissural collaterals (orange) of contralateral PNs (hollow; blue), and (3) local axons (orange) of INs (filled; blue) may excite neurons in ventral laminae (green) directly or indirectly via one or more putative excitatory INs (black) with unknown location. The red plus signs indicate PNs and INs as putative NK1 receptor‐bearing neurons responding to SP application. The size of the red plus sign reflects the probability of SP activation.

References

    1. Al‐Khater, K. M. , Kerr, R. , & Todd, A. J. (2008). A quantitative study of spinothalamic neurons in laminae I, III, and IV in lumbar and cervical segments of the rat spinal cord. Journal of Comparative Neurology, 511(1), 1–18. 10.1002/cne.21811 - DOI - PMC - PubMed
    1. Al Ghamdi, K. S. , Polgar, E. , & Todd, A. J. (2009). Soma size distinguishes projection neurons from neurokinin 1 receptor‐expressing interneurons in lamina I of the rat lumbar spinal dorsal horn. Neuroscience, 164(4), 1794–1804. 10.1016/j.neuroscience.2009.09.071 - DOI - PMC - PubMed
    1. Beal, J. A. , Penny, J. E. , & Bicknell, H. R. (1981). Structural diversity of marginal (lamina I) neurons in the adult monkey (Macaca mulatta) lumbosacral spinal cord: A Golgi study. Journal of Comparative Neurology, 202(2), 237–254. 10.1002/cne.902020209 - DOI - PubMed
    1. Bennett, G. J. , Abdelmoumene, M. , Hayashi, H. , Hoffert, M. J. , & Dubner, R. (1981). Spinal cord layer I neurons with axon collaterals that generate local arbors. Brain Research, 209(2), 421–426. 10.1016/0006-8993(81)90164-5 - DOI - PubMed
    1. Braz, J. , Solorzano, C. , Wang, X. , & Basbaum, A. I. (2014). Transmitting pain and itch messages: A contemporary view of the spinal cord circuits that generate gate control. Neuron, 82(3), 522–536. 10.1016/j.neuron.2014.01.018 - DOI - PMC - PubMed

Publication types

Substances