. 2022 Sep 12:11:e77975.
doi: 10.7554/eLife.77975.

The acid ceramidase/ceramide axis controls parasitemia in Plasmodium yoelii-infected mice by regulating erythropoiesis

Affiliations

The acid ceramidase/ceramide axis controls parasitemia in Plasmodium yoelii-infected mice by regulating erythropoiesis

Anne Günther et al. Elife. .

Abstract

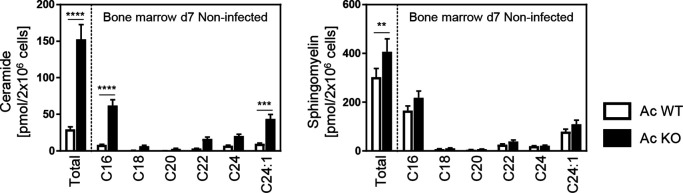
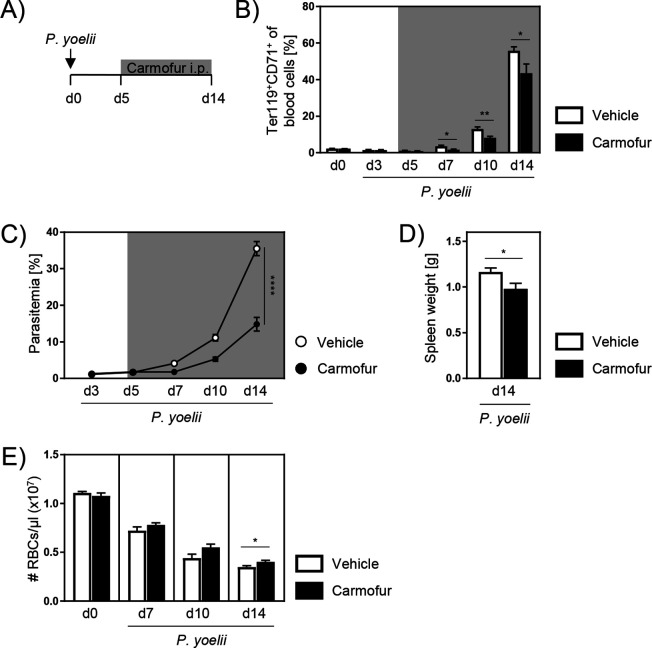
Acid ceramidase (Ac) is part of the sphingolipid metabolism and responsible for the degradation of ceramide. As bioactive molecule, ceramide is involved in the regulation of many cellular processes. However, the impact of cell-intrinsic Ac activity and ceramide on the course of Plasmodium infection remains elusive. Here, we use Ac-deficient mice with ubiquitously increased ceramide levels to elucidate the role of endogenous Ac activity in a murine malaria model. Interestingly, ablation of Ac leads to alleviated parasitemia associated with decreased T cell responses in the early phase of Plasmodium yoelii infection. Mechanistically, we identified dysregulated erythropoiesis with reduced numbers of reticulocytes, the preferred host cells of P. yoelii, in Ac-deficient mice. Furthermore, we demonstrate that administration of the Ac inhibitor carmofur to wildtype mice has similar effects on P. yoelii infection and erythropoiesis. Notably, therapeutic carmofur treatment after manifestation of P. yoelii infection is efficient in reducing parasitemia. Hence, our results provide evidence for the involvement of Ac and ceramide in controlling P. yoelii infection by regulating red blood cell development.

Keywords: ceramide; infectious disease; malaria; microbiology; mouse; sphingolipids.


Conflict of interest statement

AG, MH, HA, FS, YV, BK, KM, KL, EG, JB, AW, WH No competing interests declared

Figures

Figure 1.
Figure 1.. Ceramide accumulation in acid ceramidase (Ac) knockout (KO) mice.
(A) Induction of Ac deficiency in Asah1/Rosa26creER/+ mice (Ac KO) was achieved by intraperitoneal injection (i.p.) of 4 mg tamoxifen on days −8, –6, and –4. Tamoxifen-treated Asah1/Rosa26+/+ littermates (Ac WT) were used as control. (B) Ac KO validation was performed by analyzing Asah1 mRNA expression via RT-qPCR in spleen, thymus, and liver of Ac KO mice and Ac WT littermates as control on day 0 (n = 5–6). (C) Ceramide levels in spleen were determined by high-performance liquid chromatography mass spectrometry (HPLC-MS/MS) (n = 3–4). Data are presented as mean ± SEM. Statistical analyses were performed using Mann–Whitney U-test for (B) and two-way ANOVA, followed by Sidak’s post-test for (C) (**p<0.01, ****p<0.0001).
Figure 2.
Figure 2.. P.yoelii-infected acid ceramidase (Ac) knockout (KO) mice show decreased parasitemia with less T cell activation in the early phase of infection.
(A) Parasitemia of P. yoelii-infected Ac WT and Ac KO mice was determined at indicated time points by microscopy of Giemsa-stained blood films (n = 9–18). (B) Spleen weight on days 7 and 14 post infection (p.i.) (n = 7–9). (C) Frequencies of viable CD4+, CD8+, and regulatory T cells (Foxp3+ of CD4+) were analyzed by flow cytometry 7 days p.i. (n = 7–9). (D) Percentages of Ki67-, CD49dCD11a/CD11a-, and PD1-expressing CD4+ and CD8+ T cells were determined by flow cytometry 7 days p.i. (n = 7–9). Data from three to five independent experiments are presented as mean ± SEM. Statistical analyses were performed using Mann–Whitney U-test for (A) and unpaired Student’s t-test for (B–D) (**p<0.01, ***p<0.001, ****p<0.0001).
Figure 2—figure supplement 1.
Figure 2—figure supplement 1.. T cell response of P. yoelii-infected acid ceramidase (Ac) knockout (KO) and Ac wildtype (WT) mice 14 days post infection (p.i.).
Percentages of Ki67-, CD49dCD11a/CD11a-, and PD1-expressing CD4+ and CD8+ T cells in spleen of P. yoelii-infected Ac WT mice and Ac KO littermates were determined by flow cytometry 14 days p.i. (n = 9). Data from three independent experiments are presented as mean ± SEM.
Figure 3.
Figure 3.. T cell-specific and myeloid-specific acid ceramidase (Ac) deletion has no impact on the course of P. yoelii infection.
(A) The knockout of Ac in T cells was confirmed by analyzing Asah1 mRNA expression of sorted splenic CD4+ and CD8+ T cells from naïve Asah1/Cd4cre/+ (Ac CD4cre knockout [KO]) mice and Asah1/Cd4+/+ littermates (Ac CD4cre wildtype [WT]) as controls via RT-qPCR (n = 2–4). (B) Parasitemia (left panel) and spleen weight (right panel) of P. yoelii-infected Ac CD4cre KO mice and Ac CD4cre WT littermates was determined at indicated time points (n = 7–10). (C) The knockout of Ac in myeloid cells was confirmed by analyzing Asah1 mRNA expression of macrophages, dendritic cells, and neutrophils isolated from spleen, peritoneal lavage (pLavage), and blood of naïve Asah1/Lyz2cre/+ (Ac Lyz2cre KO) mice and Asah1/Lyz2+/+ littermates (Ac Lyz2cre WT) as controls via RT-qPCR (n = 2–6). (D) Parasitemia (left panel) and spleen weight (right panel) of P. yoelii-infected Ac Lyz2cre KO and Ac Lyz2cre WT mice was determined at indicated time points (n = 9). Data from two independent experiments each are presented as mean ± SEM.
Figure 4.
Figure 4.. Acid ceramidase (Ac) knockout (KO) affects the erythropoiesis.
(A) Representative flow cytometry dot plot of Ter119+CD71+ reticulocytes in blood of Ac wildtype (WT) and Ac KO mice on day 0. (B) Frequencies of reticulocytes in blood of Ac WT and Ac KO mice were determined by flow cytometry on day 0 and after P. yoelii infection on days 3, 7, and 10 (n = 8–15). (C) Representative flow cytometry gating strategy of erythropoietic developmental stages in bone marrow of Ac WT and Ac KO mice on day 0. Erythropoietic cells were defined as CD45- and Ter119+. Depending on size (forward scatter [FSC]) and CD71 expression, cells were defined as erythroblasts (Eb, CD71+FSChigh), reticulocytes (Ret, CD71+FSClow), and mature erythrocytes (Ery, CD71-FSClow). (D) Frequencies of different erythropoietic stages in bone marrow of noninfected Ac WT and Ac KO mice on day 0 (left panel) and after P. yoelii infection on day 7 (right panel) were analyzed by flow cytometry (n = 6–11). Results from 2–4 independent experiments are presented as mean ± SEM. Statistical analyses were performed using Mann–Whitney U-test for (B) and unpaired Student’s t-test for (D) (*p<0.05, ***p<0.001, ****p<0.0001).
Figure 4—figure supplement 1.
Figure 4—figure supplement 1.. Erythropoiesis of noninfected acid ceramidase (Ac) knockout (KO) and Ac wildtype (WT) mice.
Frequencies of different erythropoietic stages in bone marrow of noninfected Ac WT and Ac KO mice on day 7 were analyzed by flow cytometry (n = 12). Data from three independent experiments are presented as mean ± SEM. Statistical analyses were performed using unpaired Student’s t-test (*p<0.05).
Figure 5.
Figure 5.. Alterations of sphingolipid metabolism in bone marrow of acid ceramidase (Ac) knockout (KO) mice.
(A) Ac KO validation in bone marrow of noninfected (d0) and P. yoelii-infected (d7 and d10) Ac KO mice and Ac wildtype (WT) littermates as control by RT-qPCR (n = 5–9). (B) Fold change of neutral ceramidase (Asah2) expression in bone marrow on day 0 (n = 6–7). (C) Ceramide, (D) sphingomyelin, (E) sphingosine, and (F) S1P levels in bone marrow of noninfected Ac WT and Ac KO mice on day 0 (left panels), and 7 days post infection (p.i.) (right panels) were determined by high-performance liquid chromatography mass spectrometry (HPLC-MS/MS) (n = 3–6). Data are presented as mean ± SEM. Statistical analyses were performed using Mann–Whitney U-test for (A), unpaired Student’s t-test for (B) and (F), and two-way ANOVA, followed by Sidak’s post-test for (C) and (D) (*p<0.05, **p<0.01, ***p<0.001, ****p<0.0001).
Figure 5—figure supplement 1.
Figure 5—figure supplement 1.. Sphingolipid level of noninfected acid ceramidase (Ac) knockout (KO) and Ac wildtype (WT) mice.
Ceramide (left panel) and sphingomyelin (right panel) levels in bone marrow of noninfected Ac WT and Ac KO mice on day 7 were determined by high-performance liquid chromatography mass spectrometry (HPLC-MS/MS) (n = 7–8). Data are presented as mean ± SEM. Statistical analyses were performed using two-way ANOVA, followed by Sidak’s post-test (**p<0.01, ***p<0.001, ****p<0.0001).
Figure 6.
Figure 6.. Carmofur treatment leads to decreased parasitemia with lower reticulocyte frequencies.
(A) For pharmacological inhibition of acid ceramidase (Ac), C57BL/6 mice were either treated with 750 µg carmofur or with vehicle as control by daily intraperitoneal (i.p.) injection starting 1 day prior to P. yoelii infection. (B) Parasitemia of infected carmofur- and vehicle-treated mice was determined at indicated time points by microscopy of Giemsa-stained blood films (n = 10–11). (C) Spleen weight of P. yoelii-infected carmofur- and vehicle-treated mice 7 days post infection (p.i.) (n = 9). (D) Ceramide, sphingosine, S1P, and sphingomyelin levels in bone marrow of infected carmofur- and vehicle-treated mice 7 days p.i. were determined by high-performance liquid chromatography mass spectrometry (HPLC-MS/MS) (n = 6–9). (E) Frequencies of Ter119+CD71+ reticulocytes in blood of P. yoelii-infected carmofur- and vehicle-treated mice were analyzed by flow cytometry on days 0, 3, 7, and 10 (n = 12–18). (F) Percentages of erythroblasts (Eb, CD71+FSChigh), reticulocytes (Ret, CD71+FSClow), and mature erythrocytes (Ery, CD71-FSClow) in bone marrow of P. yoelii-infected carmofur- and vehicle-treated mice on day 7 (n = 9). (G) P. falciparum growth inhibition assay to test potential effects of carmofur on intraerythrocytic development in vitro. Micrographs of infected erythrocytes that were either nontreated or exposed 48 hr to increasing doses of carmofur (top rows) or chloroquine (bottom row). Shown are representative images of standard growth assays (left panel). Bars: 2 µm. Dose–response assay (48 hr) of carmofur or DMSO as control against asexual P. falciparum growth (starting at ring stages, n = 3 in triplicates). 50% inhibitory concentration (IC50) is indicated. Results from 2–3 independent experiments are presented as mean ± SEM. Statistical analyses were performed using two-way ANOVA, followed by Sidak’s post-test for (A), unpaired Student’s t-test for (C) and (F), and Mann–Whitney U-test for (D) and (E) (*p<0.05, **p<0.01, ****p<0.0001).
Figure 6—figure supplement 1.
Figure 6—figure supplement 1.. Sphingolipid level and erythropoiesis of carmofur-treated noninfected and P. yoelii-infected mice.
(A) Ceramide, sphingosine, S1P, and sphingomyelin levels in bone marrow of noninfected carmofur- and vehicle-treated mice on day 7 were determined by high-performance liquid chromatography mass spectrometry (HPLC-MS/MS) (n = 6–9). (B) Frequencies of Ter119+CD71+ reticulocytes in blood of noninfected carmofur- and vehicle-treated mice were analyzed by flow cytometry on days 0, 3, 7, and 10 (n = 10–13). (C) Percentages of erythroblasts (Eb, CD71+FSChigh), reticulocytes (Ret, CD71+FSClow), and mature erythrocytes (Ery, CD71-FSClow) in bone marrow of noninfected carmofur- and vehicle-treated mice on day 7 (n = 9). (D) Spleen weight and erythropoietic stages in bone marrow of P. yoelii-infected and noninfected carmofur- and vehicle-treated mice on days 3 and 10 (E). Results from 1–3 independent experiments are presented as mean ± SEM. Depending on Gaussian distribution (tested with D’Agostino–Pearson omnibus and Shapiro–Wilk normality tests), unpaired Student’s t-test or Mann–Whitney U-test was used (*p<0.05, **p<0.01, ***p<0.001, ****p<0.0001).
Figure 6—figure supplement 2.
Figure 6—figure supplement 2.. P. falciparum growth inhibition assay with chloroquine.
Dose–response assay (48 hr) of chloroquine against asexual P. falciparum growth (starting at ring stages, n = 3 in triplicates). Data from three independent experiments are shown as mean ± SEM. 50% inhibitory concentration (IC50) is indicated.
Figure 7.
Figure 7.. Carmofur application as therapeutic treatment of P. yoelii infection.
(A) As therapeutic approach, C57BL/6 mice were infected with P. yoelii on day 0 and treated with 750 µg carmofur or vehicle only from day 5 post infection (p.i.) onward. (B) Percentages of Ter119+CD71+ reticulocytes in blood were analyzed by flow cytometry at indicated time points (n = 5–10). (C) Parasitemia of infected carmofur- and vehicle-treated mice was determined 3, 5, 7, 10, and 14 days p.i. by microscopy of Giemsa-stained blood films (n = 10). (D) Spleen weight of P. yoelii-infected carmofur- and vehicle-treated mice 14 days p.i. (n = 10). (E) Red blood cell (RBC) count per microliter blood of infected carmofur- and vehicle-treated mice was determined with an automated hematology analyzer (n = 5–10). Results from two independent experiments are summarized as mean ± SEM. Statistical analyses were performed using Mann–Whitney U-test for (B), two-way ANOVA, followed by Sidak’s post-test for (C), and unpaired Student’s t-test for (D) and (E) (*p<0.05, **p<0.01, ****p<0.0001).

Similar articles

Cited by

References

    1. AlKadi HO. Antimalarial drug toxicity: a review. Chemotherapy. 2007;53:385–391. doi: 10.1159/000109767. - DOI - PubMed
    1. Aurrecoechea C, Brestelli J, Brunk BP, Dommer J, Fischer S, Gajria B, Gao X, Gingle A, Grant G, Harb OS, Heiges M, Innamorato F, Iodice J, Kissinger JC, Kraemer E, Li W, Miller JA, Nayak V, Pennington C, Pinney DF, Roos DS, Ross C, Stoeckert CJ, Treatman C, Wang H. PlasmoDB: a functional genomic database for malaria parasites. Nucleic Acids Research. 2009;37:D539–D543. doi: 10.1093/nar/gkn814. - DOI - PMC - PubMed
    1. Becker KA, Verhaegh R, Verhasselt H-L, Keitsch S, Soddemann M, Wilker B, Wilson GC, Buer J, Ahmad SA, Edwards MJ, Gulbins E. Acid ceramidase rescues cystic fibrosis mice from pulmonary infections. Infection and Immunity. 2021;89:e00677-20. doi: 10.1128/IAI.00677-20. - DOI - PMC - PubMed
    1. Casals-Pascual C, Huang H, Lakhal-Littleton S, Thezenas ML, Kai O, Newton CRJC, Roberts DJ. Hepcidin demonstrates a biphasic association with anemia in acute Plasmodium falciparum malaria. Haematologica. 2012;97:1695–1698. doi: 10.3324/haematol.2012.065854. - DOI - PMC - PubMed
    1. Chang KH, Tam M, Stevenson MM. Inappropriately low reticulocytosis in severe malarial anemia correlates with suppression in the development of late erythroid precursors. Blood. 2004a;103:3727–3735. doi: 10.1182/blood-2003-08-2887. - DOI - PubMed

Publication types