

Developing Drosophila melanogaster Models for Imaging and Optogenetic Control of Cardiac Function
- PMID: 36094265
- PMCID: PMC9825051
- DOI: 10.3791/63939
Developing Drosophila melanogaster Models for Imaging and Optogenetic Control of Cardiac Function
Abstract
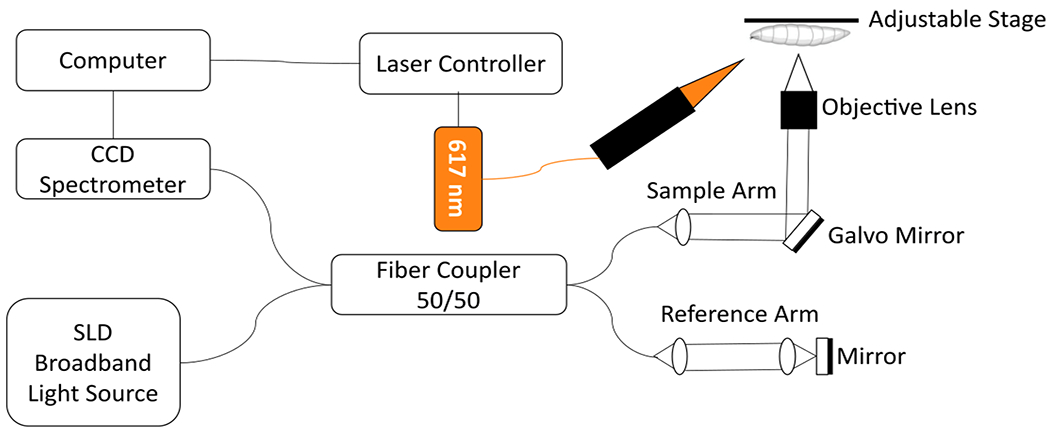
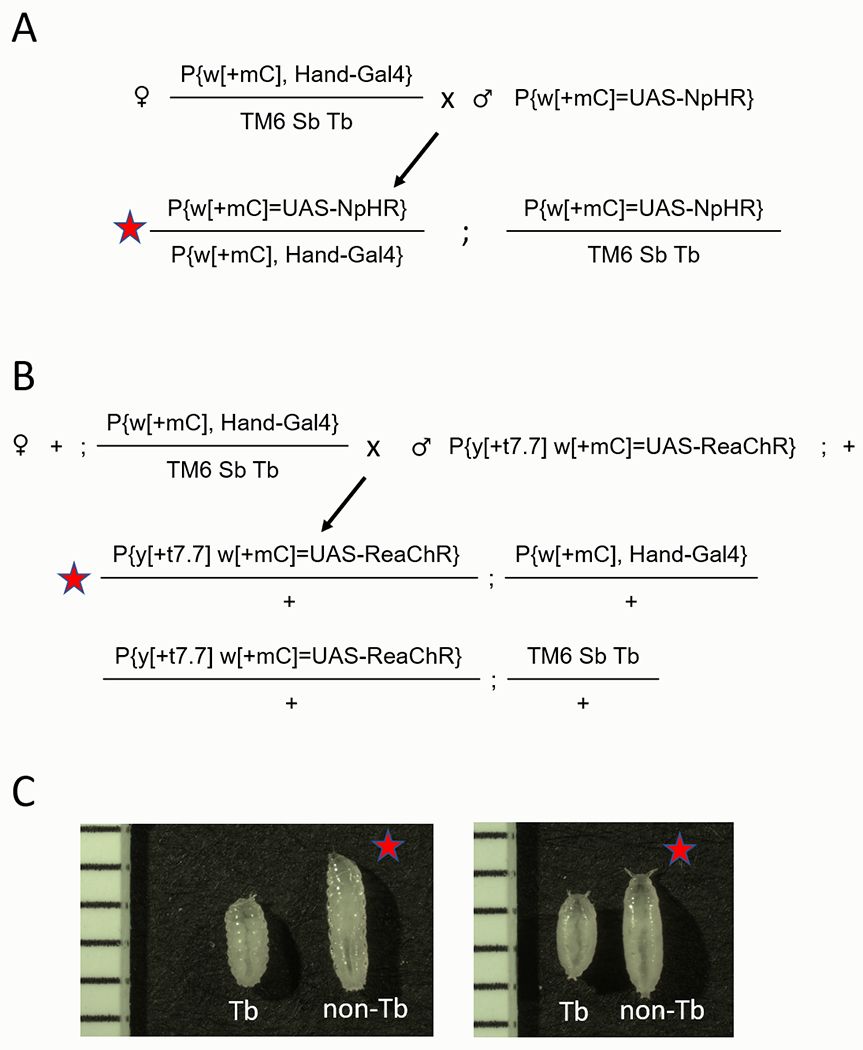
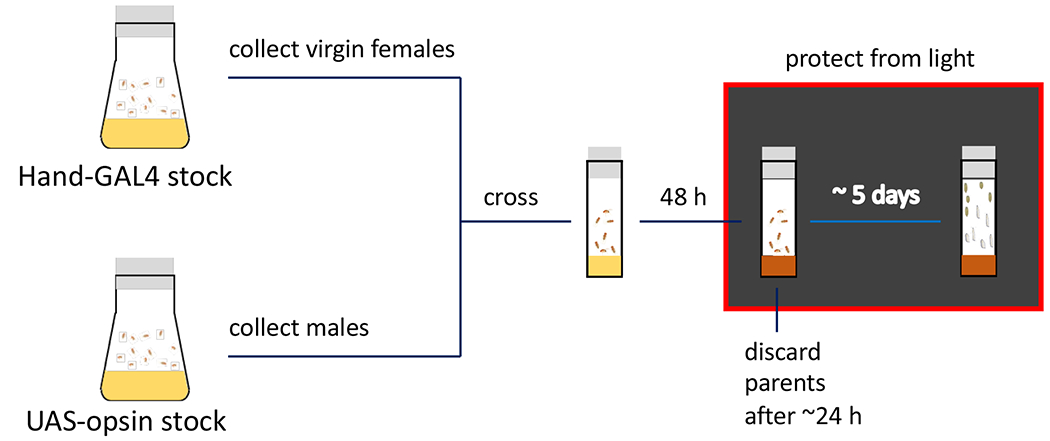
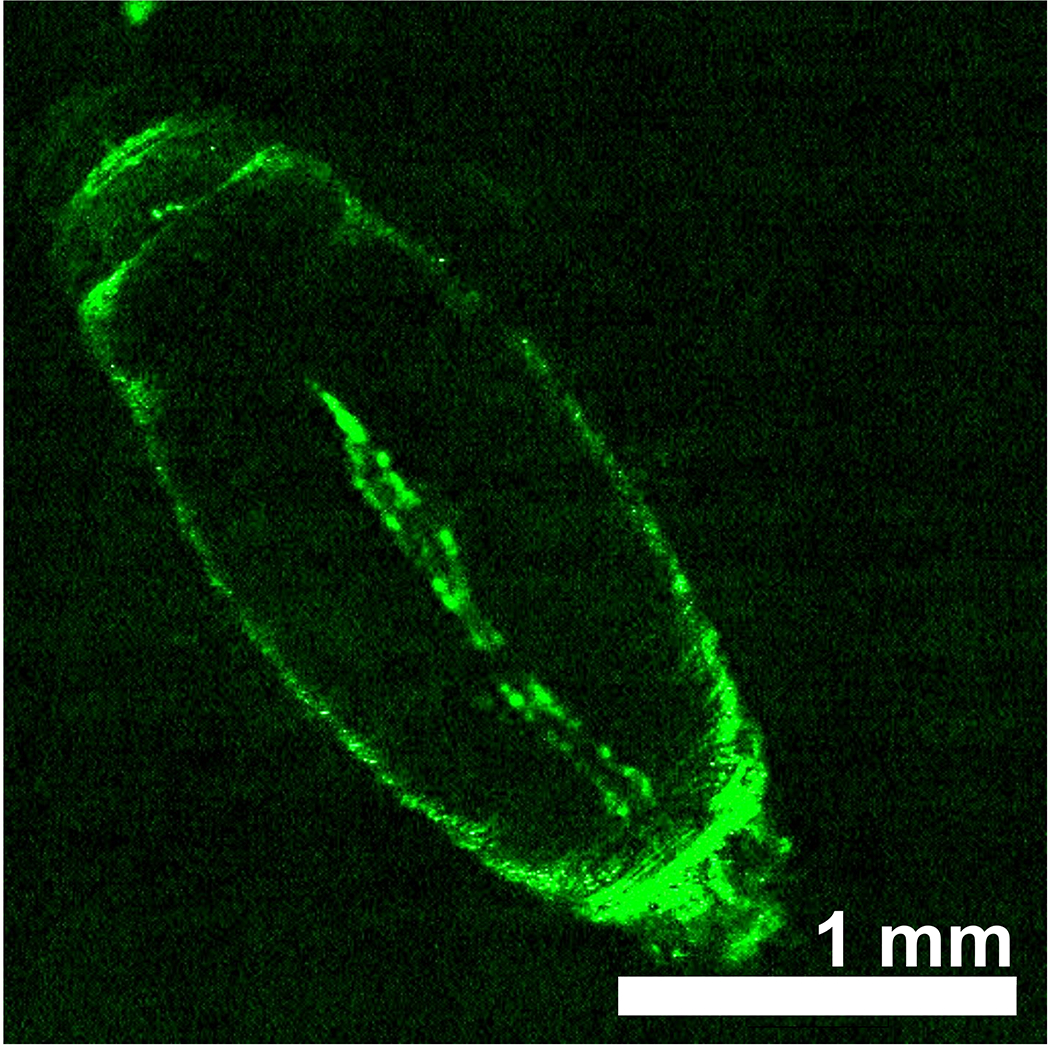
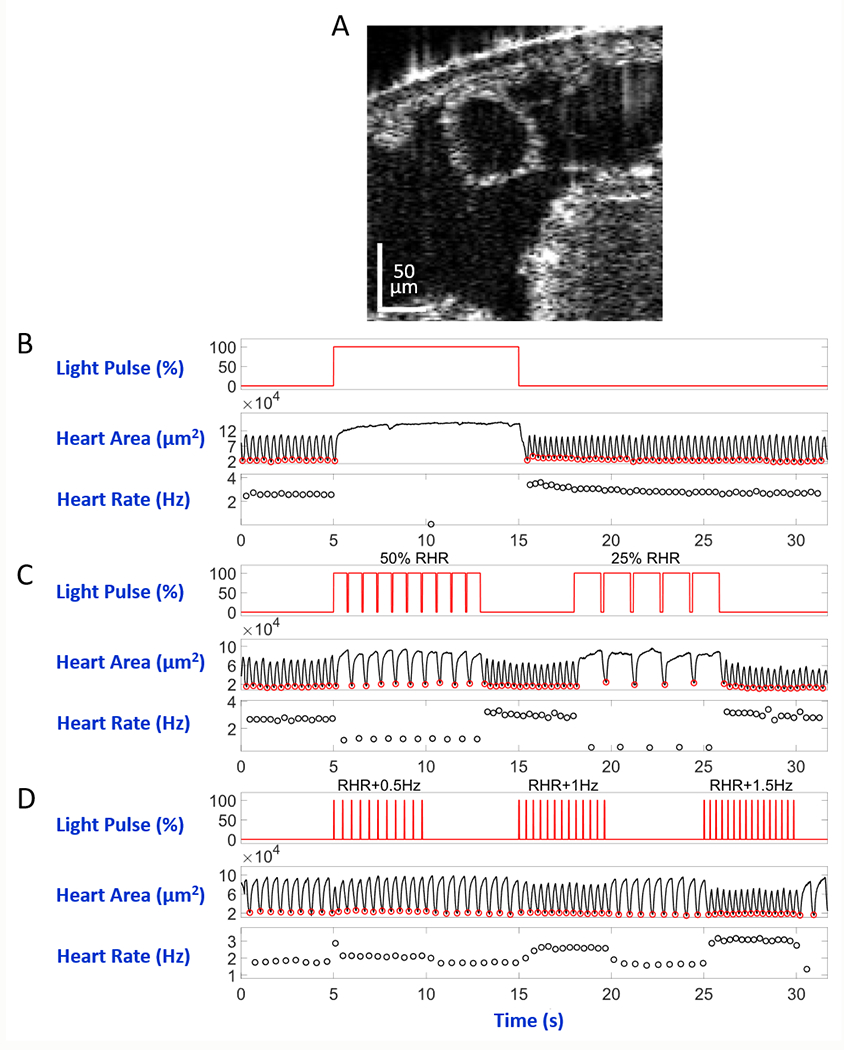
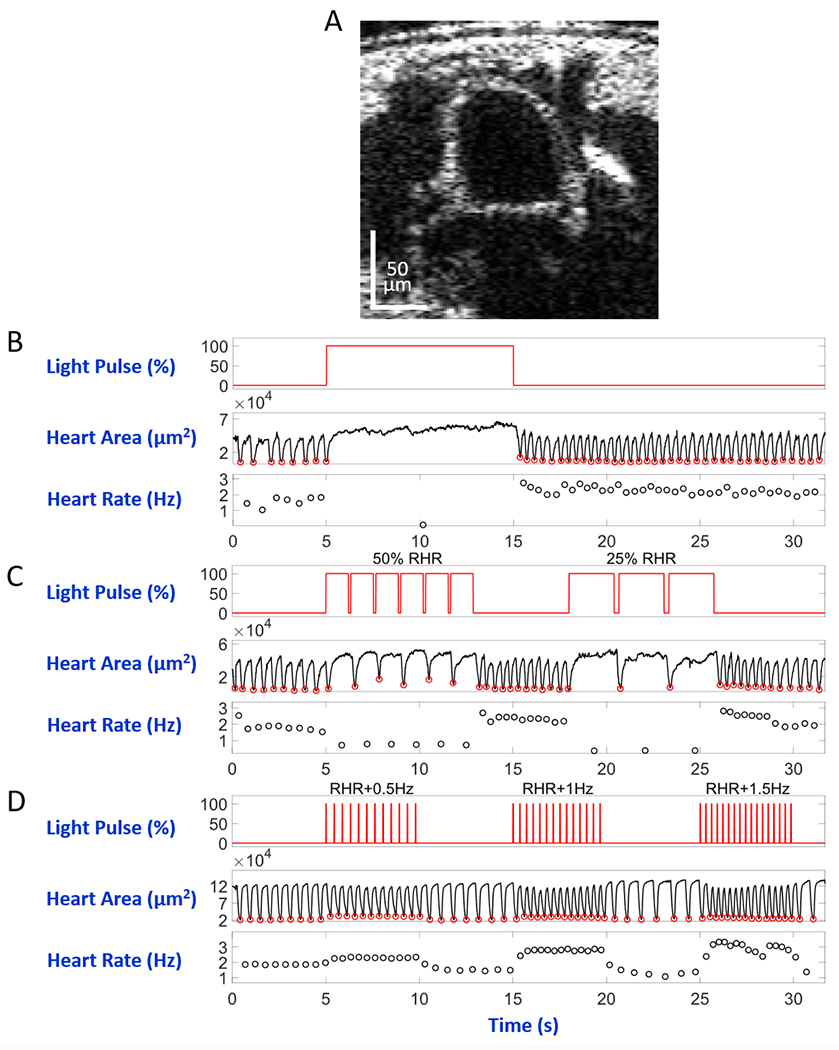
Using Drosophila melanogaster (fruit fly) as a model organism has ensured significant progress in many areas of biological science, from cellular organization and genomic investigations to behavioral studies. Due to the accumulated scientific knowledge, in recent years, Drosophila was brought to the field of modeling human diseases, including heart disorders. The presented work describes the experimental system for monitoring and manipulating the heart function in the context of a whole live organism using red light (617 nm) and without invasive procedures. Control over the heart was achieved using optogenetic tools. Optogenetics combines the expression of light-sensitive transgenic opsins and their optical activation to regulate the biological tissue of interest. In this work, a custom integrated optical coherence tomography (OCT) imaging and optogenetic stimulation system was used to visualize and modulate the functioning D. melanogaster heart at the 3rd instar larval and early pupal developmental stages. The UAS/GAL4 dual genetic system was employed to express halorhodopsin (eNpHR2.0) and red-shifted channelrhodopsin (ReaChR), specifically in the fly heart. Details on preparing D. melanogaster for live OCT imaging and optogenetic pacing are provided. A lab-developed integration software processed the imaging data to create visual presentations and quantitative characteristics of Drosophila heart function. The results demonstrate the feasibility of initiating cardiac arrest and bradycardia caused by eNpHR2.0 activation and performing heart pacing upon ReaChR activation.
Figures
Similar articles
-
Dual color optogenetic tool enables heart arrest, bradycardic, and tachycardic pacing in Drosophila melanogaster.Commun Biol. 2024 Aug 27;7(1):1056. doi: 10.1038/s42003-024-06703-7. Commun Biol. 2024. PMID: 39191986 Free PMC article.
-
Non-invasive red-light optogenetic control of Drosophila cardiac function.Commun Biol. 2020 Jun 29;3(1):336. doi: 10.1038/s42003-020-1065-3. Commun Biol. 2020. PMID: 32601302 Free PMC article.
-
Optogenetic pacing in Drosophila melanogaster.Sci Adv. 2015 Oct 9;1(9):e1500639. doi: 10.1126/sciadv.1500639. eCollection 2015 Oct. Sci Adv. 2015. PMID: 26601299 Free PMC article.
-
Optogenetics in Drosophila.Adv Exp Med Biol. 2021;1293:309-320. doi: 10.1007/978-981-15-8763-4_19. Adv Exp Med Biol. 2021. PMID: 33398822 Review.
-
Feasibility of Using Adjunctive Optogenetic Technologies in Cardiomyocyte Phenotyping - from the Single Cell to the Whole Heart.Curr Pharm Biotechnol. 2020;21(9):752-764. doi: 10.2174/1389201020666190405182251. Curr Pharm Biotechnol. 2020. PMID: 30961485 Free PMC article. Review.
Cited by
-
Dual color optogenetic tool enables heart arrest, bradycardic, and tachycardic pacing in Drosophila melanogaster.Commun Biol. 2024 Aug 27;7(1):1056. doi: 10.1038/s42003-024-06703-7. Commun Biol. 2024. PMID: 39191986 Free PMC article.
-
A Drosophila heart optical coherence microscopy dataset for automatic video segmentation.Sci Data. 2023 Dec 9;10(1):886. doi: 10.1038/s41597-023-02802-y. Sci Data. 2023. PMID: 38071220 Free PMC article.
-
A Simple and Fast Optical Clearing Method for Whole-Mount Fluorescence In Situ Hybridization (FISH) Imaging.J Biophotonics. 2024 Oct 10:e202400258. doi: 10.1002/jbio.202400258. Online ahead of print. J Biophotonics. 2024. PMID: 39389582
-
Attention LSTM U-Net model for Drosophila melanogaster heart tube segmentation in optical coherence microscopy images.Biomed Opt Express. 2024 May 6;15(6):3639-3653. doi: 10.1364/BOE.523364. eCollection 2024 Jun 1. Biomed Opt Express. 2024. PMID: 38867790 Free PMC article.
References
Publication types
MeSH terms
Grants and funding
LinkOut - more resources
Full Text Sources
Molecular Biology Databases
Miscellaneous
