. 2022 Sep 28;96(18):e0091022.
doi: 10.1128/jvi.00910-22. Epub 2022 Sep 12.

Reovirus Efficiently Reassorts Genome Segments during Coinfection and Superinfection

Affiliations

Reovirus Efficiently Reassorts Genome Segments during Coinfection and Superinfection

Timothy W Thoner Jr et al. J Virol. .

Abstract

Reassortment, or genome segment exchange, increases diversity among viruses with segmented genomes. Previous studies on the limitations of reassortment have largely focused on parental incompatibilities that restrict generation of viable progeny. However, less is known about whether factors intrinsic to virus replication influence reassortment. Mammalian orthoreovirus (reovirus) encapsidates a segmented, double-stranded RNA (dsRNA) genome, replicates within cytoplasmic factories, and is susceptible to host antiviral responses. We sought to elucidate the influence of infection multiplicity, timing, and compartmentalized replication on reovirus reassortment in the absence of parental incompatibilities. We used an established post-PCR genotyping method to quantify reassortment frequency between wild-type and genetically barcoded type 3 reoviruses. Consistent with published findings, we found that reassortment increased with infection multiplicity until reaching a peak of efficient genome segment exchange during simultaneous coinfection. However, reassortment frequency exhibited a substantial decease with increasing time to superinfection, which strongly correlated with viral transcript abundance. We hypothesized that physical sequestration of viral transcripts within distinct virus factories or superinfection exclusion also could influence reassortment frequency during superinfection. Imaging revealed that transcripts from both wild-type and barcoded viruses frequently co-occupied factories, with superinfection time delays up to 16 h. Additionally, primary infection progressively dampened superinfecting virus transcript levels with greater time delay to superinfection. Thus, in the absence of parental incompatibilities and with short times to superinfection, reovirus reassortment proceeds efficiently and is largely unaffected by compartmentalization of replication and superinfection exclusion. However, reassortment may be limited by superinfection exclusion with greater time delays to superinfection. IMPORTANCE Reassortment, or genome segment exchange between viruses, can generate novel virus genotypes and pandemic virus strains. For viruses to reassort their genome segments, they must replicate within the same physical space by coinfecting the same host cell. Even after entry into the host cell, many viruses with segmented genomes synthesize new virus transcripts and assemble and package their genomes within cytoplasmic replication compartments. Additionally, some viruses can interfere with subsequent infection of the same host or cell. However, spatial and temporal influences on reassortment are only beginning to be explored. We found that infection multiplicity and transcript abundance are important drivers of reassortment during coinfection and superinfection, respectively, for reovirus, which has a segmented, double-stranded RNA genome. We also provide evidence that compartmentalization of transcription and packaging is unlikely to influence reassortment, but the length of time between primary and subsequent reovirus infection can alter reassortment frequency.

Keywords: coinfection; double-stranded RNA virus; reassortment; reovirus; superinfection; superinfection exclusion.


Conflict of interest statement

The authors declare no conflict of interest.

Figures
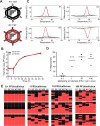
FIG 1
FIG 1
Reovirus reassortment is frequent during high-multiplicity coinfection. (A) Schematic representation of reovirus virions, genome segments, and barcoding strategy. Black bars represent genome segments, with red representing barcodes, or regions into which a series of silent, single-nucleotide substitutions were introduced. (B) L cells were adsorbed with WT or BC reovirus at a multiplicity of 0.1 PFU per cell and incubated for the indicated times prior to cell lysis. Virus titer in cell lysates was determined by plaque assay. n = 3 pairs of plaque-purified clones from each of two independent experiments. (C) Representative HRM difference plots indicating fluorescence relative to a WT control over a range of temperatures for indicated genome segments. n = 4 WT or BC clones analyzed in triplicate. Black lines indicate WT genome segment. Red lines indicate BC genome segment. (D) L cells were coinfected with WT and BC reoviruses at an MOI of 0.1, 1, 10, or 100 PFU per cell per virus before quantification of reassortment frequency using HRM. (E) Honeycomb plots indicate genotypes of individual coinfection progeny viruses analyzed from the experiment in panel D. Each row represents an independently isolated clone. Each column represents the indicated genome segment. Black indicates WT genome segments, and red indicates BC genome segments. n = 3 independent experiments with at least 10 progeny analyzed per experiment.
FIG 2
FIG 2
RNA abundance increases in concert with coinfection multiplicity. L cells were adsorbed with the indicated viruses at MOI = 10 PFU per cell per virus. RNA was extracted, cDNA was generated, and WT S4-specific primers (A) or BC S4-specific primers (B) were used to amplify cDNA. CT values are shown for each infection condition. (C) L cells were coinfected at indicated multiplicities with WT and BC reoviruses for 24 h before quantification of the concentration of WT and BC S4 RNA by RT-qPCR and normalization based on an MOI of 100 WT and BC RNA concentration. n = 3 pairs of independently plaque-purified clones (D and E) Simple linear regression analyses correlating the concentration of WT S4 RNA, BC S4 RNA (D), or the ratio of BC S4 RNA to WT S4 RNA (E) to reassortment frequency over a range of coinfection multiplicities.
FIG 3
FIG 3
Reassortment frequency decreases with greater time delay to superinfection. (A) Schematic depicting the timing of coinfection and superinfection of L cells for superinfection time course. (B) L cells were adsorbed with the WT prior to adsorption with BC virus at the indicated time post-primary adsorption at an MOI of 10 PFU per cell per virus. At 24 h-post primary infection, reassortment frequency was quantified using HRM. (C) Honeycomb plots indicate genotypes of individual coinfection progeny viruses analyzed from the experiment in panel B. Each row represents an independently isolated clone. Each column represents the indicated genome segment. Black indicates WT genome segments, and red indicates BC genome segments. n = 3 independent experiments with at least 10 progeny clones analyzed per experiment.
FIG 4
FIG 4
Superinfecting virus RNA abundance decreases with greater time to superinfection and correlates with reassortment frequency. (A) L cells were adsorbed with the WT prior to adsorption with BC at the indicated time at an MOI of 10 PFU per cell per virus. At 24 h p.i., WT and BC S4 RNAs were quantified by RT-qPCR. (B) Simple linear regression analyses were used to correlate the concentration of WT S4 RNA or BC S4 RNA and (C) the ratio of BC to WT RNA to reassortment frequency at each superinfection time point. n = 3 pairs of plaque-purified clones from two independent experiments.
FIG 5
FIG 5
Branched-DNA FISH enables specific detection of WT and BC +RNA during coinfection. L cells were adsorbed with medium (mock), WT virus only, BC virus only, or both WT and BC viruses at a multiplicity of 10 PFU per cell per virus. Cells were fixed, stained for nuclei (blue), WT +RNA (green), and BC +RNA (red) using bDNA FISH probes, and visualized and quantified using an ImageXpress Micro high-content imaging system. Representative images are shown in panel A. The percentage of total cells infected with the WT (B) or BC (C) reovirus for each infection condition are indicated. n = 9 fields of view from one representative experiment. (D) L cells were adsorbed with the indicated MOI of WT reovirus and fixed and processed for imaging with the ImageXpress either using traditional immunostaining or branched-DNA FISH workflow. The average percentage of total infected cells from four fields of view is shown. n = 3 plaque-purified clones. (E) L cells were coinfected at the indicated MOI with WT and BC reoviruses for 24 h and then fixed and processed for imaging with the ImageXpress using bDNA FISH workflow. The average percentages of uninfected, singly infected, and coinfected cells from four fields of view per clone are shown. n = 3 plaque-purified clones.
FIG 6
FIG 6
VFs do not exclude superinfecting virus +RNA. (A to C) L cells were coinfected with WT and BC reoviruses simultaneously (A) or were infected at 0 h with BC virus and superinfected with the WT 8 h (B) or 16 h (C) post-primary infection. Cells were fixed and stained using bDNA FISH probes specific for S3, S4, and L1 +RNA of primary infecting BC virus (red) and superinfecting WT virus (green) and with antibodies against viral nonstructural protein σNS (gray) to define VFs. Cells were imaged using an LSM880 confocal microscope. The scale bar is 10 μm. (D to H) In 30 cells per condition, cells were segmented, and individual VFs were identified by thresholding based on σNS staining. WT and BC +RNAs within all VFs and the cytoplasm were quantified using Fiji. The percentage of VFs that contain WT +RNA (D) or both WT and BC +RNAs (E) is shown. The ratio of VFs that contain WT +RNA to those that contain both WT and BC +RNA is depicted in panel F. The proportion of total fluorescence intensity from WT +RNA probes (G) and BC +RNA probes (H) that is localized to VFs at each superinfection time point is shown. (I to K) The average area of VFs positive for WT +RNA (I), BC +RNA (J), or both WT and BC +RNAs (K) at the 0-h, 8-h, and 16-h superinfection time points is indicated. Significance was determined by one-way ANOVA with Tukey’s multiple-comparison test. n = 30 cells per time point. *, P < 0.05; **, P < 0.01; ***, P < 0.001.
FIG 7
FIG 7
Superinfection is only inhibited by T3DI reovirus with a 24-h superinfection. (A) L cells were adsorbed with medium (mock) or BC reovirus prior to adsorption with WT at the indicated time points. The superinfecting WT virus RNA concentration was quantified 24 h post-primary infection by RT-qPCR. n = 3 plaque-purified clones from each of two independent experiments. (B) L cells were adsorbed with medium (mock) or BC and incubated for 24 h prior to adsorption with WT. The superinfecting WT virus RNA concentration was quantified 48 h post-primary infection by RT-qPCR. n = 3 plaque-purified clones from each of two independent experiments. (C) L cells were adsorbed with medium (mock) or BC reovirus prior to adsorption with WT at the indicated time points. The superinfecting WT virus RNA concentration was quantified 24 h post-secondary infection by RT-qPCR. n = 3 plaque-purified clones from each of two independent experiments. Statistical significance was determined by two-way ANOVA with Sidak’s multiple-comparison test (A and C) or unpaired t test (B). *, P < 0.05; ***, P < 0.001.

Similar articles

Cited by

References

    1. Smith GJD, Vijaykrishna D, Bahl J, Lycett SJ, Worobey M, Pybus OG, Ma SK, Cheung CL, Raghwani J, Bhatt S, Peiris JSM, Guan Y, Rambaut A. 2009. Origins and evolutionary genomics of the 2009 swine-origin H1N1 influenza A epidemic. Nature 459:1122–1125. 10.1038/nature08182. - DOI - PubMed
    1. Kawaoka Y, Krauss S, Webster RG. 1989. Avian-to-human transmission of the PB1 gene of influenza A viruses in the 1957 and 1968 pandemics. J Virol 63:4603–4608. 10.1128/JVI.63.11.4603-4608.1989. - DOI - PMC - PubMed
    1. Doro R, Farkas SL, Martella V, Banyai K. 2015. Zoonotic transmission of rotavirus: surveillance and control. Expert Rev Anti Infect Ther 13:1337–1350. 10.1586/14787210.2015.1089171. - DOI - PubMed
    1. Yang JR, Lin YC, Huang YP, Su CH, Lo J, Ho YL, Yao CY, Hsu LC, Wu HS, Liu MT. 2011. Reassortment and mutations associated with emergence and spread of oseltamivir-resistant seasonal influenza A/H1N1 viruses in 2005–2009. PLoS One 6:e18177. 10.1371/journal.pone.0018177. - DOI - PMC - PubMed
    1. Simonsen L, Viboud C, Grenfell BT, Dushoff J, Jennings L, Smit M, Macken C, Hata M, Gog J, Miller MA, Holmes EC. 2007. The genesis and spread of reassortment human influenza A/H3N2 viruses conferring adamantane resistance. Mol Biol Evol 24:1811–1820. 10.1093/molbev/msm103. - DOI - PubMed

Publication types

Substances

LinkOut - more resources