. 2022 Sep 28;96(18):e0101122.
doi: 10.1128/jvi.01011-22. Epub 2022 Sep 12.

HIV-1 Preintegration Complex Preferentially Integrates the Viral DNA into Nucleosomes Containing Trimethylated Histone 3-Lysine 36 Modification and Flanking Linker DNA

Affiliations

HIV-1 Preintegration Complex Preferentially Integrates the Viral DNA into Nucleosomes Containing Trimethylated Histone 3-Lysine 36 Modification and Flanking Linker DNA

Nicklas Sapp et al. J Virol. .

Abstract

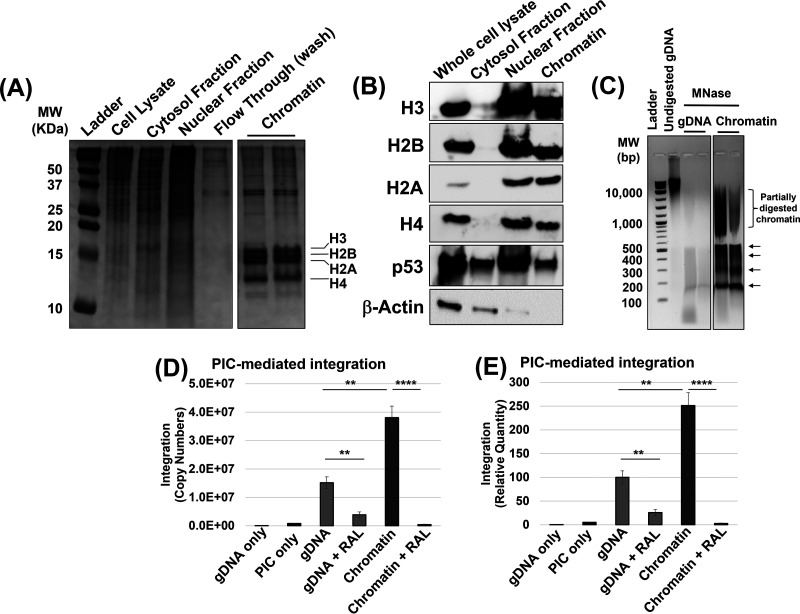
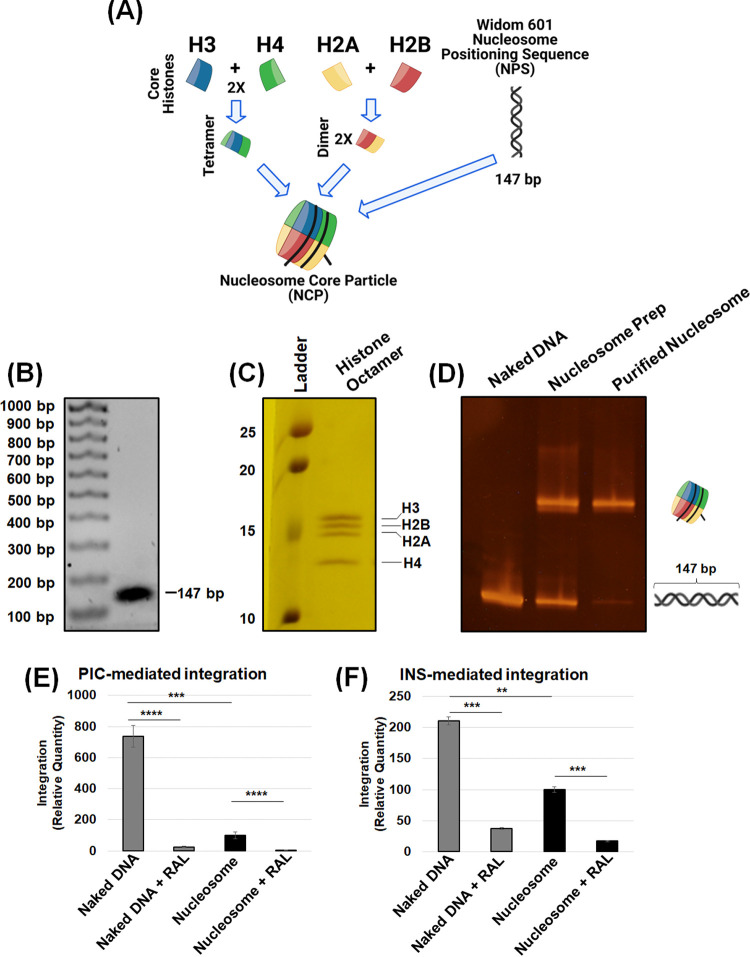
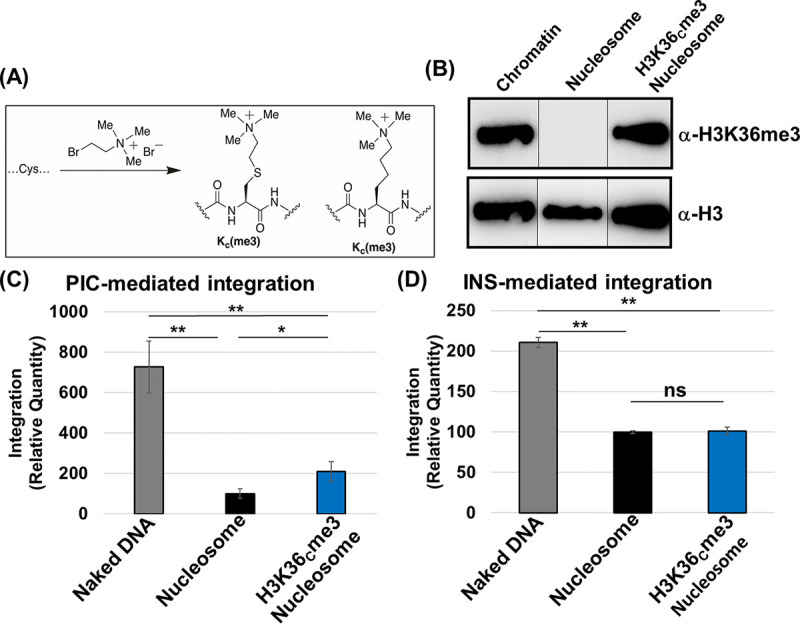
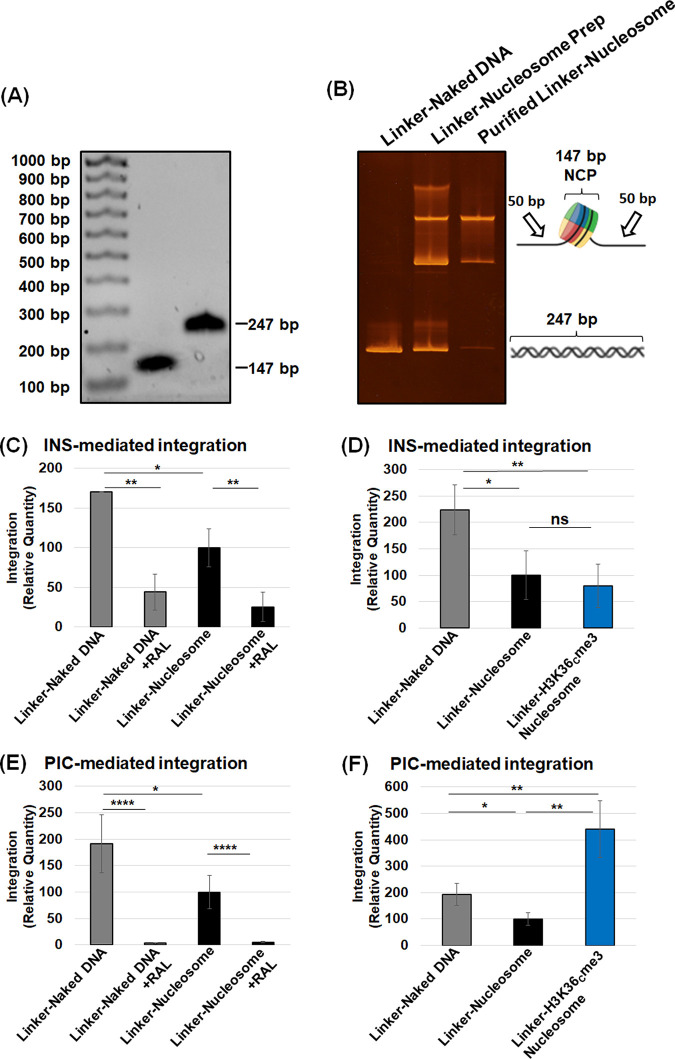
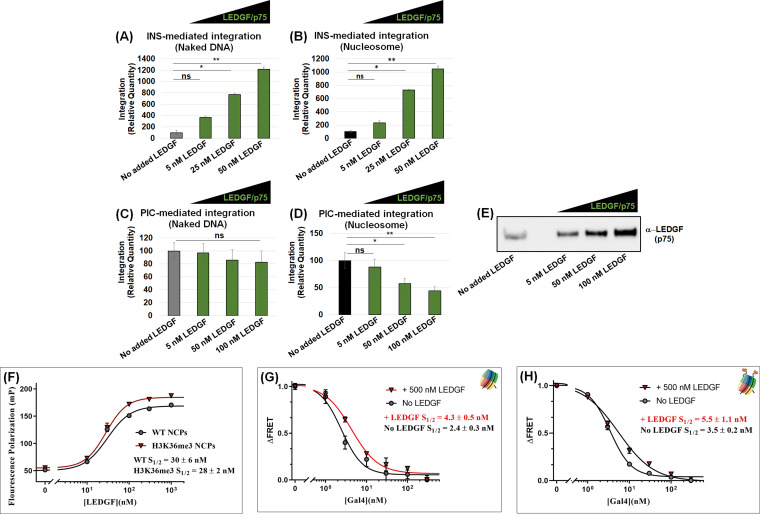
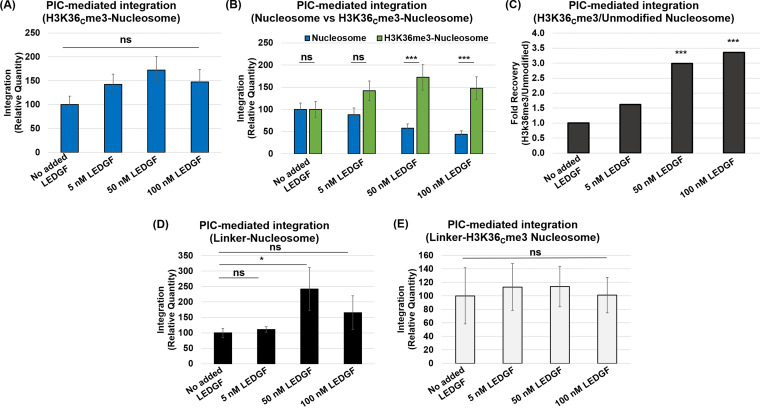
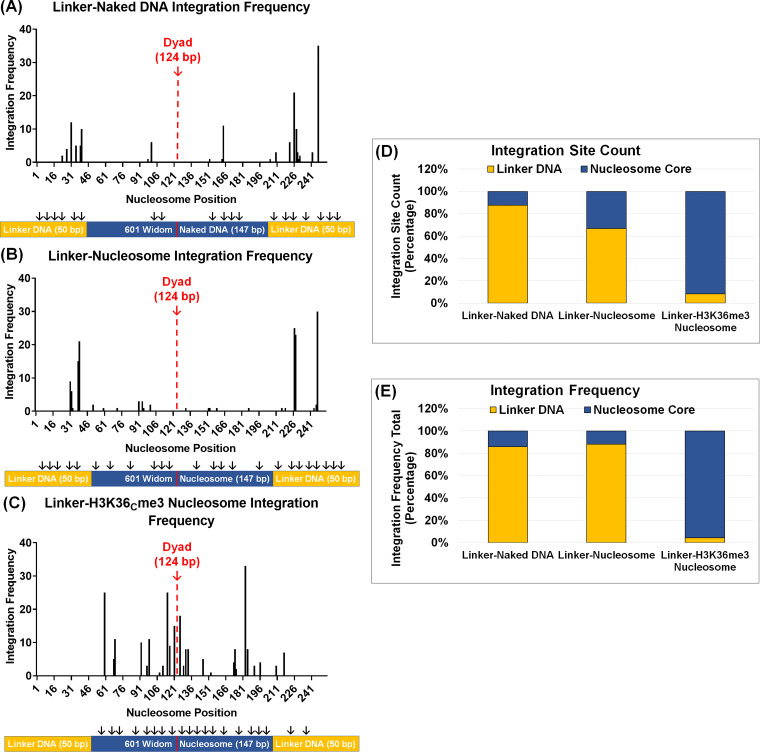
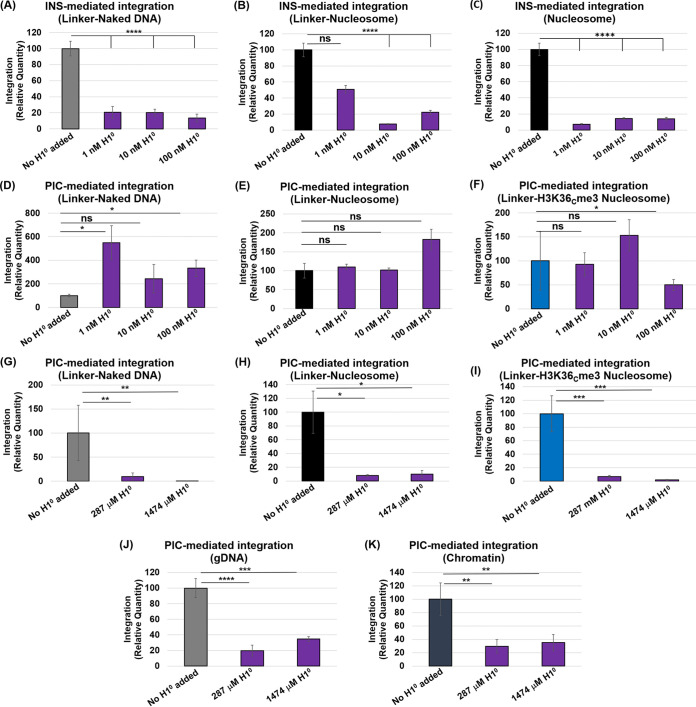
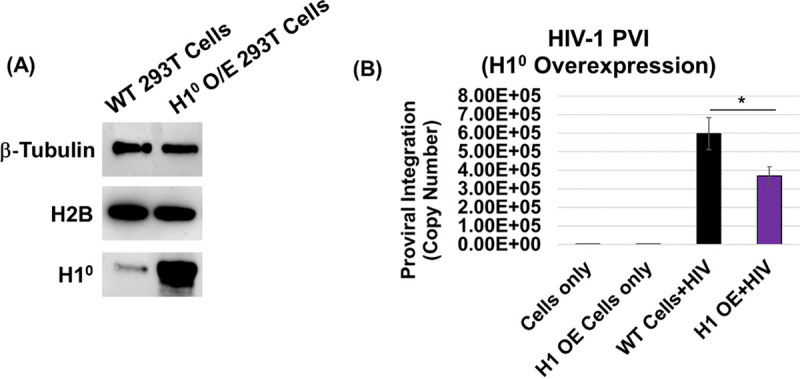
HIV-1 DNA is preferentially integrated into chromosomal hot spots by the preintegration complex (PIC). To understand the mechanism, we measured the DNA integration activity of PICs-extracted from infected cells-and intasomes, biochemically assembled PIC substructures using a number of relevant target substrates. We observed that PIC-mediated integration into human chromatin is preferred compared to genomic DNA. Surprisingly, nucleosomes lacking histone modifications were not preferred integration compared to the analogous naked DNA. Nucleosomes containing the trimethylated histone 3 lysine 36 (H3K36me3), an epigenetic mark linked to active transcription, significantly stimulated integration, but the levels remained lower than the naked DNA. Notably, H3K36me3-modified nucleosomes with linker DNA optimally supported integration mediated by the PIC but not by the intasome. Interestingly, optimal intasome-mediated integration required the cellular cofactor LEDGF. Unexpectedly, LEDGF minimally affected PIC-mediated integration into naked DNA but blocked integration into nucleosomes. The block for the PIC-mediated integration was significantly relieved by H3K36me3 modification. Mapping the integration sites in the preferred substrates revealed that specific features of the nucleosome-bound DNA are preferred for integration, whereas integration into naked DNA was random. Finally, biochemical and genetic studies demonstrate that DNA condensation by the H1 protein dramatically reduces integration, providing further evidence that features inherent to the open chromatin are preferred for HIV-1 integration. Collectively, these results identify the optimal target substrate for HIV-1 integration, report a mechanistic link between H3K36me3 and integration preference, and importantly, reveal distinct mechanisms utilized by the PIC for integration compared to the intasomes. IMPORTANCE HIV-1 infection is dependent on integration of the viral DNA into the host chromosomes. The preintegration complex (PIC) containing the viral DNA, the virally encoded integrase (IN) enzyme, and other viral/host factors carries out HIV-1 integration. HIV-1 integration is not dependent on the target DNA sequence, and yet the viral DNA is selectively inserted into specific "hot spots" of human chromosomes. A growing body of literature indicates that structural features of the human chromatin are important for integration targeting. However, the mechanisms that guide the PIC and enable insertion of the PIC-associated viral DNA into specific hot spots of the human chromosomes are not fully understood. In this study, we describe a biochemical mechanism for the preference of the HIV-1 DNA integration into open chromatin. Furthermore, our study defines a direct role for the histone epigenetic mark H3K36me3 in HIV-1 integration preference and identify an optimal substrate for HIV-1 PIC-mediated viral DNA integration.

Keywords: H3K36me3; HIV; PIC; PTM; chromatin; histone; human immunodeficiency virus; intasome; integration; nucleosome; posttranslational modification; preintegration complex.


Conflict of interest statement

The authors declare no conflict of interest.

Figures

FIG 1
FIG 1
Chromatin is the preferred substrate for HIV-1 PIC-mediated integration. Chromatin was isolated from HEK293T cells and assessed for the histone proteins and DNA. (A) Fractions from various steps of the chromatin preparation were analyzed by using a 15% acrylamide gel and visualized by Coomassie staining. The chromatin fraction containing the canonical histone proteins H2A, H2B, H3, and H4 is shown. (B) The histone proteins were detected by Western blotting in the whole-cell lysate, the cytosol fraction, the nuclear fraction, and chromatin (left panel). In addition, cytoplasmic and nuclear proteins were probed in each fraction (right panel). (C) Protection of the chromatin DNA within nucleosomes was assessed by partial micrococcal nuclease (MNase) digestion. The arrows to the right of the gel indicate discrete DNA bands of nucleosome-mediated protection. (D) PIC-mediated integration was measured by nested-PCR and represented as the copy numbers of integrated viral DNA, using 300 ng of chromatin and deproteinated genomic DNA (gDNA) as targets. As a negative control, 1 μM RAL (the integrase strand transfer inhibitor) was used. (E) The copies of HIV-1 DNA integration were plotted relative to the integration into gDNA. The results in panel E are shown as means of the viral DNA copy numbers of at least three replicates, with the error bars indicating the standard errors of the mean (SEM). *, P < 0.05; **, P = 0.01 to 0.05; ***, P = 0.01 to 0.001; ****, P = 0.001 to 0.0001; *****, P < 0.0001.
FIG 2
FIG 2
The nucleosome is a barrier to HIV-1 integration. (A) Schematic of the biochemical assembly of nucleosomes. The nucleosomes are assembled with the Widom 601 nucleosome positioning sequence and a recombinant human histone octamer. The histone octamer was assembled first by an equimolar addition of histone protein dimers H2A and H2B with the H3/H4 tetramer. (B) The 147-bp NPS (naked DNA) DNA used for nucleosome assembly was analyzed on a 1.5% agarose gel and visualized by ethidium bromide staining. (C) SDS-PAGE and Coomassie staining visualized the presence of individual histone proteins in the octameric histone assembly. (D) The biochemical assembly of the nucleosome was analyzed by an EMSA. (E) PIC-mediated integration was assessed using 300 ng of the 147-bp naked DNA and the analogous nucleosome as targets, with RAL serving as a specific inhibitor for HIV-1 integration. (F) Intasome (INS)-mediated integration was measured using qPCR, with the naked DNA and the nucleosome serving as targets. The data are represented as the relative quantity of viral DNA integration in reference to the naked DNA, and error bars were generated from the SEM of at least three independent experiments. *, P < 0.05; **, P = 0.01 to 0.05; ***, P = 0.01 to 0.001; ****, P = 0.001 to 0.0001.
FIG 3
FIG 3
Nucleosomes containing trimethylated histone 3 at lysine 36 enhanced PIC-mediated integration. (A) Schematic illustrating the insertion of the H3K36me3 mimetic by site-directed mutagenesis of the H3 K36 to cysteine (K36C). The K36C H3 undergoes alkylation to functionalize the K36C to create a biochemical mimic of the histone 3 trimethylation (H3KC36me3). (B) Western blot analysis of the H3K36me3 and histone H3 in the H3K36Cme3 nucleosome compared to the unmodified nucleosome and the isolated chromatin. (C) PIC-mediated integration with the naked DNA, nucleosome, and H3K36Cme3 nucleosome. The data were analyzed with reference to the naked DNA. (D) The INS-mediated integration was then assessed by comparing the naked DNA, nucleosome, and H3K36Cme3 nucleosome. The error bars were determined by the SEM of at least three independent replicates. *, P < 0.05; **, P = 0.01 to 0.05.
FIG 4
FIG 4
The nucleosome containing linker DNA and the H3K36Cme3 is an optimal substrate for PIC-mediated integration. The nucleosome containing 50 bp of linker DNA flanking the Widom 601 NPS (linker-naked DNA) was assembled, resulting in a nucleosome with a linker substrate that is 247 bp. (A) The 147- and 247-bp nucleosome positioning sequence DNA was analyzed on a 1.5% agarose gel and visualized by ethidium bromide staining. (B) The biochemical assembly of nucleosomes with the 247-bp DNA was analyzed by EMSA. (C) The relative quantity of INS-mediated integration was measured with the linker-naked DNA, compared to the linker-nucleosomal DNA. The integrase inhibitor, RAL, was included as a control for integration. (D) The linker-naked DNA, linker-nucleosome, and linker-H3K36Cme3 were compared for INS-mediated integration relative to the linker-naked DNA. (E) PIC-mediated integration was assessed with the linker-naked DNA and linker-nucleosome. (F) PIC-mediated integration was measured by comparing the linker-naked DNA, linker-nucleosomes, and linker-H3K36Cme3. All the results are shown as the relative integration quantity and represent the means of at least three independent experiments. Error bars represent the SEM (*, P < 0.05; **, P = 0.01 to 0.05; ****, P = 0.001 to 0.0001).
FIG 5
FIG 5
LEDGF/p75 addition stimulated INS-mediated integration but reduced PIC-mediated integration with nucleosomes. (A and B) INS-mediated integration (25 nM) was measured in the presence of the integration cofactor LEDGF/p75. LEDGF/p75 was added to the indicated reaction mixtures at 5, 10, and 25 nM to both the naked DNA and the nucleosome substrate. (C and D) PIC-mediated integration was measured in the presence of LEDGF/p75 addition with both the naked DNA and the nucleosome substrate. (E) Western blot analysis for LEDGF/p75 in the isolated PIC preparation and in PICs supplemented with the recombinant LEDGF/p75 protein. (F) A fluorescence polarization assay was performed with fluorescein-labeled nucleosome core particle (NCP) to determine the LEDGF/p75 binding kinetics (S1/2) to the nucleosomes. (G and H) The ensemble FRET measurements were detected by Cy3-Cy5 NCP (Cy3 at the end of the NPS and Cy5 at the H2A K119C) and with titrations of GAL4 in the presence of LEDGF/p75 at saturating amounts of the unmodified NCP and H3K36Cme3-NCP. The error bars represent the SEM of at least three independent experiments. *, P < 0.05; **, P = 0.01 to 0.05.
FIG 6
FIG 6
The H3K36Cme3 nucleosome and linker DNA supported PIC-mediated integration in the presence of LEDGF/p75. (A) PIC-mediated integration was measured using H3K36me3-nucleosomes as targets in the presence of LEDGF/p75 (5, 50, and 100 nM). Integration data are presented relative to the PIC reactions without added LEDGF/p75. (B) Comparative analysis of the relative PIC-mediated integration with the unmodified nucleosome to the H3K36Cme3-nucleosome in the presence of LEDGF/p75. (C) The fold change was calculated between the unmodified nucleosome and the H3K36me3-modified nucleosome effects on PIC-mediated integration in the presence of LEDGF/p75. (D) PIC-mediated integration was measured with LEDGF/p75 supplementation to the unmodified nucleosomes containing linker DNA. (E) PIC-mediated integration with the H3K36Cme3 nucleosome containing linker DNA in the presence of LEDGF/p75 is plotted relative to the assay without LEDGF/p75 supplementation. The error bars represent the SEM of at least three independent experiments. *, P < 0.05; ***, P = 0.01 to 0.001.
FIG 7
FIG 7
HIV-1 DNA integration is preferentially directed into the core of the H3K36Cme3 containing nucleosomes. To study HIV-1 integration preference, the DNA from the integration reactions was PCR amplified and subjected to next-generation sequencing. The integration frequency within the linker substrates was determined by quantifying the integration junctions. The integration frequency is plotted as a histogram for the naked DNA with a linker (A), the nucleosome with the linker (B), and H3K36Cme3 with linker substrates (C). (D) After the integration sites within the linker containing DNA substrates were quantified, the percentages of sites within the linker sequences and nucleosome core sequence were plotted for comparative analysis. (E) The frequency of integration junctions at a particular site within the sequence was then determined. The integration frequency in the linker sequences and the nucleosome core sequence was quantified as a percentage of the total integration sites.
FIG 8
FIG 8
H1° reduces HIV-1 DNA integration. To probe the effects of H1 on HIV-1 integration, INS-mediated integration [25 nM] was first tested with the linker-naked DNA (A), the linker-nucleosome (B), or the non-linker-nucleosome (147 bp) (C) preincubated with recombinant H1° (1, 10, or 100 nM). The results are the average relative quantities with reference to the assay lacking H1° addition. The PIC-mediated integration was then measured with linker-naked DNA (D), linker-nucleosome (E), and linker-H3K36Cme3 nucleosome (F) that were preincubated with 1, 10, or 100 nM H1°. (G to I) Next, either 287 or 1,474 mM H1° was added to the PIC-mediated integration measurements with the linker-naked DNA, the linker-nucleosome, and the linker-H3K36Cme3 nucleosome substrates. The mM concentrations of H1° reflect amounts that show, respectively, 1:1 and 1:5 (wt/wt) stoichiometry of the substrate concentrations. The data shown are the relative quantities of the PIC integration relative to the assay lacking H1° addition. PIC-mediated integration was measured with gDNA (J) and chromatin (K) that were incubated on ice with 287 and 1,474 mM H1°. All data represent the means of at least three independent experiments, with the error bars representing the SEM (*, P < 0.05; **, P = 0.01 to 0.05; ***, P = 0.01 to 0.001; ****, P = 0.001 to 0.0001).
FIG 9
FIG 9
Histone H1 expression negatively regulates HIV-1 integration. (A) Linker histone H1° was overexpressed in HEK293T cells, H1° protein was probed by Western blot analysis, and the same blot was reprobed for β-tubulin and histone protein H2B as loading controls. (B) Proviral integration in the HEK293T cells overexpressing H1°. Cells were transfected with the pEV833 (GFP) expression construct for H1° and then inoculated with VSVg-dEnv-HIV-1 (GFP) particles. At 24 h postinoculation, HIV-1 proviral DNA integration (PVI) was quantified by nested Alu-PCR. All data represent at least three independent experiments, and the error bars represent the SEM (*, P < 0.05).

Similar articles

Cited by

References

    1. Chawla A, Wang C, Patton C, Murray M, Punekar Y, de Ruiter A, Steinhart C. 2018. A review of long-term toxicity of antiretroviral treatment regimens and implications for an aging population. Infect Dis Ther 7:183–195. 10.1007/s40121-018-0201-6. - DOI - PMC - PubMed
    1. Wilen CB, Tilton JC, Doms RW. 2012. HIV: cell binding and entry. Cold Spring Harb Perspect Med 2:a006866. 10.1101/cshperspect.a006866. - DOI - PMC - PubMed
    1. Wyatt R, Sodroski J. 1998. The HIV-1 envelope glycoproteins: fusogens, antigens, and immunogens. Science 280:1884–1888. 10.1126/science.280.5371.1884. - DOI - PubMed
    1. Campbell EM, Hope TJ. 2015. HIV-1 capsid: the multifaceted key player in HIV-1 infection. Nat Rev Microbiol 13:471–483. 10.1038/nrmicro3503. - DOI - PMC - PubMed
    1. Fassati A. 2012. Multiple roles of the capsid protein in the early steps of HIV-1 infection. Virus Res 170:15–24. 10.1016/j.virusres.2012.09.012. - DOI - PubMed

Publication types

LinkOut - more resources