Systematic comparison of ranking aggregation methods for gene lists in experimental results
- PMID: 36094347
- PMCID: PMC9620830
- DOI: 10.1093/bioinformatics/btac621
Systematic comparison of ranking aggregation methods for gene lists in experimental results
Abstract
Motivation: A common experimental output in biomedical science is a list of genes implicated in a given biological process or disease. The gene lists resulting from a group of studies answering the same, or similar, questions can be combined by ranking aggregation methods to find a consensus or a more reliable answer. Evaluating a ranking aggregation method on a specific type of data before using it is required to support the reliability since the property of a dataset can influence the performance of an algorithm. Such evaluation on gene lists is usually based on a simulated database because of the lack of a known truth for real data. However, simulated datasets tend to be too small compared to experimental data and neglect key features, including heterogeneity of quality, relevance and the inclusion of unranked lists.
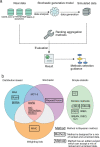
Results: In this study, a group of existing methods and their variations that are suitable for meta-analysis of gene lists are compared using simulated and real data. Simulated data were used to explore the performance of the aggregation methods as a function of emulating the common scenarios of real genomic data, with various heterogeneity of quality, noise level and a mix of unranked and ranked data using 20 000 possible entities. In addition to the evaluation with simulated data, a comparison using real genomic data on the SARS-CoV-2 virus, cancer (non-small cell lung cancer) and bacteria (macrophage apoptosis) was performed. We summarize the results of our evaluation in a simple flowchart to select a ranking aggregation method, and in an automated implementation using the meta-analysis by information content algorithm to infer heterogeneity of data quality across input datasets.
Availability and implementation: The code for simulated data generation and running edited version of algorithms: https://github.com/baillielab/comparison_of_RA_methods. Code to perform an optimal selection of methods based on the results of this review, using the MAIC algorithm to infer the characteristics of an input dataset, can be downloaded here: https://github.com/baillielab/maic. An online service for running MAIC: https://baillielab.net/maic.
Supplementary information: Supplementary data are available at Bioinformatics online.
© The Author(s) 2022. Published by Oxford University Press.
Figures


References
-
- Abebe M. et al.; VACSEL Study Group. (2010) Expression of apoptosis-related genes in an Ethiopian cohort study correlates with tuberculosis clinical status. Eur. J. Immunol., 40, 291–301. - PubMed
-
- Ailon N. (2010) Aggregation of partial rankings, p-ratings and top-m lists. Algorithmica, 57, 284–300.
Publication types
MeSH terms
Grants and funding
- MR/N02995X/1/MRC_/Medical Research Council/United Kingdom
- MC_PC_20004/MRC_/Medical Research Council/United Kingdom
- BB/P013759/1/BB_/Biotechnology and Biological Sciences Research Council/United Kingdom
- MC_PC_19025/MRC_/Medical Research Council/United Kingdom
- BB/P013732/1/BB_/Biotechnology and Biological Sciences Research Council/United Kingdom
LinkOut - more resources
Full Text Sources
Medical
Miscellaneous

