. 2022 Oct 3;219(10):e20220094.
doi: 10.1084/jem.20220094. Epub 2022 Sep 12.

Impaired IL-23-dependent induction of IFN-γ underlies mycobacterial disease in patients with inherited TYK2 deficiency

Masato Ogishi #  1 Andrés Augusto Arias #  1   2   3 Rui Yang #  1 Ji Eun Han #  1 Peng Zhang  1 Darawan Rinchai  1 Joshua Halpern  1 Jeanette Mulwa  1 Narelle Keating  1   4 Maya Chrabieh  5   6 Candice Lainé  5   6 Yoann Seeleuthner  5   6 Noé Ramírez-Alejo  1 Nioosha Nekooie-Marnany  7 Andrea Guennoun  8 Ingrid Muller-Fleckenstein  9 Bernhard Fleckenstein  9 Sara S Kilic  10 Yoshiyuki Minegishi  11 Stephan Ehl  12 Petra Kaiser-Labusch  13 Yasemin Kendir-Demirkol  14 Flore Rozenberg  15 Abderrahmane Errami  16 Shen-Ying Zhang  1   5   6 Qian Zhang  1   5   6 Jonathan Bohlen  5   6 Quentin Philippot  5   6 Anne Puel  1   5   6 Emmanuelle Jouanguy  1   5   6 Zahra Pourmoghaddas #  17 Shahrzad Bakhtiar #  18 Andre M Willasch #  18 Gerd Horneff #  19   20 Genevieve Llanora #  21 Lynette P Shek #  21   22 Louis Y A Chai #  23   24   25 Sen Hee Tay #  25   26 Hamid H Rahimi #  27 Seyed Alireza Mahdaviani #  28 Serdar Nepesov #  29 Aziz A Bousfiha #  30 Emine Hafize Erdeniz #  31 Adem Karbuz #  32 Nico Marr #  8 Carmen Navarrete #  33 Mehdi Adeli #  34 Lennart Hammarstrom #  35   36   37 Hassan Abolhassani #  35   37 Nima Parvaneh #  37 Saleh Al Muhsen #  38 Mohammed F Alosaimi #  38 Fahad Alsohime #  39   40 Maryam Nourizadeh #  41   42 Mostafa Moin #  41   42 Rand Arnaout #  43   44 Saad Alshareef #  43 Jamila El-Baghdadi #  45 Ferah Genel #  46 Roya Sherkat #  7 Ayça Kiykim #  47 Esra Yücel #  48 Sevgi Keles #  49 Jacinta Bustamante #  1   5   50 Laurent Abel #  1   5   6 Jean-Laurent Casanova #  1   5   6   51   52 Stéphanie Boisson-Dupuis #  1   5   6
Affiliations

Impaired IL-23-dependent induction of IFN-γ underlies mycobacterial disease in patients with inherited TYK2 deficiency

Masato Ogishi et al. J Exp Med. .

Abstract

Human cells homozygous for rare loss-of-expression (LOE) TYK2 alleles have impaired, but not abolished, cellular responses to IFN-α/β (underlying viral diseases in the patients) and to IL-12 and IL-23 (underlying mycobacterial diseases). Cells homozygous for the common P1104A TYK2 allele have selectively impaired responses to IL-23 (underlying isolated mycobacterial disease). We report three new forms of TYK2 deficiency in six patients from five families homozygous for rare TYK2 alleles (R864C, G996R, G634E, or G1010D) or compound heterozygous for P1104A and a rare allele (A928V). All these missense alleles encode detectable proteins. The R864C and G1010D alleles are hypomorphic and loss-of-function (LOF), respectively, across signaling pathways. By contrast, hypomorphic G996R, G634E, and A928V mutations selectively impair responses to IL-23, like P1104A. Impairment of the IL-23-dependent induction of IFN-γ is the only mechanism of mycobacterial disease common to patients with complete TYK2 deficiency with or without TYK2 expression, partial TYK2 deficiency across signaling pathways, or rare or common partial TYK2 deficiency specific for IL-23 signaling.


Conflict of interest statement

Disclosures: The authors declare no competing financial interests.

Figures
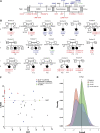
Figure 1.
Figure 1.
Identification of AR TYK2 deficiency and familial segregation. (A) Schematic representation of the TYK2 coding sequence and protein domains. The locations of the mutations identified previously and in this report (bold) are indicated. Red indicates a predicted LOF variant, blue a rare missense variant, and green a common missense variant associated with susceptibility to TB. FERM, 4.1 protein, ezrin, radixin, and moesin. (B) Familial segregation of the mutations. Black indicates disease status. E?, genotype not available. (C) CADD minor allele frequency (MAF) graph displaying the frequency of the variants found in the homozygous state in gnomAD and in our patients relative to their deleteriousness. Already published variants are also shown. (D) Graphical representation of the CoNeS value for TYK2, in comparison with those for autosomal dominant (AD), recessive (AR), or both types of inborn errors of immunity (IEI).
Figure S1.
Figure S1.
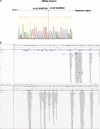
Large deletion in P2. (A) Sanger sequencing of the junction on chromosome 19 of P2. (B) Visualization in IGV of the large deletion in P2 (top) relative to a healthy individual (bottom).
Figure S2.
Figure S2.
Characterization of the mutations of P8 and P9. (A) Schematic representation of the TYK2 cDNA with exons annotated (top), the TYK2 protein with all the mutated residues identified (middle), and a representation of the protein of P8 (bottom left) and the nucleotide sequence found in the cells of the patient (bottom right). (B) Amplification of the TYK2 cDNA from P9, revealing the presence of a single band of the same size as the WT protein, but of lower abundance, probably due to mRNA decay. Source data are available for this figure: SourceData FS2.
Figure 2.
Figure 2.
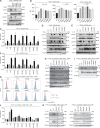
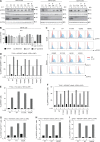
Functional characterization of the mutant TYK2 alleles in overexpression conditions. (A) Western blot analysis of the expression capacity of the TYK2 alleles and of the capacity of the resulting proteins for auto- and trans-phosphorylation in TYK2-deficient HEK293T cells. Where indicated, the cells were transiently transfected with STAT1. The experiment shown is representative of at least two independent experiments performed. (B) IFN-αR1, IL-12Rβ1, and IL-10R2 expression in reconstituted EBV-B cells with the TYK2 alleles indicated, as determined by flow cytometry. *, P < 0.05, two-tailed Student’s t tests. Nonsignificant values are not indicated. Two (IFN-αR1, IL-12Rβ1) and three (IL-10R2) independent experiments were performed. MFI, mean fluorescence intensity. (C and D) Response to IFN-α of transfected TYK2-deficient HEK293T (C) and reconstituted EBV-B cells (D) with the TYK2 alleles indicated, as determined by flow cytometry and Western blotting, respectively. The data shown are representative of at least two independent experiments. *, P < 0.05; **, P < 0.01, two-tailed Student’s t tests between the stimulated condition of the TYK2 WT allele and the other stimulated conditions. Nonsignificant values are not indicated. (E and F) Response to IL-10 of reconstituted EBV-B cells (E) and TYK2-deficient HEK293T cells (F) with the TYK2 alleles indicated, as determined by Western blotting and flow cytometry, respectively. The data shown are representative of at least two independent experiments. *, P < 0.05, two-tailed Student’s t tests between the stimulated condition of the TYK2 WT allele and the other stimulated conditions. Nonsignificant values are not indicated. (G and H) Response to IL-12 of TYK2-deficient U1A cells stably transfected with IL-12Rβ1 and IL-12Rβ2 and with the TYK2 alleles indicated, as determined by flow cytometry (G) and Western blotting (H). The data shown are representative of at least two independent experiments. (I) Phosphorylation of TYK2, as a substrate, in TYK2-deficient U1A cells stably transfected with IL-12Rβ1 and IL-12Rβ2, and transfected with the TYK2 alleles indicated, as determined by Western blotting with a specific anti-phosphoTYK2 antibody after stimulation with IL-12. The data shown are representative of at least two independent experiments. (J and K) Response to IL-23 of TYK2-deficient U1A cells stably transfected with IL-12Rβ1 and IL-23R transfected with the TYK2 alleles indicated, as determined by flow cytometry (J) and Western blotting (K) for pSTAT3 and pSTAT1. The data shown are representative of at least two independent experiments. *, P < 0.05; **, P < 0.01, two-tailed Student’s t tests between the stimulated condition of the TYK2 WT allele and the other stimulated conditions (in black) and between the nonstimulated and stimulated condition (in red). Nonsignificant values are not indicated. MW, molecular weight in kD. Source data are available for this figure: SourceData F2.
Figure 3.
Figure 3.
Functional characterization of the patients’ cell lines. (A) TYK2 levels, assessed by Western blotting of EBV-B cells from the patients. The data shown are representative of at least two independent experiments. (B) Expression of IL-12Rβ1, IFN-αR1, and IL-10R2 in EBV-B cells from the patients indicated, as determined by flow cytometry. pLOF cells comprise cells from P1, P-Jap, P-Tur, P-Ger, P7, P2, and P8. *, P < 0.05; **, P < 0.01, two-tailed Student’s t tests. Nonsignificant values are not indicated. Two to three independent experiments were performed. MFI, mean fluorescence intensity. (C–G) Response to IFN-α (C) IL-10 (D and E), and IL-23 (F and G) of EBV-B cells from the patients, as determined by Western blotting (C, D, and G) and flow cytometry (E and F), assessing STAT phosphorylation. TYK2 levels were determined by Western blotting of the patients’ EBV-B cells. *, P < 0.05; **, P < 0.01, two-tailed Student’s t tests between the stimulated condition of the controls and the other stimulated conditions. Nonsignificant values are not indicated. Data representative of at least two independent experiments are shown. MW, molecular weight in kD. Source data are available for this figure: SourceData F3.
Figure 4.
Figure 4.
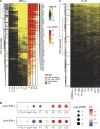
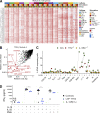
Induction of target genes in the patients’ EBV-B cells. RNA-seq analysis of EBV-B cells stimulated with IFN-α (105 IU/ml) and IL-21 (100 ng/ml) for 2 h. Data normalization using negative binomial distribution (DESeq2 package). Benjamini–Hochberg FDR and log2 fold-change are represented. Each condition was duplicated, and then the mean of gene expression level was used for downstream analysis. (A) Heatmap includes 531 genes with relative fold-change >2 (FDR <0.05) in response to IFN-α treatment relative to NS samples in the control group (C21, C22). ISGs are indicated. (B) Dot plot representing IFN-α and IFN-γ enrichment scores (ES) between patients (P1, P3, and P5) and controls (C21 and C22). ES is represented by a spot of color, with red meaning increased abundance, and blue, decreased abundance. The degree of intensity of the spots denotes the levels of ES. The size of the spot represents FDR. HM, Hallmark gene sets. (C) Visualization of the DEGs between patients (P1, P3, and P5) and controls after IL-21 stimulation.
Figure S3.
Figure S3.
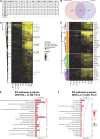
Serological tests on the available serum samples from TYK2-deficient patients and IFN-α–induced genes in EBV B cells from P3 (R864C/R864C). (A) Available serologies of TYK2-deficient patients. (B) Venn diagram of DEGs (IFN-α vs. NS) in controls and P3. (C) Heatmap of gene significantly induced by IFN-α in controls but not in P3 (R864C/R864C). (D) Heatmap of selected gene related to ISG, IFN, and inflammation. (E and F) DEGs between IFN-α vs. nonstimulation (E) and IL-21 vs. nonstimulation (F) samples. Top 20 canonical pathways ranking modulated by treatment identified using IPA analysis according to significance level (log2 fold-change, FDR < 0.05).
Figure 5.
Figure 5.
TYK2-independent signaling pathways. (A and B) Response to IL-6 in EBV-B cells from TYK2-deficient patients, as assessed by Western blotting (A) and flow cytometry (B) with an anti-pSTAT3 antibody. Data representative of at least two independent experiments are shown. *, P < 0.05; two-tailed Student’s t tests between the stimulated condition of the controls and the other stimulated conditions. Nonsignificant values are not indicated. (C and D) Response to IL-29 in TYK2-deficient HEK293T cells transiently transfected with IL-28R and IL-10R2, and the various TYK2 alleles, as assessed by flow cytometry with specific labeled anti-pSTAT1 and anti-pSTAT3 antibodies. Data representative of at least two independent experiments are shown. (E) Diagram of the response to IL-26 in TYK2-deficient U1 cells transiently transfected with IL-10R2 and IL-20R1 and the various TYK2 alleles, as measured by flow cytometry. Data representative of at least two independent experiments are shown. (F) Diagram of the response to IL-22 in TYK2-deficient HEK293T cells transiently transfected with IL-10R2 and IL-22R1, and the various TYK2 alleles, as assessed by flow cytometry. Data representative of at least two independent experiments are shown. (G–I) Diagram of the responses to IL-19 (G) and IL-20 (H and I) in TYK2-deficient HEK293T cells transiently transfected with IL-20R1/IL-20R2, IL-22R1 and IL-20R2, and the various TYK2 alleles, as assessed by flow cytometry. Data representative of at least two independent experiments are shown. MW, molecular weight in kD. Source data are available for this figure: SourceData F5.
Figure S4.
Figure S4.
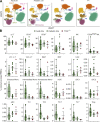
Deep immunophenotyping of patients with complete TYK2 deficiency. (A) UMAP representation of an adult control, a pediatric control, and two TYK2-deficient patients. The various cell subsets visualized are indicated. (B) Identification of the different cell subsets according to their abundance, measured as a percentage of live single PBMCs.
Figure 6.
Figure 6.
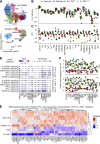
scRNA-seq analysis of patients with complete TYK2 deficiency. (A) UMAP representation of the different subsets of myeloid and lymphoid leukocyte subsets. PBMCs from seven controls (including one pediatric control), one IL-12Rβ1-deficient patient, and three TYK2-deficient patients (P-Tur [L767*/L767*], P1 [C70Hfs*21/C70Hfs*21], and P11 [P216Rfs*14/P216Rfs*14]) were analyzed. (B) Proportions of leukocyte subsets. (C) Pseudobulk principal component analysis. (D) GSEA. TYK2- and IL-12Rβ1–deficient cells were compared with healthy controls. Immune-related gene sets were chosen for visualization. (E) Heatmap analysis of the GSEA leading-edge genes for the Hallmark IFN-γ response gene set shared between TYK2- and IL-12Rβ1-deficient classic monocytes. Normalized Z-transformed pseudobulk read counts are shown. (F) Single-cell expression levels of MX1 and IRF9 mRNA. Only cells from healthy controls studied in the same batch of experiment with TYK2- and IL-12Rβ1-deficient patients are analyzed. CM, central memory; EM, effector memory; DN, double negative; MAIT, mucosal associated invariant T cells; TEMRA, terminally differentiated effector memory T cells; ClasMono, classical monocytes; IntMono, intermediate monocytes; NClasMono, nonclassical monocytes; cDC, conventional dendritic cells; pDC, plasmacytoid dendritic cells.
Figure 7.
Figure 7.
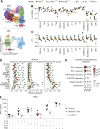
Analysis of cellular responses to IL-23 and IFN-α2 in PBMCs. (A–E) Cryopreserved PBMCs from two healthy controls, one TYK2-deficient patient (P-Tur [L767*/L767*]), one IL-12Rβ1–deficient patient, and one IFN-αR2–deficient patient were either left nonstimulated or were stimulated with IL-23 or IFN-α2 for 6 h, before being subjected to scRNA-seq analysis. Three batches of experiments were integrated via Harmony (Korsunsky et al., 2019). (A) Unsupervised clustering followed by manual identification with the aid of the SingleR pipeline (Aran et al., 2019) guided by the MonacoImmuneDataset (Monaco et al., 2019). (B) Relative abundance of each leukocyte subset according to clustering analysis. (C) Batch-corrected pseudobulk PCA. The first principal components are shown for each individual leukocyte subset. (D) Batch-corrected pseudobulk WGCNA. Three stimulation-dependent modules of coexpressed genes were identified. (E) Gene set overrepresentation analysis for genes in the three modules in D. Four gene sets with the highest odds ratio were selected for each module. Black dots are not statistically significant. (F) IFN-γ production by PBMCs from healthy controls and TYK2-deficient patients (two patients homozygous for the P1104A TYK2 variant and P5, homozygous for the G634E TYK2 variant), together with an IL-12Rβ1–deficient patient as a negative control, following stimulation with IL-12, IL-23, IL-1β, or a combination of IL-1β and IL-23. PMA-ionomycin was used as a control. *, P < 0.05, two-tailed Student’s t tests with Welch’s correction. Nonsignificant values are not indicated. MAIT, mucosal associated invariant T cells; ClasMono, classical monocytes; NClasMono, nonclassical monocytes; pDC, plasmacytoid dendritic cells.
Figure S5.
Figure S5.
Impaired IL-23–dependent IFN-γ induction in TYK2-deficient patients. (A) Heatmap analysis of batch-corrected Z-transformed normalized pseudobulk read counts for genes in module 5 across all leukocyte subsets identified. (B) TFEA with ChEA3 (https://maayanlab.cloud/chea3/; Keenan et al., 2019) for module 5 genes. (C) Single-cell expression of IFNG mRNA across leukocyte subsets. Percentages of cells containing at least one read for IFNG are quantified. A given individual-cell type pair was excluded from the analysis if <100 cells were available. (D) IFN-γ production following stimulation by IL-1β, IL-12, and IL-23 or a combination in PBMC from controls, TYK2-deficient patients (P-Tur once and P17 twice), and an IL-12Rβ1–deficient patient, measured with a LegendPlex assay.
Figure 8.
Figure 8.
Schematic representation of the TYK2-dependent signaling pathways and the resulting functional deficiency in the five forms of TYK2 deficiency identified.

References

    1. Anders, S., Pyl P.T., and Huber W.. 2015. HTSeq: A Python framework to work with high-throughput sequencing data. Bioinformatics. 31:166–169. 10.1093/bioinformatics/btu638 - DOI - PMC - PubMed
    1. Aran, D., Looney A.P., Liu L., Wu E., Fong V., Hsu A., Chak S., Naikawadi R.P., Wolters P.J., Abate A.R., et al. . 2019. Reference-based analysis of lung single-cell sequencing reveals a transitional profibrotic macrophage. Nat. Immunol. 20:163–172. 10.1038/s41590-018s4150276-y - DOI - PMC - PubMed
    1. Arias, A.A., Perez-Velez C.M., Orrego J.C., Moncada-Velez M., Rojas J.L., Wilches A., Restrepo A., Trujillo M., Garces C., Arango-Ferreira C., et al. . 2017. Severe enteropathy and hypogammaglobulinemia complicating refractory mycobacterium tuberculosis complex disseminated disease in a child with IL-12Rbeta1 deficiency. J. Clin. Immunol. 37:732–738. 10.1007/s10875-017-0435-1 - DOI - PubMed
    1. Bastard, P., Manry J., Chen J., Rosain J., Seeleuthner Y., AbuZaitun O., Lorenzo L., Khan T., Hasek M., Hernandez N., et al. . 2021. Herpes simplex encephalitis in a patient with a distinctive form of inherited IFNAR1 deficiency. J. Clin. Invest. 131:e139980. 10.1172/jci139980 - DOI - PMC - PubMed
    1. Belkadi, A., Pedergnana V., Cobat A., Itan Y., Vincent Q.B., Abhyankar A., Shang L., El Baghdadi J., Bousfiha A., Exome/Array Consortium, et al. . 2016. Whole-exome sequencing to analyze population structure, parental inbreeding, and familial linkage. Proc. Natl. Acad. Sci. USA. 113:6713–6718. 10.1073/pnas.1606460113 - DOI - PMC - PubMed

Publication types

Supplementary concepts