. 2023 Mar 1;207(5):566-576.
doi: 10.1164/rccm.202204-0751OC.

Obesity Is Associated with Attenuated Tissue Immunity in COVID-19

Affiliations

Obesity Is Associated with Attenuated Tissue Immunity in COVID-19

Shuang A Guo et al. Am J Respir Crit Care Med. .

Abstract

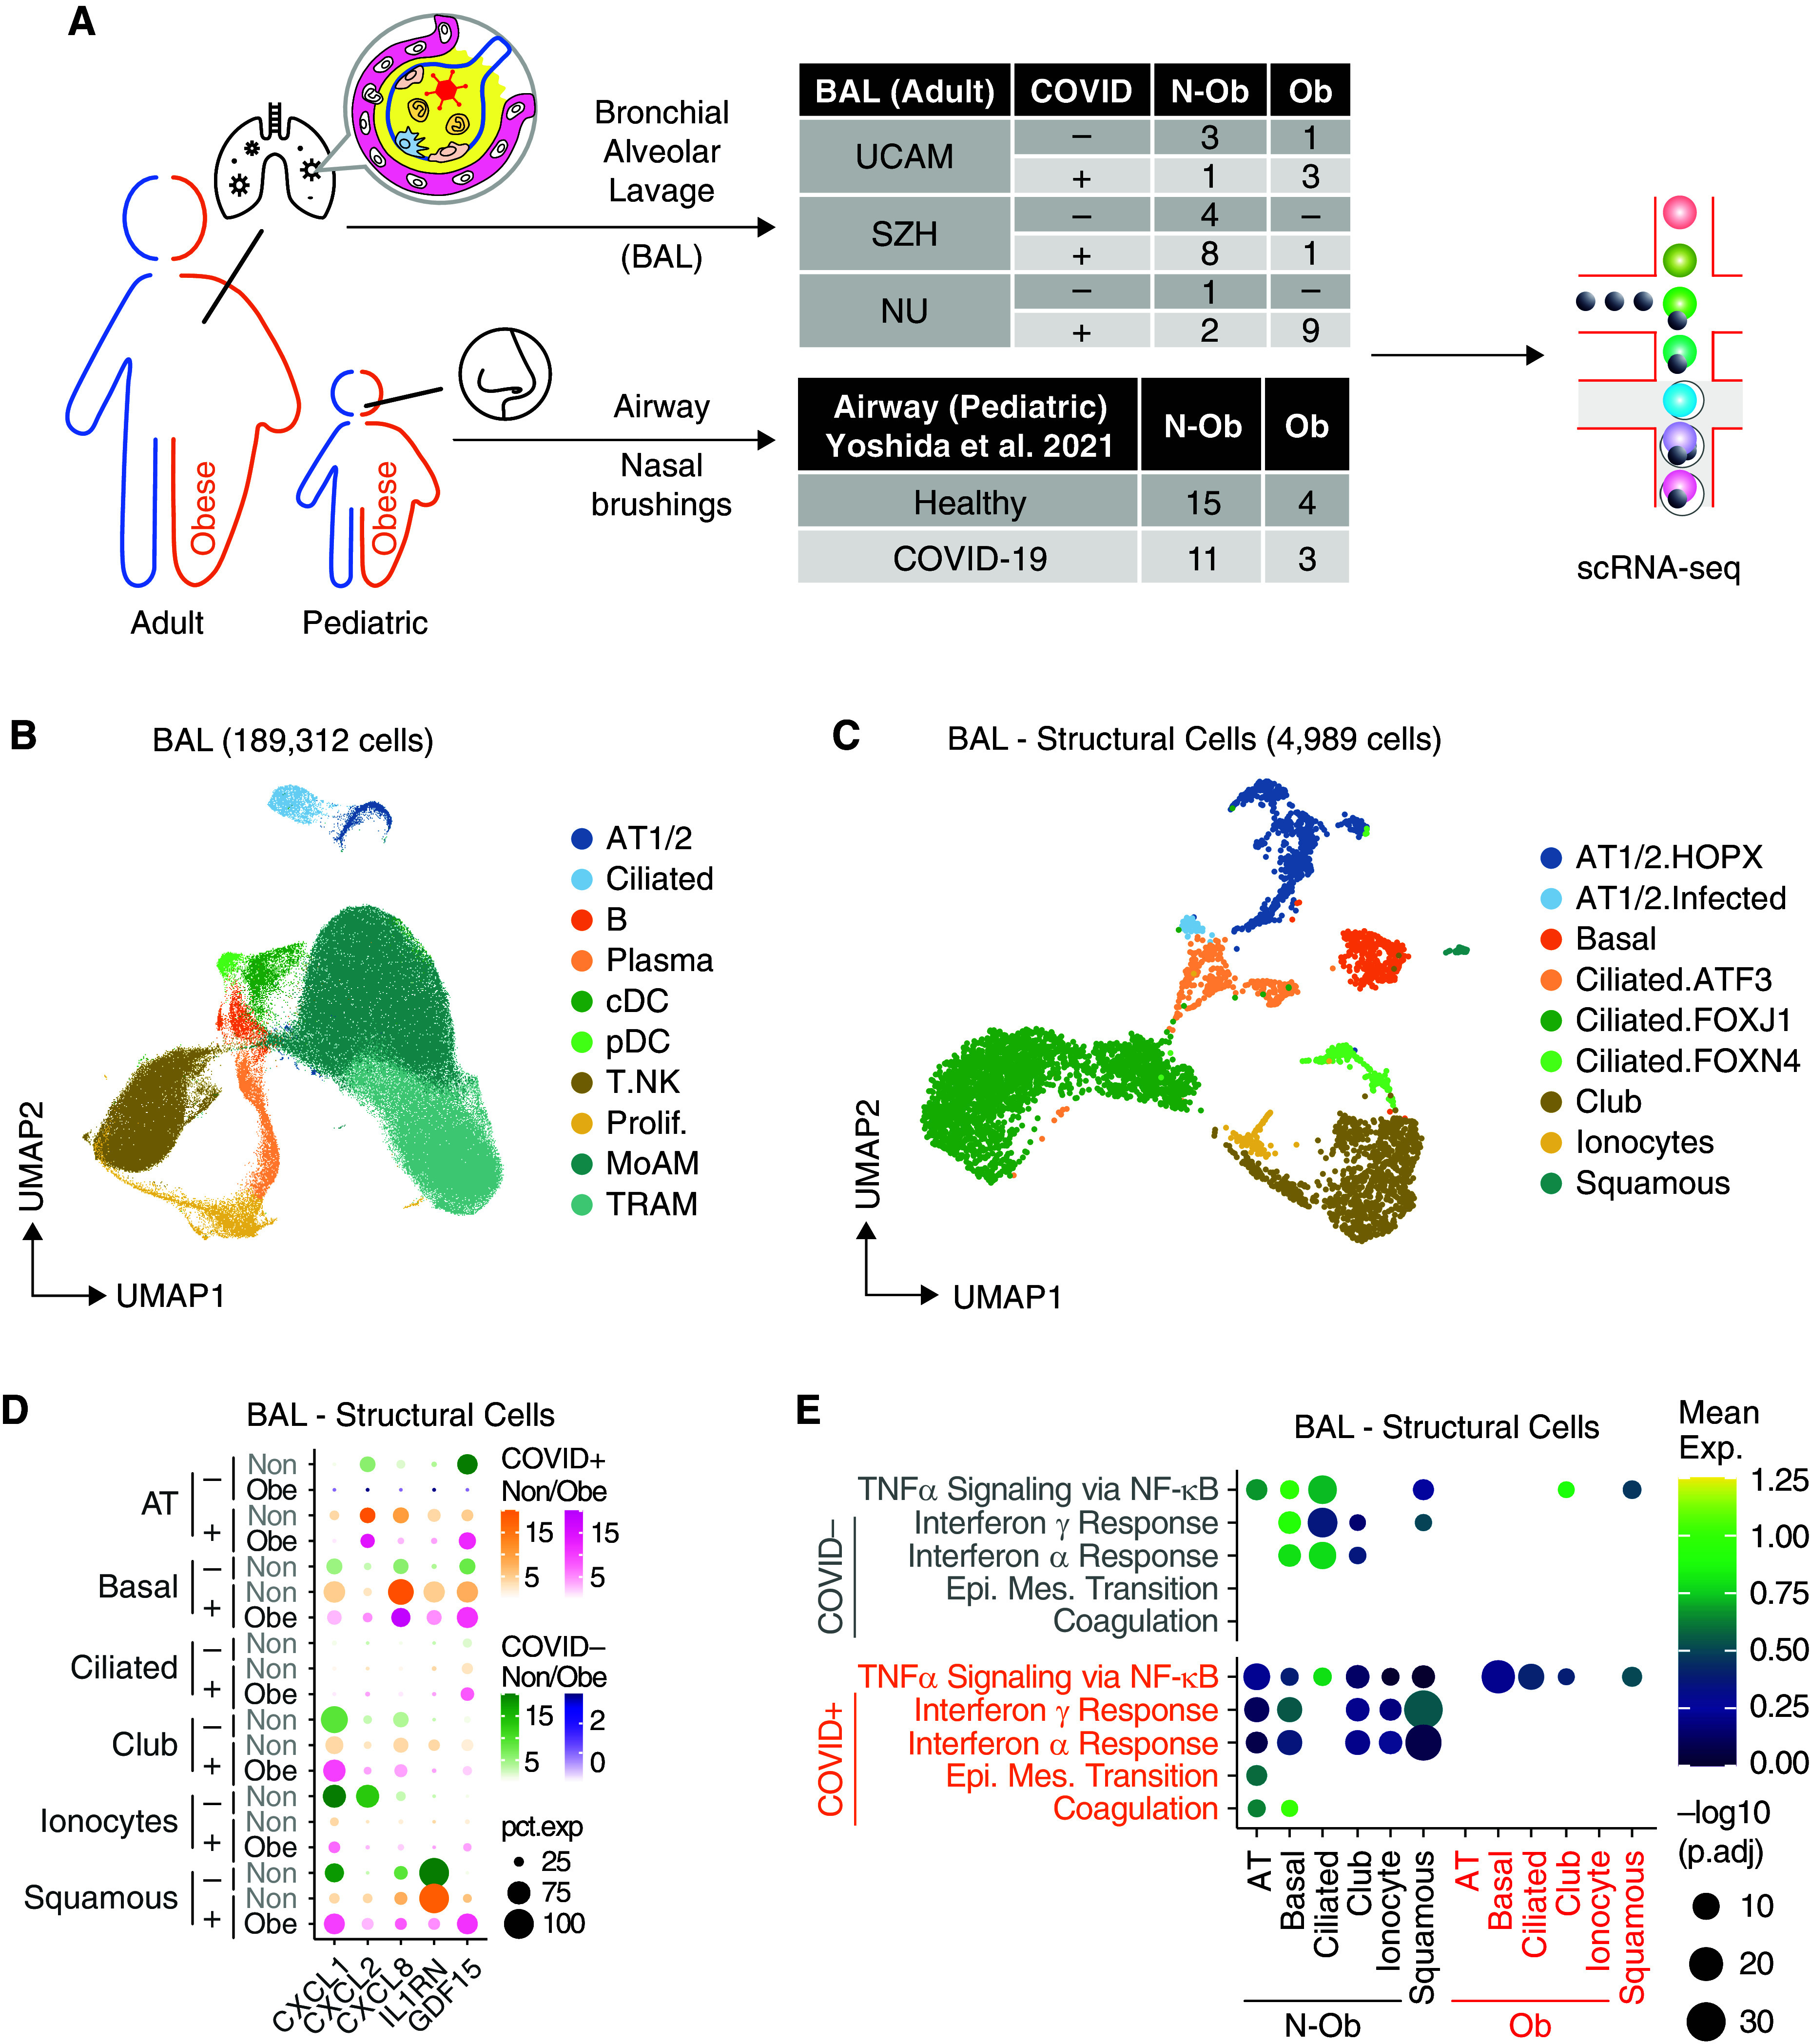
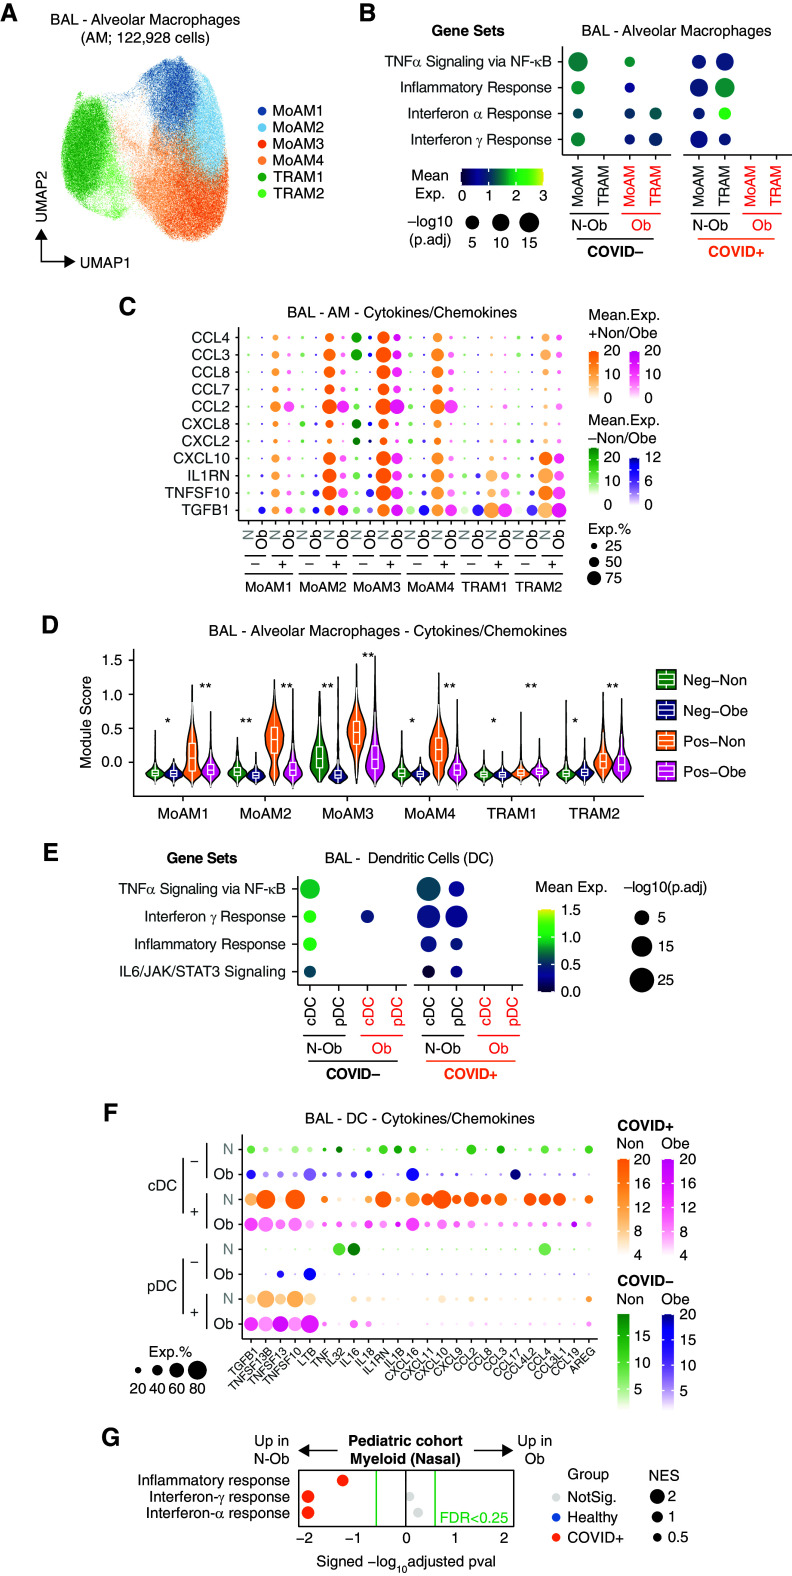
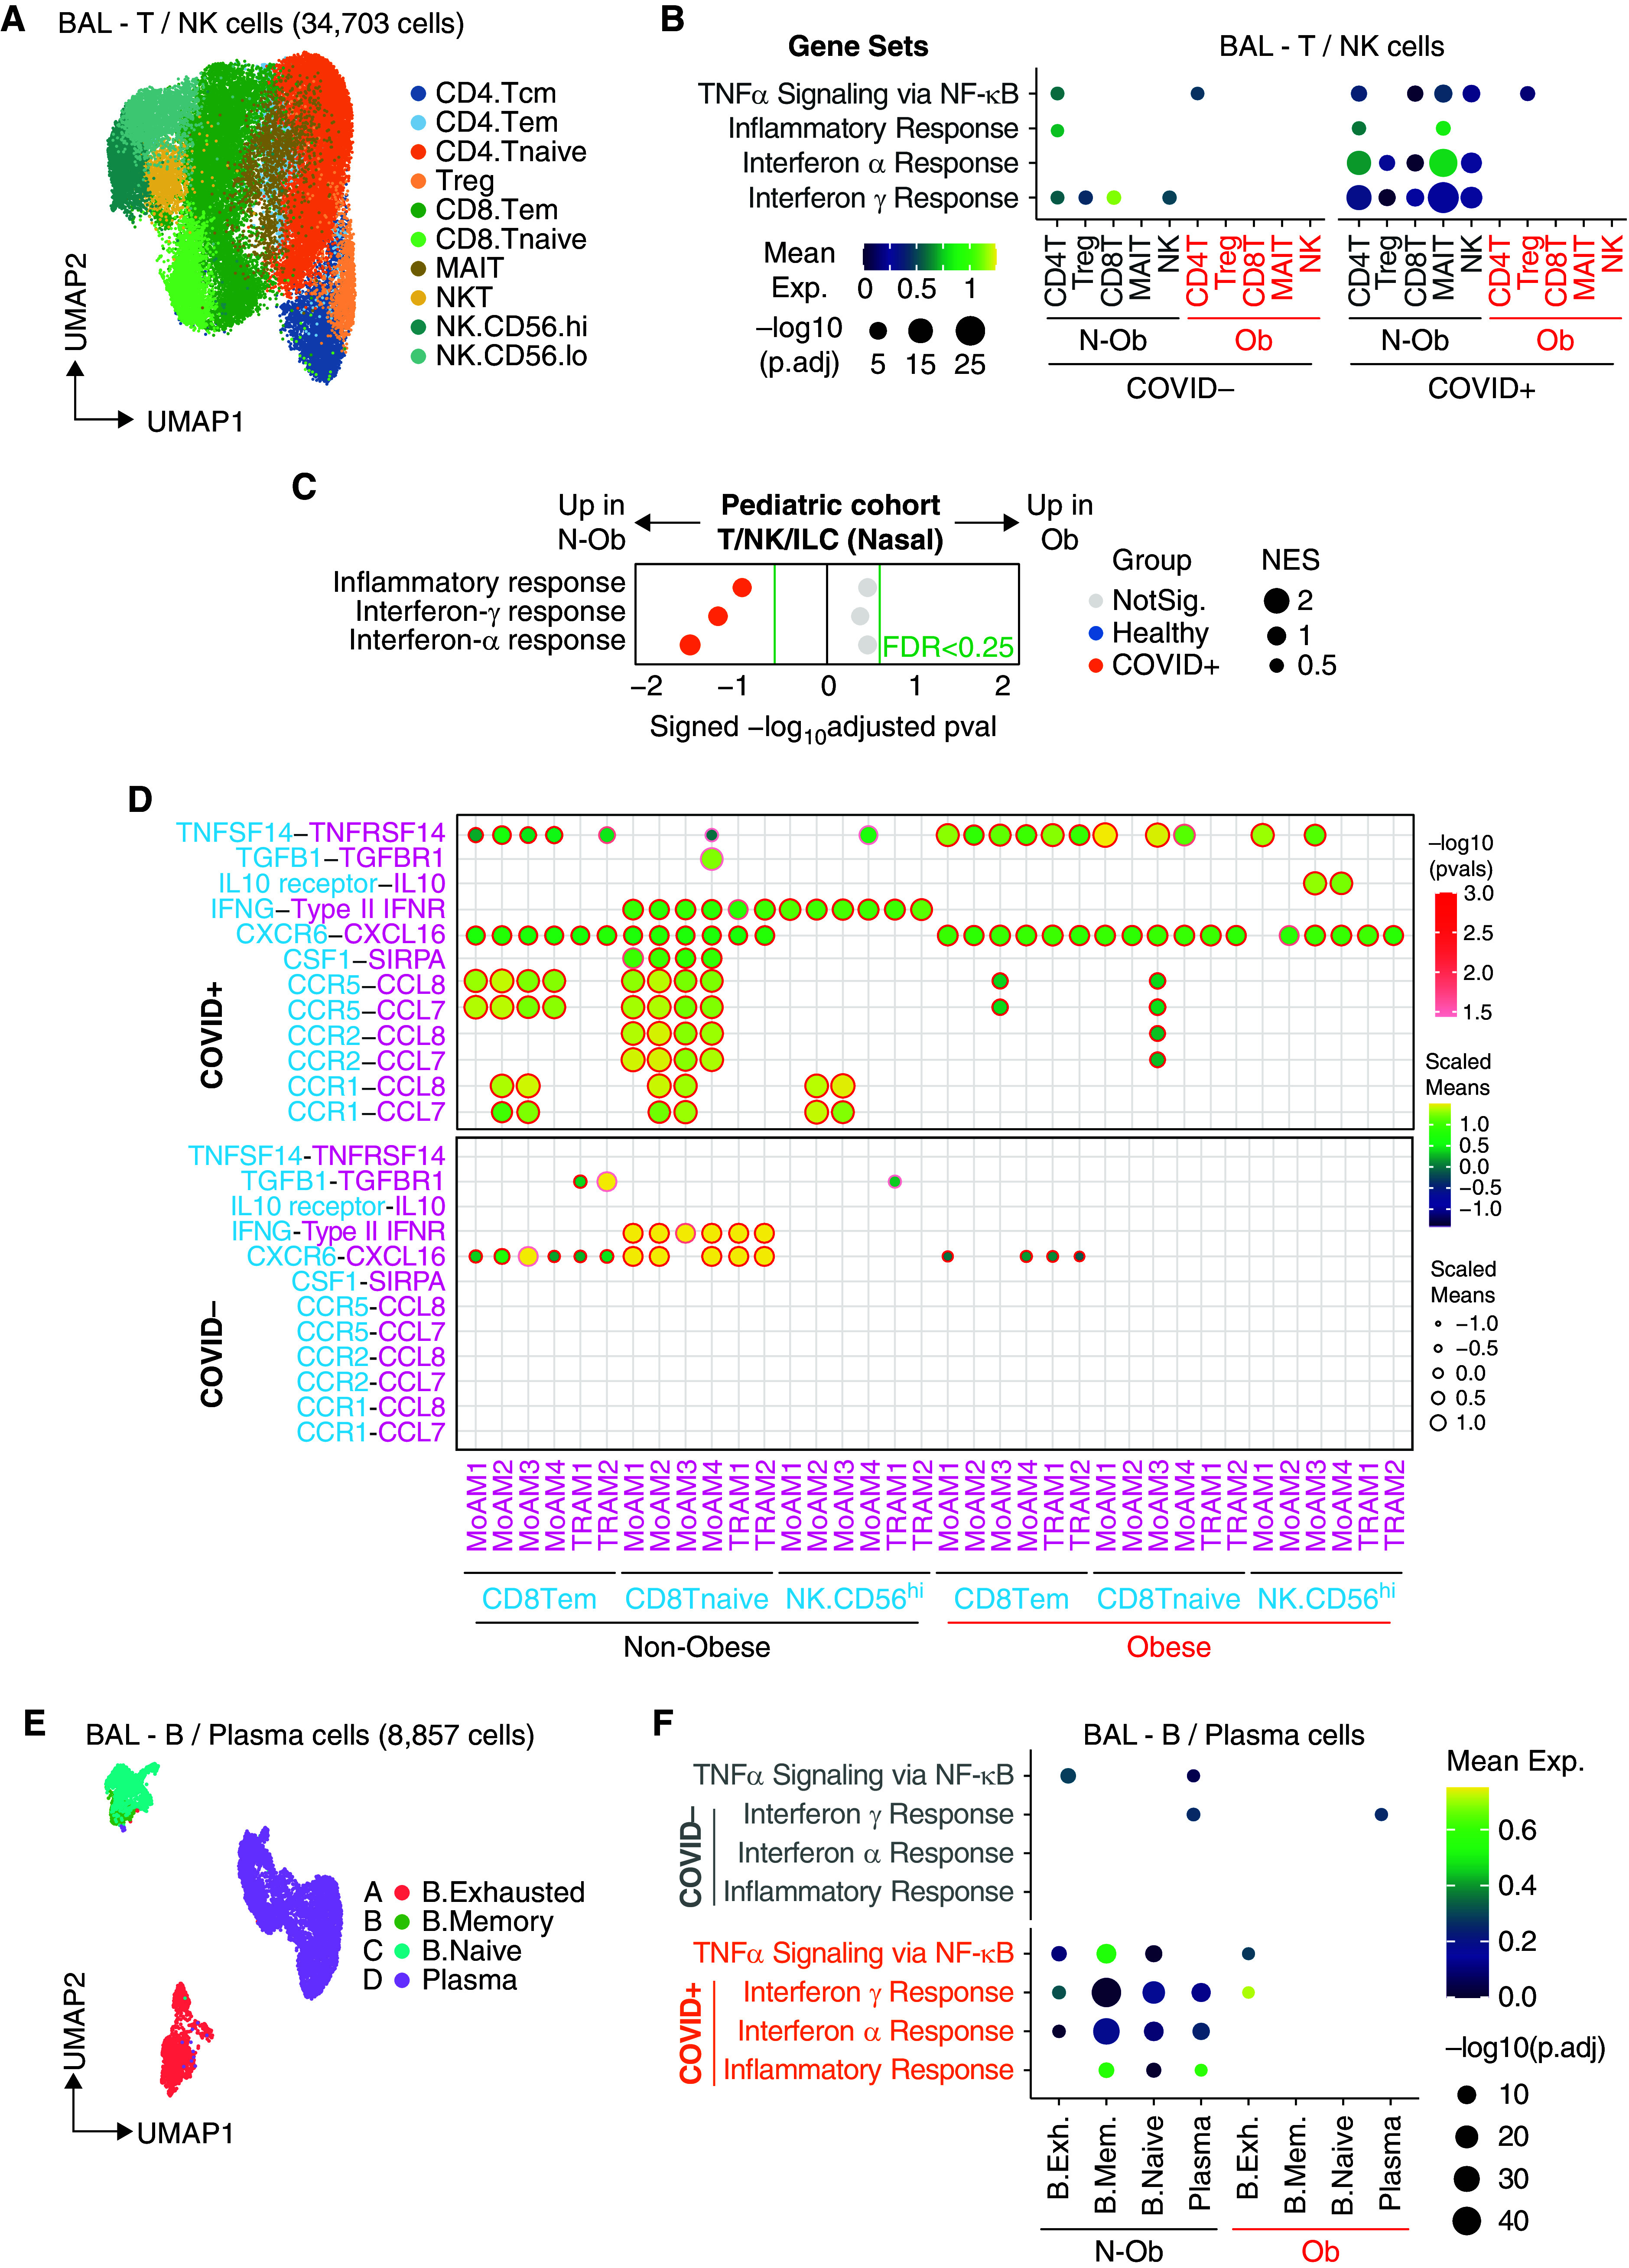
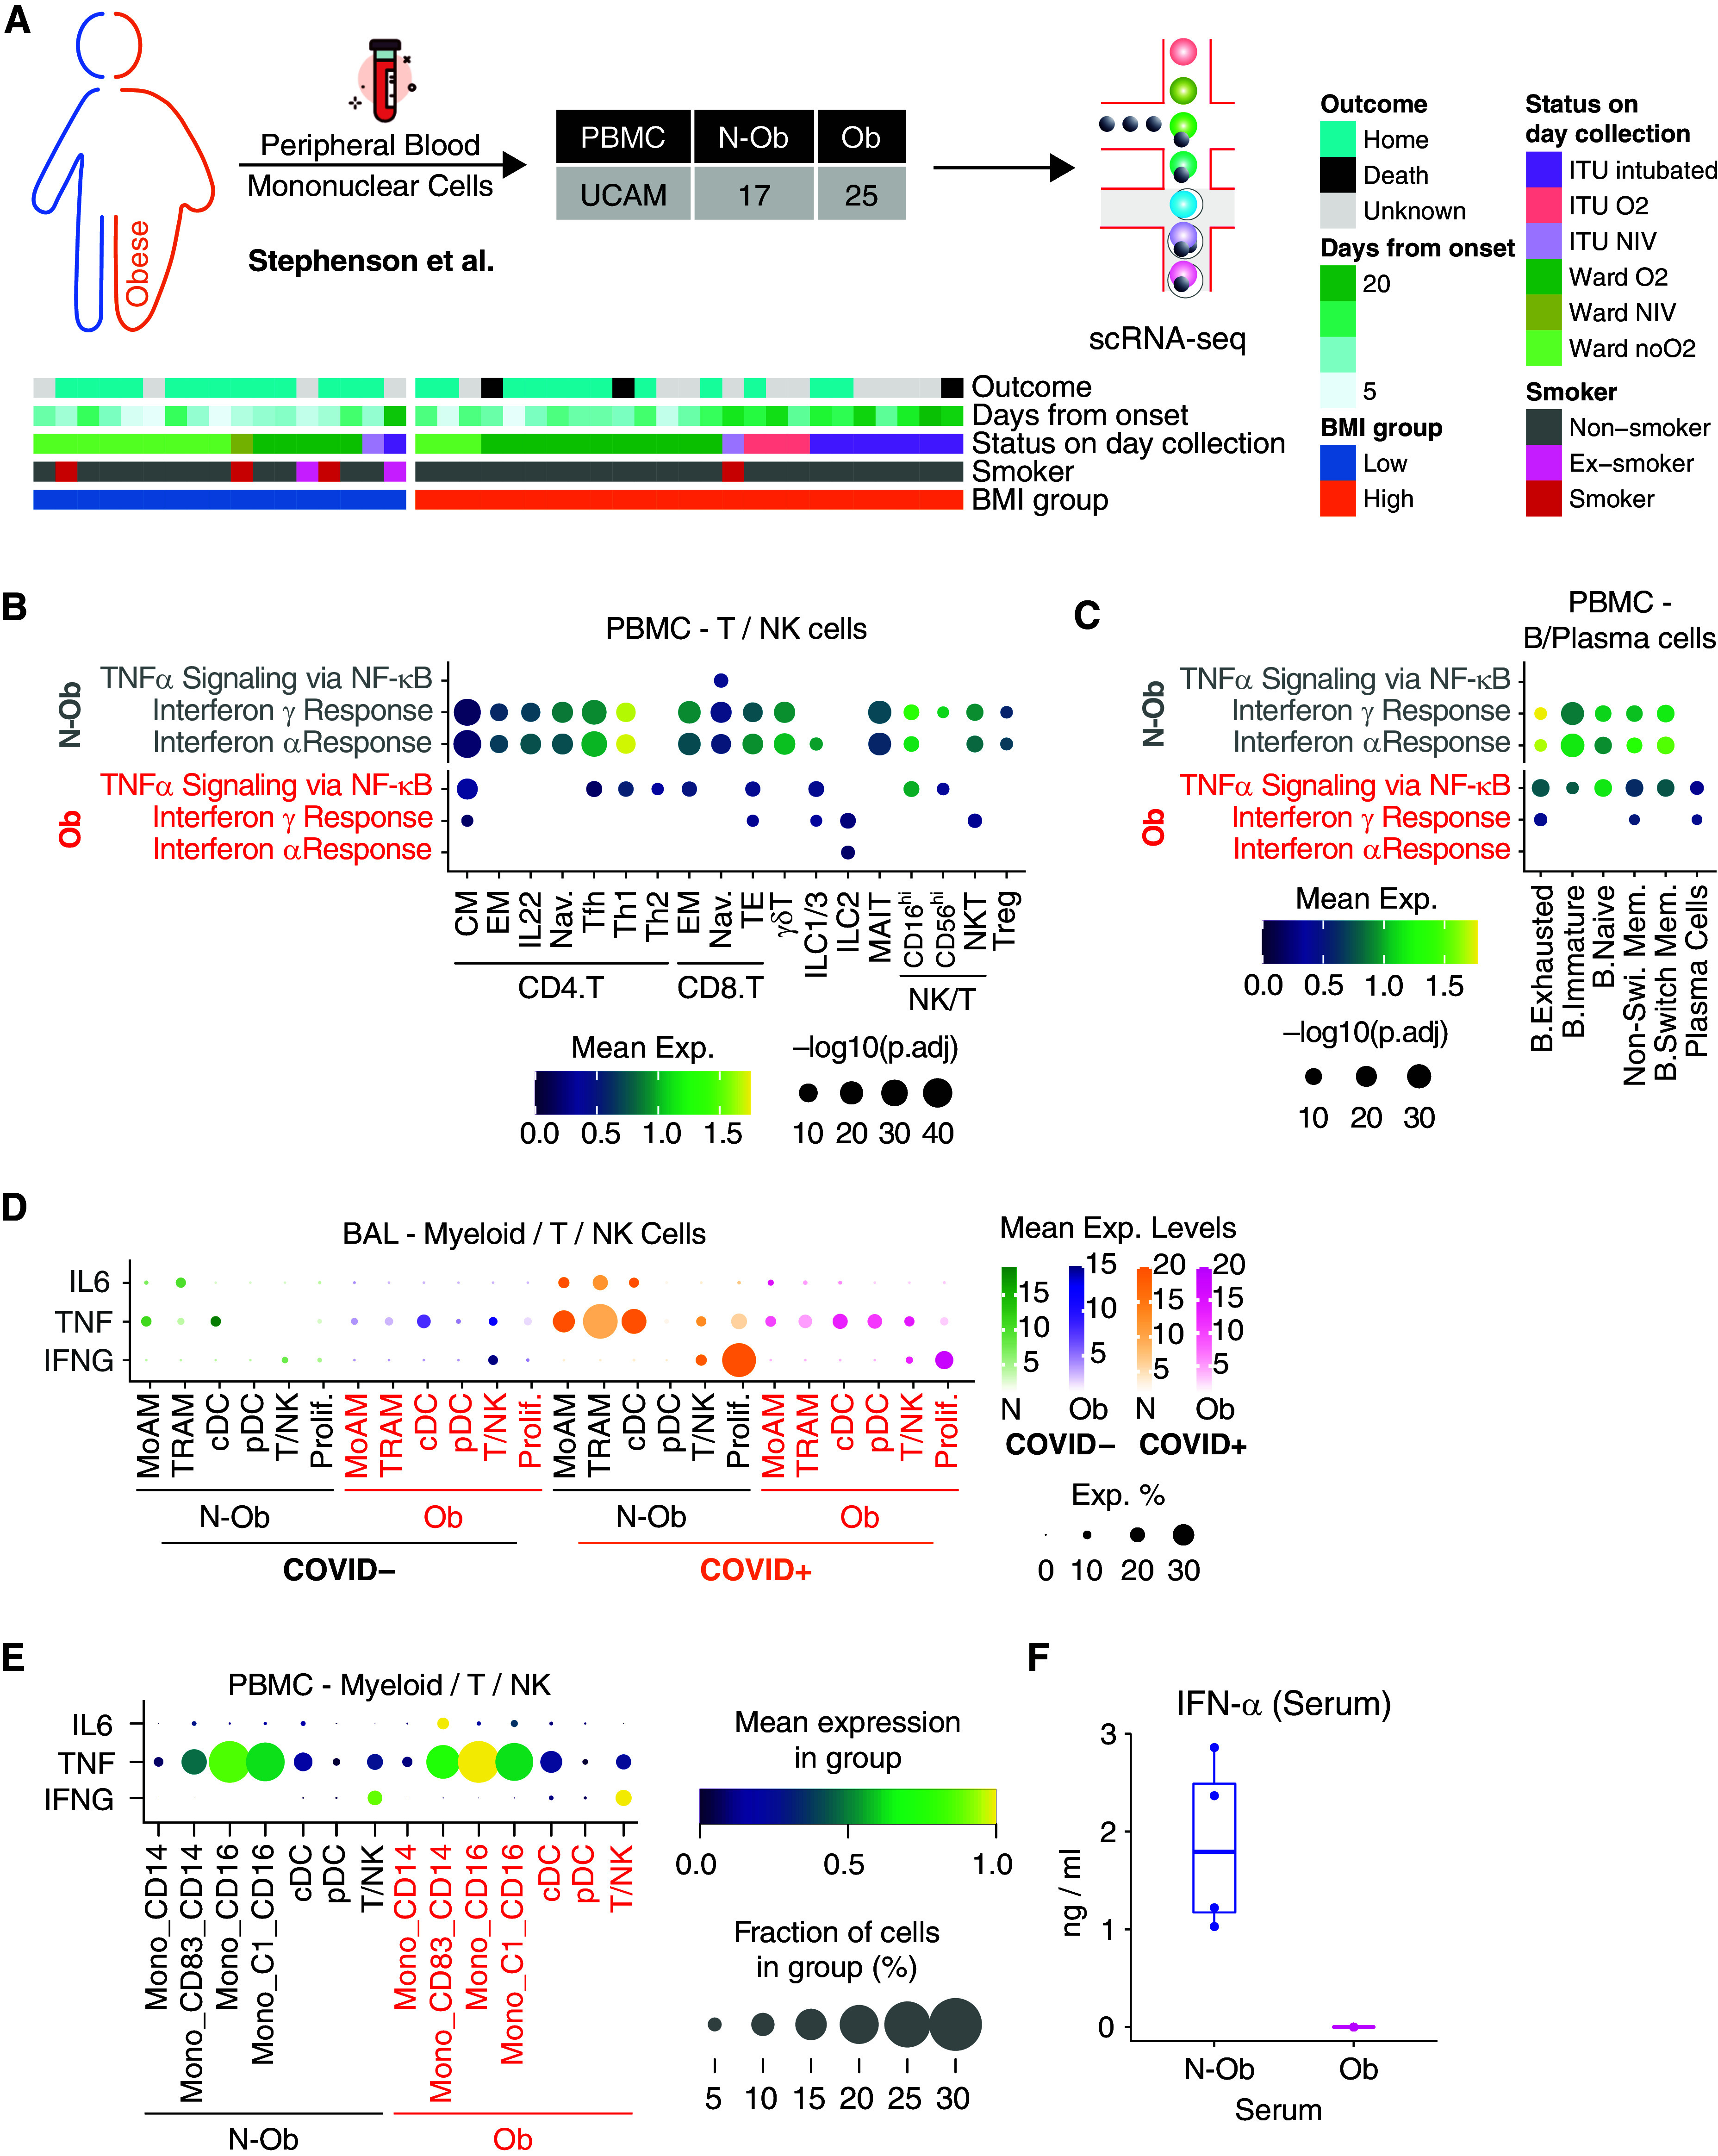
Rationale: Obesity affects 40% of U.S. adults, is associated with a proinflammatory state, and presents a significant risk factor for the development of severe coronavirus disease (COVID-19). To date, there is limited information on how obesity might affect immune cell responses in severe acute respiratory syndrome coronavirus 2 (SARS-CoV-2) infection. Objectives: To determine the impact of obesity on respiratory tract immunity in COVID-19 across the human lifespan. Methods: We analyzed single-cell transcriptomes from BAL in three ventilated adult cohorts with (n = 24) or without (n = 9) COVID-19 from nasal immune cells in children with (n = 14) or without (n = 19) COVID-19, and from peripheral blood mononuclear cells in an independent adult COVID-19 cohort (n = 42), comparing obese and nonobese subjects. Measurements and Main Results: Surprisingly, we found that obese adult subjects had attenuated lung immune or inflammatory responses in SARS-CoV-2 infection, with decreased expression of IFN-α, IFN-γ, and TNF-α (tumor necrosis factor α) response gene signatures in almost all lung epithelial and immune cell subsets, and lower expression of IFNG and TNF in specific lung immune cells. Peripheral blood immune cells in an independent adult cohort showed a similar but less marked reduction in type-I IFN and IFNγ response genes, as well as decreased serum IFNα, in obese patients with SARS-CoV-2. Nasal immune cells from obese children with COVID-19 also showed reduced enrichment of IFN-α and IFN-γ response genes. Conclusions: These findings show blunted tissue immune responses in obese patients with COVID-19, with implications for treatment stratification, supporting the specific application of inhaled recombinant type-I IFNs in this vulnerable subset.

Keywords: COVID-19; bronchoalveolar lavage; obesity; single-cell RNA sequencing; type-I interferon.


Figures

Figure 1.
Figure 1.
Single-cell analysis of BAL fluid samples from patients with or without coronavirus disease (COVID-19) reveals differences in gene set enrichment in structural cells in nonobese compared with obese subjects. (A) Overview of the workflow. In this study, we included BAL samples from 33 patients from three cohorts with BMI information, namely UCAM (University of Cambridge) (n = 8; ob = 3; this study), SZH (Shenzhen Third Hospital) (n = 13; ob = 1; Liao and colleagues [18]), and NU (Northwestern University) (n = 12; ob = 9; Grant and colleagues [19]). BMI data on pediatric subjects with airway sampling was obtained from Yoshida and colleagues (20). (B) Uniform manifold approximation and projection (UMAP) embedding of 189,312 cells after integration of the three datasets. Cells are colored according to harmonized broad cell type annotations. (C) UMAP embedding of 4,989 epithelial and structural cells after integration colored according to harmonized fine cell type annotations. (D) Mean expression dot plot of the top differentially expressed cytokines and chemokines in each epithelial subpopulation in the COVID+ BAL samples. Expression amounts in each case are indicated by distinct color gradients (green: nonobese without COVID-19; yellow: nonobese with COVID-19; purple: obese without COVID-19; and magenta: obese with COVID-19). Expression percentages are indicated by dot sizes. Basal, ciliated, and club cells not identified in obese without COVID-19 samples are not shown. (E) Mean expression dot plot of five most enriched immune pathways within Hallmark gene sets for epithelial/structural cells. Mean expression of genes contained in each gene set within each cell type, separated into nonobese versus obese groups, are indicated by color gradients. P values are indicated by dot sizes. AT = alveolar type; BMI = body mass index; Epi. Mes. = epithelial mesenchymal; exp = expression; N-ob = nonobese; ob = obese; pct.exp = expression percentage; Prolif. = proliferating; scRNAseq = single-cell RNA sequencing.
Figure 2.
Figure 2.
Single-cell analysis of BAL fluid samples from patients with or without coronavirus disease (COVID-19) reveals differences in gene set enrichment in myeloid cells in nonobese compared with obese subjects. (A) Uniform manifold approximation and projection (UMAP) embedding of 122,928 myeloid cells colored according to fine cell type annotation, as per Grant and colleagues (19). (B) Mean expression dot plot of most enriched immune and metabolic pathways within Hallmark gene sets for each macrophage subpopulation. Mean expression of genes contained in each gene set within each cell type, separated into nonobese versus obese and COVID versus COVID+ groups, are indicated by color gradients. P values are indicated by dot sizes. (C) Mean expression dot plots of transcripts for the top differentially expressed cytokines and chemokines in each macrophage subpopulation in the BAL samples. Expression amounts in each case are indicated by distinct color gradients (green: nonobese without COVID-19; yellow: nonobese with COVID-19; purple: obese without COVID-19; and magenta: obese with COVID-19). Expression percentages are indicated by dot sizes. (D) Violin plot depicting mean expression amounts of transcripts for cytokines and chemokines in each macrophage subpopulation. Differences between nonobese versus obese with or without COVID-19 infection remain significant by Wilcoxon rank-sum test (*p.adj < 1 × 10−5 and **p.adj < 1 × 10−15). (E) Mean expression dot plot of most enriched immune and metabolic pathways within Hallmark gene sets for classical dendritic cells (cDCs) and plasmacytoid dendritic cells (pDCs). Mean expression of genes contained in each gene set within each cell type, separated into nonobese versus obese and COVID versus COVID+ groups, are indicated by color gradients. P values are indicated by dot sizes. (F) Mean expression dot plots of transcripts for the top differentially expressed cytokines and chemokines in each DC subpopulation in the BAL samples. Expression amounts in each case are indicated by distinct color gradients (green: nonobese without COVID-19; yellow: nonobese with COVID-19; purple: obese without COVID-19; and magenta: obese with COVID-19). Expression percentages are indicated by dot sizes. (G) Dot plot of gene set enrichment analysis of Hallmark gene sets in myeloid cells from pediatric airway samples (Yoshida and colleagues [20]) between nonobese versus obese children. NES of each pathway is indicated by dot size. The color of the circles indicates which comparison was significantly enriched (healthy or COVID-19); gray circles are not significant. BH FDR 0.25 was used as the cut-off, as indicated in the figure in green text. BH FDR = Benjamini-Hochberg adjusted false discovery rate; exp = expression; MoAM = monocyte-derived macrophage; N-ob = nonobese; Neg = negative; NES = normalized enrichment score; ob = obese; Pos = positive; TNF = tumor necrosis factor; TRAM = tissue-resident macrophage.
Figure 3.
Figure 3.
Single-cell analysis of lymphocytes shows reduced enrichment of type-I and γ IFN response genes in obese patients with coronavirus disease (COVID-19). (A) Uniform manifold approximation and projection (UMAP) embedding of 34,703 T/natural killer (NK) cells after integration. CD4 T cells (Tcm [central memory T cells], Tem [effector memory T cells], Tnaive [naive T cells], and Treg [regulatory T cells]), CD8 T cells (Tem, Tnaive, and MAIT), NKT cells, and NK cells (CD56high or CD56low). (B) Dot plot of gene set enrichment analysis of top four most enriched immune pathways within Hallmark gene sets for T/NK cells. Mean expression of genes contained in each gene set within each cell type, separated into nonobese versus obese groups, are indicated by color gradients. P values are indicated by dot sizes. (C) Dot plot of gene set enrichment analysis of Hallmark gene sets in T/NK/ILC cells from pediatric airway samples (Yoshida and colleagues [20]) between nonobese and obese children. NES of each pathway is indicated by dot size. The color of the circles indicates which comparison was significantly enriched (healthy or COVID-19); gray circles are not significant. BH FDR 0.25 was used as the cut-off, as indicated in the figure in green text. (D) Ligand–receptor analysis with CellPhoneDB infers distinct interactions between CD8.Tem/CD8.Tnaive/NK.CD56hi and alveolar macrophages. The size and color gradient of circles indicate the scaled interaction score; interaction scores are scaled row-wise. The red outline indicates P < 0.05. (E) UMAP embedding of 8,857 B/plasma cells after integration colored according to harmonized fine cell type annotations. (F) Dot plot of gene set enrichment analysis of top four most enriched immune pathways within Hallmark gene sets for B/plasma cells. Mean expression of genes contained in each gene set within each cell type, separated into nonobese versus obese groups, are indicated by color gradients. P values are indicated by dot sizes. B.Exh = B. exhausted; B.Mem = B. memory; BH FDR = Benjamini-Hochberg adjusted false discovery rate; ILC = innate lymphoid cells; MAIT = mucosal-associated invariant T cells; N-ob = nonobese; NKT = natural killer T cells; NES = normalized enrichment score; NotSig. = not significant; Ob = obese; TNF = tumor necrosis factor.
Figure 4.
Figure 4.
Validation of the signaling pathways in peripheral blood mononuclear cell (PBMC) samples. (A) Sample demographics of Stephenson and colleagues (25) PBMC samples used in this study. (B) Dot plot of gene set enrichment analysis of most enriched immune pathways within Hallmark gene sets for each T/natural killer (NK)/ILC subpopulation in PBMCs. Mean expression of genes contained in each gene set within each cell type, separated into nonobese versus obese groups, are indicated by color gradients. P values are indicated by dot sizes. (C) Dot plot of gene set enrichment analysis of most enriched immune pathways within Hallmark gene sets for each B/plasma subpopulation in PBMCs. Mean expression of genes contained in each gene set within each cell type, separated into nonobese versus obese groups, are indicated by color gradients. P values are indicated by dot sizes. (D) Mean expression dot plots of transcripts for IFN-γ, IL-6, and TNF-α in myeloid, T, and NK cells in the BAL samples. Expression amounts in each case are indicated by distinct color gradients (green: nonobese without COVID-19; yellow: nonobese with COVID-19; purple: obese without COVID-19; and magenta: obese with COVID-19). Expression percentages are indicated by dot sizes. (E) Mean expression dot plots for IL-6, TNF, and IFN-G in PBMC cell clusters from Stephenson and colleagues (25) grouped according to BMI status. The size of circles corresponds to the fraction of cells expressing each gene, and an increasing gradient from purple to yellow corresponds to an increasing mean expression value (standardized to 0–1 per gene). (F) Serum IFN-α measurements from n = 4 obese and n = 4 nonobese patients from the adult PBMC patient cohort (Stephenson and colleagues [25]). All four Obese samples were below detection limits. BMI = body mass index; cDC = classical dendritic cell; CM = central memory; EM = effector memory; ILC = Innate lymphoid cells; MoAM = monocyte-derived macrophage; N-ob = nonobese; Ob = obese; pDC = plasmacytoid dendritic cell; Tfh = T follicular helper; TNF = tumor necrosis factor; TRAM = tissue-resident macrophage.

Comment in

  • Obesity and COVID-19 Disease: To Inflame or Not.
    Hough RF, Wark PA. Hough RF, et al. Am J Respir Crit Care Med. 2023 Mar 1;207(5):503-504. doi: 10.1164/rccm.202209-1797ED. Am J Respir Crit Care Med. 2023. PMID: 36170639 Free PMC article. No abstract available.

References

    1. Guan WJ, Ni ZY, Hu Y, Liang WH, Ou CQ, He JX, et al. China Medical Treatment Expert Group for Covid-19 Clinical characteristics of coronavirus disease 2019 in China. N Engl J Med . 2020;382:1708–1720. - PMC - PubMed
    1. Williamson EJ, Walker AJ, Bhaskaran K, Bacon S, Bates C, Morton CE, et al. Factors associated with COVID-19-related death using OpenSAFELY. Nature . 2020;584:430–436. - PMC - PubMed
    1. Tartof SY, Qian L, Hong V, Wei R, Nadjafi RF, Fischer H, et al. Obesity and mortality among patients diagnosed with COVID-19: results from an integrated health care organization. Ann Intern Med . 2020;173:773–781. - PMC - PubMed
    1. Anderson MR, Geleris J, Anderson DR, Zucker J, Nobel YR, Freedberg D, et al. Body mass index and risk for intubation or death in SARS-CoV-2 infection: a retrospective cohort study. Ann Intern Med . 2020;173:782–790. - PMC - PubMed
    1. Collier DA, De Marco A, Ferreira IATM, Meng B, Datir RP, Walls AC, et al. CITIID-NIHR BioResource COVID-19 Collaboration COVID-19 Genomics UK (COG-UK) Consortium. Sensitivity of SARS-CoV-2 B.1.1.7 to mRNA vaccine-elicited antibodies. Nature . 2021;593:136–141. - PMC - PubMed

Publication types

Substances