. 2022 Sep 20;119(38):e2207525119.
doi: 10.1073/pnas.2207525119. Epub 2022 Sep 12.

Implanted synthetic cells trigger tissue angiogenesis through de novo production of recombinant growth factors

Affiliations

Implanted synthetic cells trigger tissue angiogenesis through de novo production of recombinant growth factors

Gal Chen et al. Proc Natl Acad Sci U S A. .

Abstract

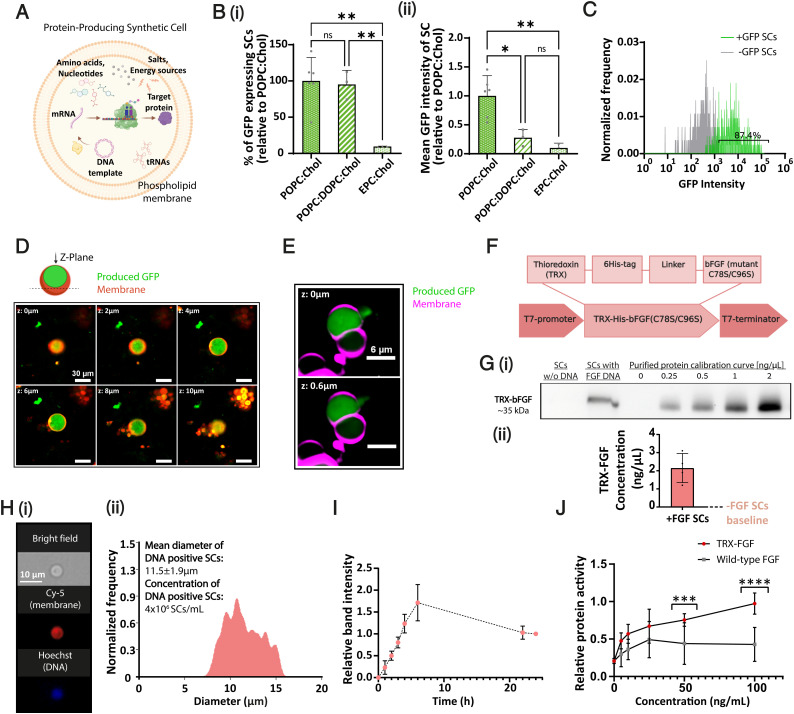
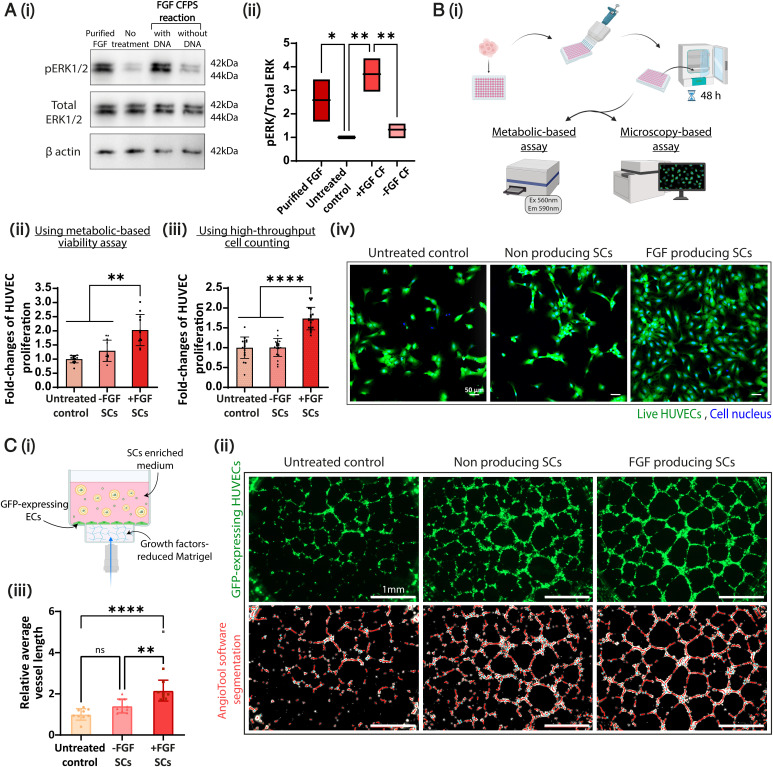
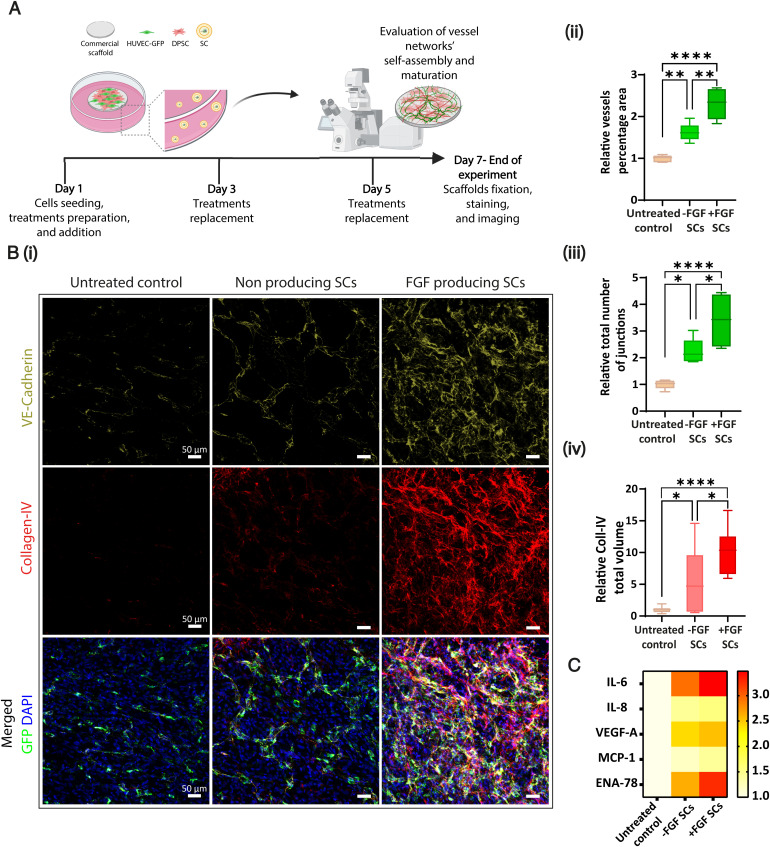
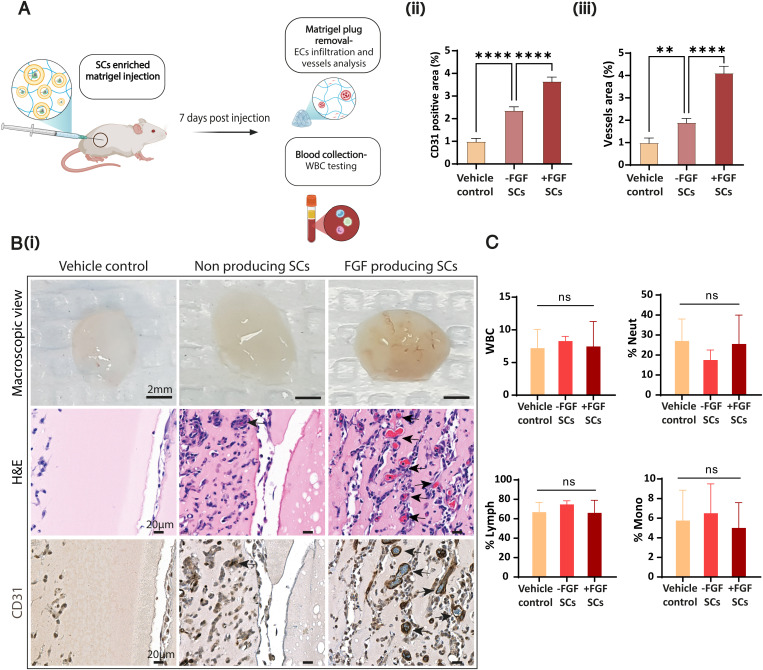
Progress in bottom-up synthetic biology has stimulated the development of synthetic cells (SCs), autonomous protein-manufacturing particles, as dynamic biomimetics for replacing diseased natural cells and addressing medical needs. Here, we report that SCs genetically encoded to produce proangiogenic factors triggered the physiological process of neovascularization in mice. The SCs were constructed of giant lipid vesicles and were optimized to facilitate enhanced protein production. When introduced with the appropriate genetic code, the SCs synthesized a recombinant human basic fibroblast growth factor (bFGF), reaching expression levels of up to 9⋅106 protein copies per SC. In culture, the SCs induced endothelial cell proliferation, migration, tube formation, and angiogenesis-related intracellular signaling, confirming their proangiogenic activity. Integrating the SCs with bioengineered constructs bearing endothelial cells promoted the remodeling of mature vascular networks, supported by a collagen-IV basement membrane-like matrix. In vivo, prolonged local administration of the SCs in mice triggered the infiltration of blood vessels into implanted Matrigel plugs without recorded systemic immunogenicity. These findings emphasize the potential of SCs as therapeutic platforms for activating physiological processes by autonomously producing biological drugs inside the body.

Keywords: angiogenesis; artificial cells; cell-free; targeted drug delivery; tissue engineering.


Conflict of interest statement

The authors declare no competing interest.

Figures

Fig. 1.
Fig. 1.
Engineering proangiogenic SCs. (A) Schematic illustration of a protein-producing SC. (B) The effect of lipid composition on SC activity (protein production). (i) Percentage of GFP-expressing SCs in different formulations. (ii) Mean fluorescence intensity per SC (mean GFP production) of the examined formulations. All values were normalized to POPC:Chol formulation. Chol, cholesterol. Data represent mean ± SD (n = between 3 and 6). One-way ANOVA with adjusted P value in multiple comparisons tests; *P = 0.0113; **P ≤ 0.0071. (C) Percentage of protein-producing SCs in POPC:Chol–based cells. (D) Representative images of GFP-producing SCs in 2-μm scan depth gaps (z-plane); produced GFP (in green), Cy-5–labeled membrane (in red). Scale bar, 30 μm. (E) Detection of GFP release from an SC. Cy-5–labeled (purple) and GFP (green)-producing SCs were monitored under spinning-disk confocal microscopy. Images of a single GFP-expressing SC in 0.6-μm z-plane gaps show protein release in a specific spot of the SC membrane. (F) Schematic of the different elements in the fusion TRX–human bFGF protein sequence. (G) (i and ii) Western blot quantification of TRX-FGF production in SCs after 3 h of incubation (37 °C), based on purified TRX-FGF protein calibration curve (n = 4). Data represent mean ± SD. (H) Imaging flow cytometry characterization of FGF-producing SCs. (i) SCs were fabricated with Cy-5–conjugated lipid (red) incorporated in their membrane and stained using Hoechst DNA dye (blue). (ii) Mean diameter histogram of DNA-positive SCs (blue+red+) and their concentration. (I) Production kinetics of TRX-FGF in SCs at 37 °C over 24 h. Samples of each gel were normalized to their corresponding 24-h sample (= 1), (n = 3). For data analysis, n represents the number of independent samples from each group. Data represent mean ± SD. (J) Purified TRX-FGF shows higher protein activity than a native basic FGF. Protein activity was evaluated by inducing primary HUVEC proliferation in different concentrations [ng/mL]. Values were normalized to 100 ng/mL of TRX-FGF treatment. Data represent mean ± SD (n = 13). Unpaired two-tailed t test P value; ***P = 0.0002; ****P < 0.0001. mRNA, messenger RNA; ns, not significant; tRNA, transfer RNA; w/o, without.
Fig. 2.
Fig. 2.
Proangiogenic SCs induce endothelial cell proliferation and tube formation. (A) (i) Higher expression of pERK in HUVECs in response to a cell-free–produced FGF treatment (+FGF CF) compared to a cell-free reaction without DNA (−FGF CF); purified FGF and untreated cells are displayed in Western blot images. (ii) Band area quantification of pERK/total ERK values normalized to untreated control (n = 3). Floating bars represent min to max and mean values; *P = 0.0453, **P ≤ 0.0054. (B) (i) HUVECs were treated with SCs prepared with/without inclusion of the TRX-bFGF DNA vector (+/−FGF SCs, respectively). Increased cell proliferation was detected in +FGF SC treatment after 48 h using (ii) viability assay and (iii) cell nuclei counting. All treatments were normalized to untreated control(n = between 11 and 20). **P ≤ 0.0055; ****P < 0.0001. (iv) Representative confocal images of HUVECs treated with the indicated treatments. Live-cell cytoplasms were stained with Calcein-AM (green), and cell nuclei were stained with Hoechst (blue). Scale bar, 50 μm. (C) (i) Illustration of a cell culture well cross-section in the tube formation assay performed with GFP-expressing HUVECs that were applied with/without SC treatments. (ii) Whole-well representative images of GFP-expressing HUVECs imaged 18 h after seeding (Top) and the corresponding AngioTool software analysis images (Bottom). Scale bar, 1 mm. (iii) Computerized image analysis presents a significantly higher average vessel length in +FGF SC treatment than −FGF SCs and untreated control. Values were normalized to the untreated control values. The gray dot (+FGF SCs) represents an outlier. (n = 8 or 9). **P = 0.0014; ****P < 0.0001. All results are presented as mean ± SD; n represents the number of independent samples in each group. One-way ANOVA with adjusted P value in multiple comparisons tests was used for statistical analysis. min to max, minimum to maximum; ns, not significant; Ex, Excitation; Em, Emission; Ec, Endothelial cell.
Fig. 3.
Fig. 3.
Proangiogenic SCs drive the formation and stabilization of a three-dimensional vessel-like network. (A) DPSCs (in red) and HUVECs-GFP (in green) were coseeded on CelGro scaffolds with +/−FGF SCs or without treatment for 1 wk to test the formation of a three-dimensional vascular network. (B) (i) Representative maximum intensity projection confocal images of scaffolds fixed and immunostained for both VE-cadherin (green), endothelial cell marker, and Collagen-IV (Coll-IV, red), a main component of the basement membrane. Endogenously expressed GFP in HUVECs is marked in green. Cell nuclei were stained with DAPI (blue). Scale bar, 50 μm. (ii) Quantification of vessel area (%) and (iii) of the total number of junctions in the network shows better vasculature network properties in +FGF SCs treatment compared to controls (n = 6). *P ≤ 0.0231; **P ≤ 0.0022; ****P < 0.0001. (iv) Coll-IV total volume measured using the IMARIS surfaces module rendering shows approximately twofold higher Coll-IV secretion in +FGF SCs treatment compared to controls. All treatments were normalized to untreated control (n = 3). *P ≤ 0.0424, ****P < 0.0001. Data are presented in box and whiskers displaying min to max plot and are expressed as mean ± SD; n is the number of independent samples in each group. One-way ANOVA with adjusted P value in multiple comparisons tests was used for statistical analysis. (C) Human angiogenesis-related cytokine secretion array was performed on conditioned media collected on day 7 of the experiment. The data presented in the heat map show increased cytokine secretion when cells were treated with the +FGF SCs. Coll-IV, Collagen-IV; min to max, minimum to maximum; MCP, Monocyte chemotactic protein; ENA, Epithelial-neutrophil activating peptide.
Fig. 4.
Fig. 4.
In vivo integration of FGF-producing SCs increases endothelial cells and new capillaries infiltration toward Matrigel plugs. (A) BALB/c mice were subcutaneously injected with SCs (+/−FGF SCs) enriched growth factors–reduced Matrigel. PBS was used as assay control (vehicle control). Mice were killed 7 d after injection. (B) (i) Representative images of Matrigel plugs in macroscopic view, matching the indicated treatments (scale bar, 2 mm), of H&E-stained paraffin-embedded slides of the explanted plugs (scale bar, 20 μm), and the corresponding CD31 immunostained slides (scale bar, 20 μm). FGF-producing SC treatment shows increased convergence of newly formed blood vessels into the plug (arrows); EC, Endothelial cell. (ii) Quantification of CD31-expressing cells % area and (iii) vessels % area was assessed using CD31 immunostaining of plug sections. Results present mean ± SEM (n = 5 mice per treatment); **P = 0.0038, ****P < 0.0001. (C) WBC count test of blood collected on day 7 of the experiment shows no significant difference between SC treatments and vehicle control. %Neut, %Neutrophils; %Lymph, %Lymphocytes; %Mono, %Monocytes of total WBC. Results present mean ± SD (n = 4 mice per treatment); ns = not significant. One-way ANOVA with adjusted P value in multiple comparisons tests was used for all statistical analyses.

References

    1. Göpfrich K., Platzman I., Spatz J. P., Mastering complexity: Towards bottom-up construction of multifunctional eukaryotic synthetic cells. Trends Biotechnol. 36, 938–951 (2018). - PMC - PubMed
    1. Noireaux V., Libchaber A., A vesicle bioreactor as a step toward an artificial cell assembly. Proc. Natl. Acad. Sci. U.S.A. 101, 17669–17674 (2004). - PMC - PubMed
    1. Toparlak Ö. D., et al. , Artificial cells drive neural differentiation. Sci. Adv. 6, eabb4920 (2020). - PMC - PubMed
    1. Elani Y., Law R. V., Ces O., Protein synthesis in artificial cells: Using compartmentalisation for spatial organisation in vesicle bioreactors. Phys. Chem. Chem. Phys. 17, 15534–15537 (2015). - PubMed
    1. van Nies P., et al. , Self-replication of DNA by its encoded proteins in liposome-based synthetic cells. Nat. Commun. 9, 1583 (2018). - PMC - PubMed

Publication types

LinkOut - more resources