. 2022 Nov 2;10(11):1354-1369.
doi: 10.1158/2326-6066.CIR-21-1075.

Targeting Macrophages with CAR T Cells Delays Solid Tumor Progression and Enhances Antitumor Immunity

Affiliations

Targeting Macrophages with CAR T Cells Delays Solid Tumor Progression and Enhances Antitumor Immunity

Alfonso R Sánchez-Paulete et al. Cancer Immunol Res. .

Abstract

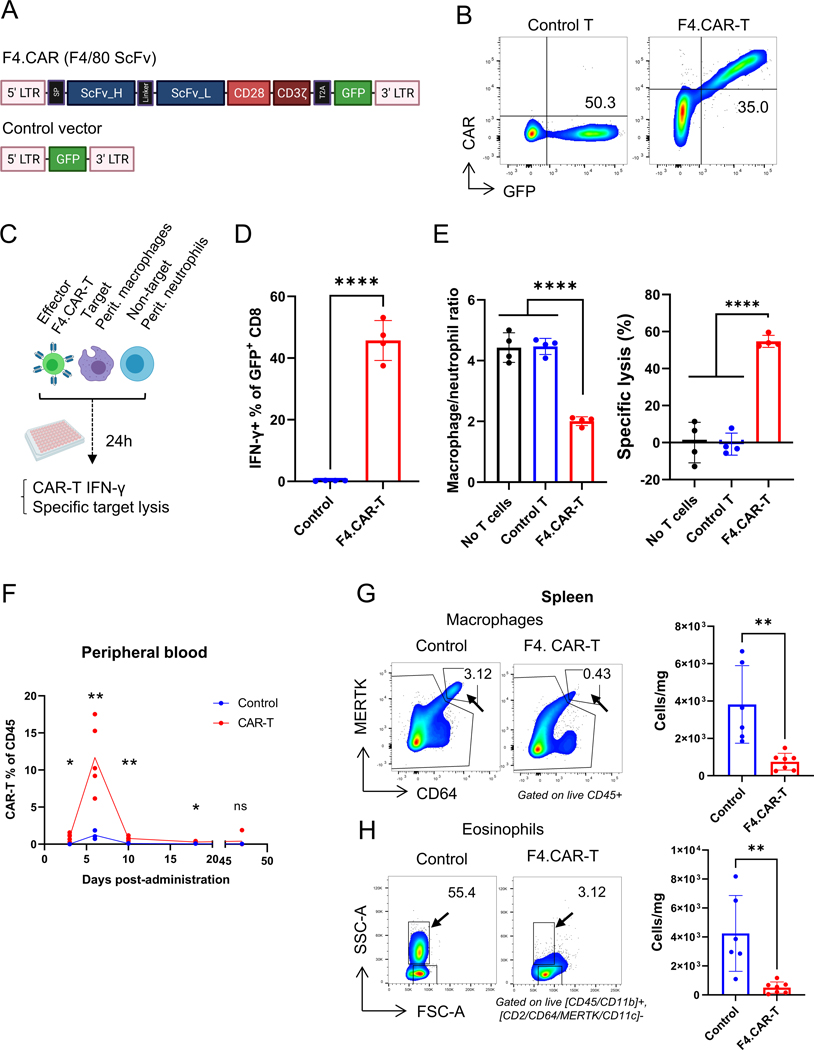
Tumor-associated macrophages (TAM) are one of the most abundant cell types in many solid tumors and typically exert protumor effects. This has led to an interest in macrophage-depleting agents for cancer therapy, but approaches developed to date have had limited success in clinical trials. Here, we report the development of a strategy for TAM depletion in mouse solid tumor models using chimeric antigen receptor (CAR) T cells targeting the macrophage marker F4/80 (F4.CAR-T). F4.CAR-T cells effectively killed macrophages in vitro and in vivo without toxicity. When injected into mice bearing orthotopic lung tumors, F4.CAR-T cells infiltrated tumor lesions and delayed tumor growth comparably with PD-1 blockade, and significantly extended mouse survival. Antitumor effects were mediated by F4.CAR-T-produced IFNγ, which promoted upregulation of MHC molecules on cancer cells and tumor-infiltrating myeloid cells. Notably, F4.CAR-T promoted expansion of endogenous CD8 T cells specific for tumor-associated antigen and led to immune editing of highly antigenic tumor cell clones. Antitumor impact was also observed in mouse models of ovarian and pancreatic cancer. These studies provide proof of principle to support CAR T-cell targeting of TAMs as a means to enhance antitumor immunity.


Conflict of interest statement

COMPETING INTERESTS

The authors declare no competing interests.

Figures

Figure 1.
Figure 1.. F4.CAR-T cells recognize and specifically lyse mouse macrophages.
(A) Schematic depicting the structure of the F4.CAR construct and control vector for T-cell transduction. (B) Representative flow cytometry plots showing expression of the CAR and GFP in control or transduced CD8 T cells. Shown are the percentages of transduced cells. (C-E) Ex vivo CAR T killing assay. Mice were i.p. injected with 1.5 ml 3% thioglycolate broth and peritoneal lavage obtained 72h later and cocultured with control or F4.CAR-T cells for 24h. (C) Schematic explaining the assay design. (D) Percentage of GFP+ T cells stained for intracellular IFN-γ at the end of the coculture. (E) The ratio of peritoneal macrophages to neutrophils in the presence of control or F4.CAR-T cells is shown on the left. On the right, specific lysis of macrophages was calculated using neutrophils as non-targeted cells. *p<0.05, **p<0.01, ***p<0.001, ****p p<0.0001 (t-student) (F) Percentage of CAR T cells among CD45+ peripheral blood cells over time after i.v. CAR T cell administration. (G,H) On the left, representative flow cytometry plots from spleens of control- and CAR T mice treated showing the macrophage (G) and eosinophil (H) populations. Numbers represent percentage of parent populations. On the right, quantification of macrophages (G) and eosinophils (H) per milligram of spleen. Complete gating strategies can be found in Supp. Fig. S2. SP: signal peptide; LTR: long terminal repeat; E:T: effector:target; i.v.: intravenous. *p<0.05, **p<0.01, ***p<0.001 (t-student)
Figure 2.
Figure 2.. F4.CAR-T cells successfully infiltrate HKP1 NSCLC tumors and eliminate tumor-associated macrophages.
HKP1 tumors were established and CAR T cells administered 7 (A, B, D, F) or 12 (C, E, G) days later. Lung samples were obtained 19 days after tumor inoculation and processed for flow cytometry or immunofluorescent tissue staining. (A) Representative confocal microscopy sample of macrophage infiltration in an HKP1 lung tumor. Dashed line demarcates the tumor lesion. Color coding is indicated at the bottom. (B) Representative flow cytometry plots of lung macrophages from healthy and HKP1-bearing lungs. Numbers denote percentage of macrophages contributed by each subpopulation. (C) Correlation between the number of monocyte-derived macrophages per lung and histological HKP1 tumor burden (calculated as described in Materials and Methods). (D) Confocal microscopy section of HKP1 lesions in a mouse lung. Right panel represents a zoom in of the area dotted in the left image. Dashed line demarcates the tumor lesion. Color coding is indicated at the bottom. (E) Immune cell populations in lungs of control and CART-treated mice. Complete gating strategies can be found in Supp. Fig. S2. Representative experiment of five is shown. (F) Representative regions within HKP1 tumors were defined and the number of macrophages in those regions calculated by F4/80 immunofluorescent staining using QuPath software. Left panel shows representative samples from control and CAR T-treated tumors, with dashed lines defining the studied regions. Right panel shows the quantification of macrophages per square mm within these regions. (G) Correlation between the number of CAR T cells per lung and histological HKP1 tumor burden. AM: alveolar macrophage; Mo-Mac: monocyte-derived macrophage; Eos: eosinophil; Inf mono: inflammatory monocyte; Pat mono: patrolling monocyte; Neut: neutrophil; cDC1/2: conventional dendritic cell type 1/2. *p<0.05, **p<0.01, ***p<0.001, ****p p<0.0001 (t-student)
Figure 3.
Figure 3.. F4/80 CAR T cells delay growth of HKP1 lung tumors and extend the survival of tumor-bearing mice.
HKP1 tumors were established and CAR T cells administered according to the treatment schematic on each panel. (A) Bioluminiscence readings from the thoracic area (red square on the images) were taken at the time points indicated. Right panel shows representative IVIS images from control and CAR T-treated mice and color scale for radiance. Left bottom panel shows quantification of luciferase radiance signal from control and CAR T-treated mice. A representative experiment of three performed is shown. (B) Mice were euthanized at the indicated time point and lungs processed for H&E staining. Left panel shows representative sections from control or F4.CAR-T treated mice. A representative experiment of >5 performed is shown. (C) HKP1-bearing mice were followed for survival after CAR T treatment. A pool of three experiments with similar findings is shown. (D) HKP1 tumors were established, and CAR T cells administered according to the treatment schematic. Mice were euthanized at the indicated time point and lungs processed for H&E staining. Left panels show representative sections from control or F4.CAR-T treated mice. *p<0.05, **p<0.01, ***p<0.001
Figure 4.
Figure 4.. F4.CAR-T cells promote tumor immune editing and expansion of tumor-antigen specific T cells
(A-D) HKP1 tumors were established and CAR T cells administered 12 days afterwards. At day 19, lung samples were processed for confocal microscopy or flow cytometry. (A) Shown is tdTomato detection in representative HKP1 tumors from control or CAR T-treated mice by confocal microscopy. (B) Flow cytometry was used to quantify tdTomato MFI in HKP1 cells from control and CAR T-treated mice. Results are representative from >5 experiments performed. (C) Correlation of HKP1 tdTomato MFI with histological tumor burden. (D) Left shows representative dot plots of HKP1 cells from control and CART-treated mice showing tdTomato vs MHC-I or MHC-II detection. Right graphs show the correlation between tdTomato and MHC-I or MHC-II MFI from HKP1 cells in control and CAR T-treated mice. (E) HKP1 tumors were established and CAR T cells administered 7 days afterwards. At day 19, lung single-cell suspensions were stained with H2Db-LMYRFEEEL tetramers as detailed in Materials and Methods. Left panels show representative dot plots for tetramer staining and percentage of positive cells within the endogenous CD8 T-cell population. Right panel shows percentages of tetramer+ CD8 T cells across samples. One experiment representative of three performed. (F) HKP1 tumors were established and treated with F4.CAR-T cells and/or anti-PD-1. (G) Histological tumor burden in control and treated mice. One experiment representative of three performed. (H) tdTomato MFI in HKP1 tumor cells in control and treated mice, calculated by flow cytometry. *p<0.05, **p<0.01, ***p<0.001, ****p p<0.0001 (t-student)
Figure 5.
Figure 5.. IFN-𝛾 production by F4/80 CAR T cells reprograms the HKP1 tumor microenvironment and is necessary for their antitumor effect.
(A) Left shows experiment schematic. Right cartoon depicts F4.CAR-T generation from Ifng−/− or WT mice. (B) Lungs were obtained and processed for histological analysis. Shown left are representative samples of H&E stainings from the indicated groups. On the right is shown the quantification of tumor burden across all mice, with X datapoint symbols indicating mice that died before the designed time of sacrifice. Columns represent median values. Mann-Whitney ranked analysis was used for statistics. (C,D) Shown are the mean fluorescent intensities for the indicated elements on HKP1 tumor cells in control and treated mice. *p<0.05, **p<0.01, ***p<0.001, ****p p<0.0001
Figure 6.
Figure 6.. F4/80 CAR T cells delay growth of ID8 ovarian and KPC pancreatic tumors
(A-C) ID8_VEGF tumors were established by i.p. injection of 106 cells. 5×10⁶ F4.CAR-T cells were injected i.v. on day 14. Shown is one experiment, representative of two performed. (A) Experiment schematic. Mouse weight was obtained and mice monitored for development of ascites biweekly. (B) Change in body weight in control and CAR T-treated mice, normalized to the time of treatment (day 14). (C) Representative examples of tumor-induced ascites at day 24 post-tumor inoculation. (D-G) KPC tumors were established by surgical injection of 5×10⁴ cells into the pancreas. 5×10⁶ F4.CAR-T cells were injected i.v. 7 days later. Mice were sacrificed on day 14 and pancreas tumors processed for flow cytometry. Results from two pooled experiments are shown for (E,F,H) (D) Experiment schematic. Shown are two pooled experiments (E,F,H). (E) Number of F4.CAR-T cells per mg of tissue in primary pancreas tumors. (F) The number of cells per mg of tumor from two pooled experiments was normalized to the control average for each experiment. Shown are normalized macrophages and eosinophils in control and F4.CAR-T treated mice. (G) MFI for MHC-I and PD-L1 on KPC tumor cells. KPC cells were defined as DAPI/CD45-, FSC/SSChi, analogously to the strategy defined for HKP1 in Supp. Fig. S1. (H) Mass of primary pancreas tumors at day 14. *p<0.05, **p<0.01, ***p<0.001, ****p p<0.0001

References

    1. Hegde PS, Chen DS. Top 10 Challenges in Cancer Immunotherapy. Immunity. 2020;52:17–35. - PubMed
    1. Mantovani A, Marchesi F, Malesci A, Laghi L, Allavena P. Tumour-associated macrophages as treatment targets in oncology. Nature Reviews Clinical Oncology. Nature Publishing Group; 2017;14:399–416. - PMC - PubMed
    1. Binnewies M, Roberts EW, Kersten K, Chan V, Fearon DF, Merad M, et al. Understanding the tumor immune microenvironment (TIME) for effective therapy. Nature Medicine. Springer US; 2018;24:541–50. - PMC - PubMed
    1. Noy R, Pollard JW. Tumor-Associated Macrophages: From Mechanisms to Therapy. Immunity. Elsevier Inc.; 2014;41:49–61. - PMC - PubMed
    1. DeNardo DG, Ruffell B. Macrophages as regulators of tumour immunity and immunotherapy. Nature Reviews Immunology. Springer US; 2019;19:369–82. - PMC - PubMed

Publication types

Substances