. 2022 Sep;10(9):e004859.
doi: 10.1136/jitc-2022-004859.

BND-22, a first-in-class humanized ILT2-blocking antibody, promotes antitumor immunity and tumor regression

Affiliations

BND-22, a first-in-class humanized ILT2-blocking antibody, promotes antitumor immunity and tumor regression

Ilana Mandel et al. J Immunother Cancer. 2022 Sep.

Abstract

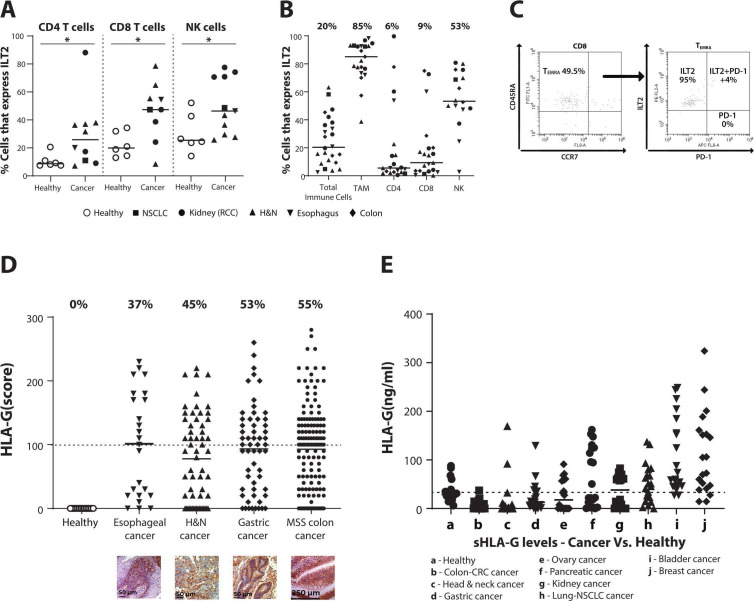
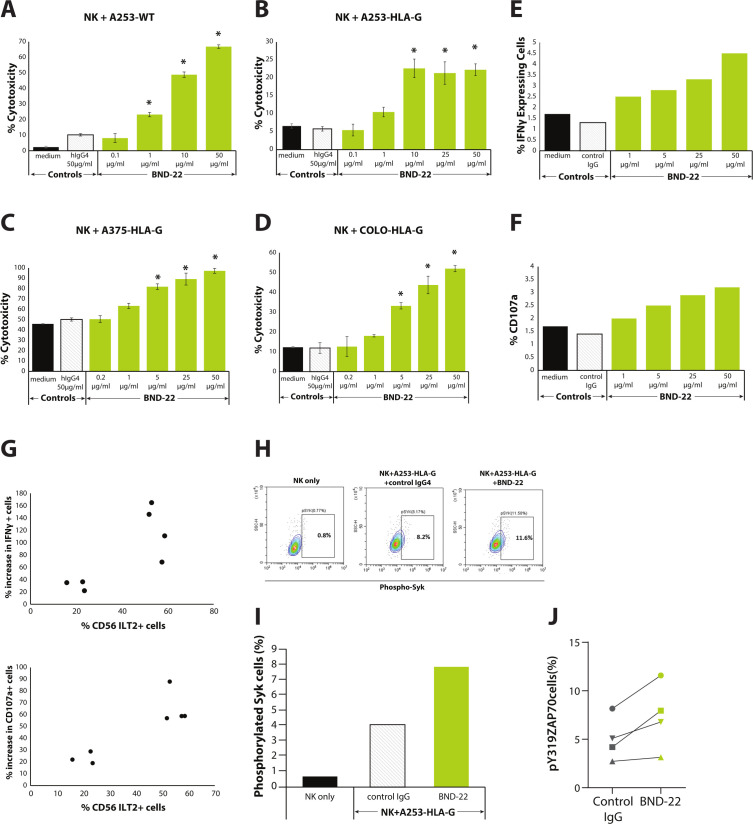
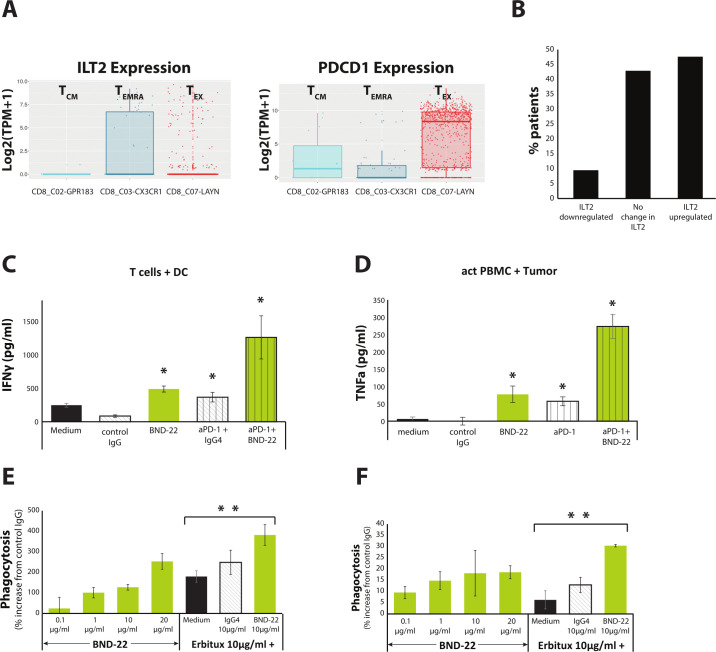
Background: Cancer immunotherapy has revolutionized cancer treatment. However, considering the limited success of immunotherapy to only some cancer types and patient cohorts, there is an unmet need for developing new treatments that will result in higher response rates in patients with cancer. Immunoglobulin-like transcript 2 (ILT2), a LILRB family member, is an inhibitory receptor expressed on a variety of immune cells including T cells, natural killer (NK) cells and different myeloid cells. In the tumor microenvironment, binding of class I MHC (in particular HLA-G) to ILT2 on immune cells mediates a strong inhibitory effect, which manifests in inhibition of antitumor cytotoxicity of T and NK cells, and prevention of phagocytosis of the tumor cells by macrophages.

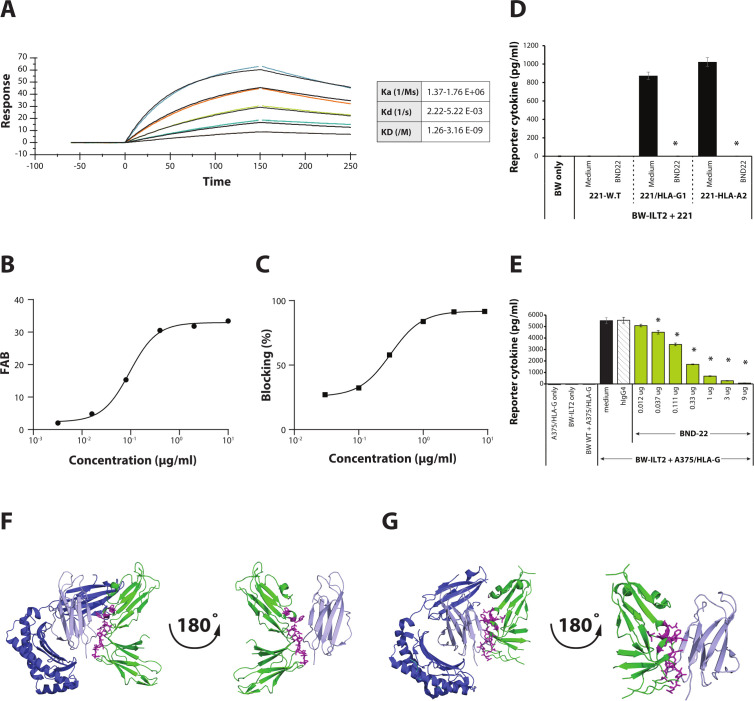
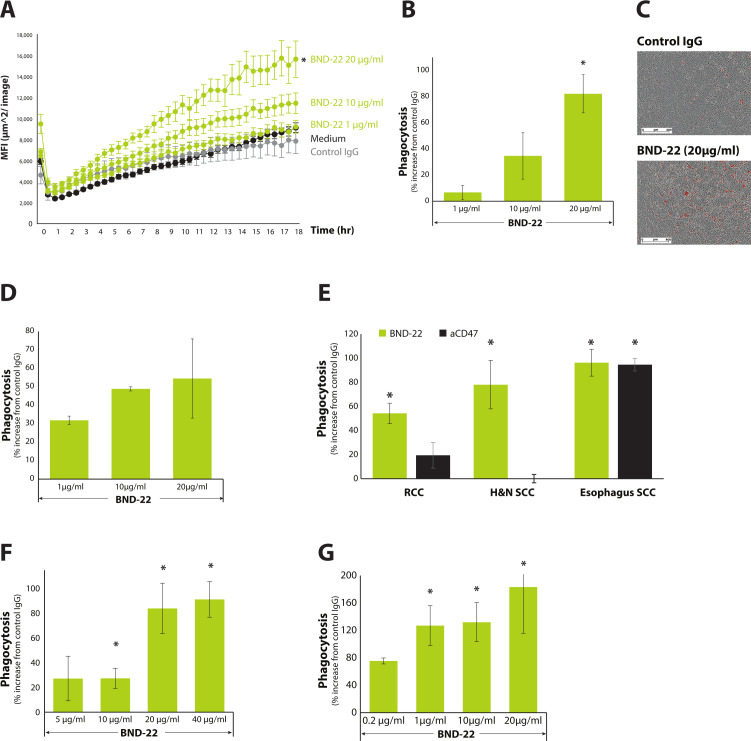
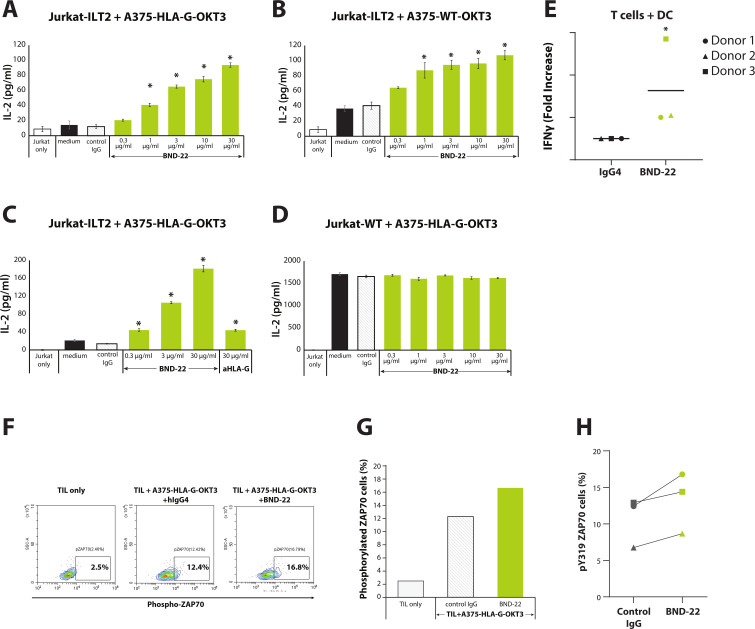
Methods: We describe here the development and characteristics of BND-22, a novel, humanized monoclonal antibody that selectively binds to ILT2 and blocks its interaction with classical MHC I and HLA-G. BND-22 was evaluated for its binding and blocking characteristics as well as its ability to increase the antitumor activity of macrophages, T cells and NK cells in various in vitro, ex vivo and in vivo systems.

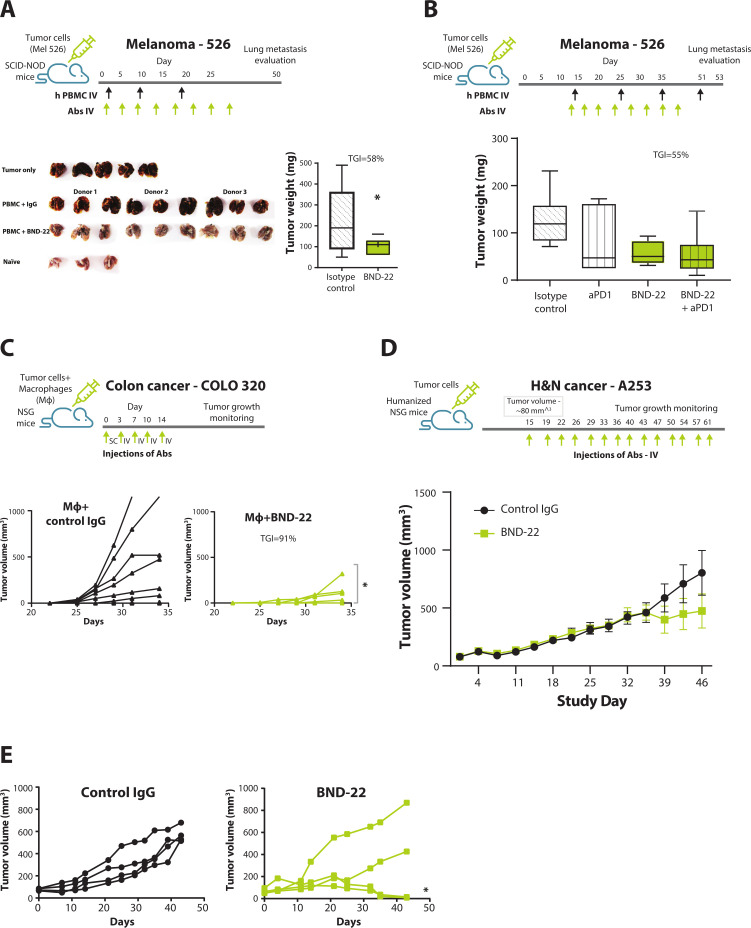
Results: Collectively, our data suggest that BND-22 enhances activity of both innate and adaptive immune cells, thus generating robust and comprehensive antitumor immunity. In humanized mice models, blocking ILT2 with BND-22 decreased the growth of human tumors, hindered metastatic spread to the lungs, and prolonged survival of the tumor-bearing mice. In addition, BND-22 improved the antitumor immune response of approved therapies such as anti-PD-1 or anti-EGFR antibodies.

Conclusions: BND-22 is a first-in-human ILT2 blocking antibody which has demonstrated efficient antitumor activity in various preclinical models as well as a favorable safety profile. Clinical evaluation of BND-22 as a monotherapy or in combination with other therapeutics is under way in patients with cancer.

Trial registration number: NCT04717375.

Keywords: Immunotherapy; Lymphocyte Activation; Macrophages; Translational Medical Research; Tumor Escape.


Conflict of interest statement

Competing interests: None declared.

Figures

Figure 1
Figure 1
ILT2 and HLA-G are highly expressed in the TME and the periphery of patients with cancer. (A) PBMCs were isolated from the blood of the indicated patients with cancer or from healthy donors. The percentage of ILT2-expressing NK cells, CD8 and CD4 T cells was evaluated by flow cytometry. *P<0.05; Unpaired Student’s t-test. (B) Single-cell suspensions were prepared by enzymatic digestion of fresh tumors isolated surgically from patients with various cancer indications. The percentage of ILT2 expression in total intratumoral immune cells, TAMs, CD8, CD4 T cells and NK cells was evaluated by flow cytometry as mentioned in the online supplemental material. The median percentage of ILT2-positive cells for each immune cell population is indicated. (C) Dot plots representative from evaluation of the levels of CD8 TEMRA cells (left) and ILT2 and PD-1 expression in intratumoral CD8 TEMRA cells (right) from an esophageal cancer patient. (D) Tissue microarrays from the indicated cancer types were stained with anti-HLA-G antibody for IHC. The percentages in the graph indicate patients with cancer samples that had a higher staining score (above 100). (E) Soluble HLA-G protein was evaluated in plasma samples collected from patients with cancer (n=20, each group) by ELISA. *P<0.05. H&N, head and neck; IHC, immunohistochemistry; ILT2, immunoglobulin-like transcript 2; MSS, microsatellite stable; NK, natural killer; NSCLC, non–small cell lung cancer; PD-1, programmed cell death protein-1; RCC, renal cell carcinoma; TAM, tumor-associated macrophage. TEMRA cells, effector memory T cells re-expressing CD45RA.
Figure 2
Figure 2
BND-22 selectively binds to ILT2 and blocks its interaction with HLA-G and HLA-A2 by blocking ILT2 binding to the B2M-binding region. (A) The binding of BND-22 to human ILT2 as determined by multicycle analysis using the Biacore T200. Sensograms and fitted curves (1:1 binding model) are displayed as well as the summary of the kinetic parameters. Recombinant human ILT2 in six points in the range of 25–0.78 nM in twofold dilutions, represented by the different colors in the sensogram, was added to the system. (B) The binding of BND-22 to BW cells transfected with ILT2 as evaluated by flow cytometry. (C) A375-HLA-G cells were incubated with biotinylated ILT2-FC in the presence of various concentrations of BND-22 followed by staining with streptavidin–PE and FACS analysis. A graphical representation of the percentage of blocking compared with cells without antibody is shown. BW WT cells or BW cells transfected with ILT2-zeta (BW-ILT2) were incubated with 721.221 wildtype cells (221 W.T), or 721.221 transfected to express (221-HLA-G) or HLA-A2 (221-HLA-A2) (D) or with A375-HLA-G cells (E) in in the presence of various concentrations of BND-22, control IgG or PBS for 48 hours. The secretion of a reporter mouse cytokine was measured by ELISA. *P<0.05, unpaired Student’s t-test. Three-dimensional ribbon or surface diagrams of ILT2 showing the epitope of BND-22 (pink) and its interaction on ILT2 with B2M (lilac) in complex with (F) HLA-A or (G) HLA-G. B2M, beta-2-microglobulin; BW ILT2, BW cells transfected with ILT2-zeta; BW WT, BW wild type; FAB, fold above (isotype control) background; ILT2, immunoglobulin-like transcript 2; Ka, association rate constant (1/Ms); Kd, dissociation rate constant (1/s); KD, equilibrium dissociation constant (kd/ka).
Figure 3
Figure 3
BND-22 enhances the phagocytosis of cancer cells by macrophages. A375-HLA-G cells were stained with pHrodo red cell labeling dye and added to monocyte-derived macrophages generated from healthy donors, along with the various indicated treatments in triplicates. (A) A representative kinetic quantification of phagocytosis is presented in a time-course of 18 hours as analyzed using Incucyte S3.(B) A single representative time point of the experiment at 12.5 hours is presented. Percent increase in macrophage-mediated phagocytosis with respect to control IgG (20 µg/mL) is presented. (C) Images of cells incubated in the presence of control IgG or BND-22 are presented. The red signals captured represent phagocytosis events. (D) Phagocytosis of A375 wild-type cells by macrophages. Single-cell suspensions were generated by enzymatic digestion of fresh tumors surgically isolated from patients with cancer (indicated in E, F), patients with RCC, and (G) patients with H&N cancer. The cells were stained with pHrodo red cell labeling dye and mixed with monocyte-derived macrophages generated from healthy donors or (E) from autologous patients (F, G), along with the various indicated treatment doses in triplicates. The percent increase in macrophage-mediated phagocytosis of tumor cells compared with control IgG is presented. MFI - mean fluorescence intensity. *P<0.05; unpaired Student’s t-test compared with cells with control IgG. H&N, head and neck; RCC, renal cell carcinoma.
Figure 4
Figure 4
BND-22 enhances T-cell activity against cancer cells. Jurkat cells transfected with ILT2 (Jurkat-ILT2, A–C) or wild-type Jurkat cells (Jurkat-WT, D) were incubated with mitomycin-treated OKT3-expressing A375 cells that were either MHC class I positive (A375-WT-OKT3, B) or HLA-G positive (A, C, D) in the presence of BND-22 control IgG or a HLA-G-specific blocking antibody. The amount of secreted human IL-2 was evaluated by ELISA kits following 48 hours. *P<0.001, one-way analysis of variance followed by Dunnett’s multiple comparisons test compared with control IgG. (E) DCs generated from monocytes and CD8 T cells (T cells) were isolated from healthy human donors. The cells were combined in an E:T of 5:1 together with the indicated treatments followed by detection of IFN-γ secretion on day 5 Representative results are shown. The mean±SE of values from three repeats per treatment is displayed. TILs were coincubated with A375-HLA-G-OKT3 cells for 5 min and immediately placed in 2% Paraformaldehyde (PFA) on ice followed by detection of phosphorylated ZAP70/Syk by flow cytometry. (F) Representative FACS analysis of the levels of phosphorylated ZAP70 in the indicated conditions. The cells were gated on ILT2+CD8 T cells. (G) A graphical representation of the results shown in F. (H) A summary of three experiments performed in similar conditions. DC, dendritic cell; E:T, effector-to-target ratio; IFN-γ, interferon gamma; IL, interleukin; TIL, tumor-infiltrating lymphocyte.
Figure 5
Figure 5
BND-22 enhances NK-cell activity against cancer cells. NK cells were incubated with the indicated concentrations of BND-22 or a control IgG; Target cells including A253-WT (A), A253-HLA-G (B), A375-HLA-G (C) and COLO 320-HLA-G (D) were added for an additional 5 hours at an E:T of 7.5:1. Representative results are shown. Results represent an average of % cytotoxicity±SE determined by LDH release assay in triplicates. WT cells express MHC-I; HLA-G transfected cells express both MHC-I and HLA-G. *p<0.02, One-way analysis of variance followed by Dunnett’s multiple comparisons test compared with NK+target cells+control IgG. NK cells isolated from healthy donors were incubated with the indicated concentrations of BND-22 or a control IgG. A375-HLA-G cells were added for additional 5 hours at E:T of 8:1 followed by staining for intracellular IFN-γ, membranal CD107a, ILT2 and CD56 and analysis by flow cytometry. (E) The percentage of IFN-γ-positive NK cells in the CD56+ILT2+ population. (F) The percentage of CD107a-positive NK cells in the CD56+ILT2+ population. (G) Correlation between percentage of CD56+ILT2+ cells in the isolated NK cells and percent increase in IFN-γ (top) or CD107a (bottom) in the presence of A375-HLA-G and BND-22 (50 µg/mL) is presented for seven different donors tested. NK cell lines were cocultured with A253-HLA-G cells for a minute followed by immediately fixing in 4% PFA on ice and ZAP70/Syk phosphorylation was examined by flow cytometry. (H) Representative FACS plots showing phosphorylated SyK in the indicated conditions. (I) A graphical representation of the results shown in H. (J) A summary of four experiments performed in similar conditions. IFN-γ, interferon gamma; ILT2, NK, natural killer; WT, wild type.
Figure 6
Figure 6
BND-22 enhances anti-tumor functions of anti-PD-1 or tumor targeting antibodies. (A) Analysis of ILT2 and PD-1 expression in intratumoral CD8 T cells from patients with CRC documented in http://crctcell.cancer-pku.cn/. (B) A bioinformatic analysis of ILT2 expression in melanoma patients treated with Nivolumab from. The RNAseq data was used to calculate expression changes in patients with cancer post versus pre-Nivolumab treatment. Log2 ILT2 fold-change differences above 0.5 or below 0.5 were considered as increase and decrease in expression, respectively. (C) DCs were generated from monocytes and CD8 T cells were isolated from PBMCs of healthy human donors. The cells were combined in E:T of 5:1 ratio with the indicated treatments and IFN-γ was measured in culture supernatants at day 5. (D) Single-cell suspensions were prepared by enzymatic digestion of a fresh tumor isolated from a patient with colon cancer. PBMCs were isolated from the same patient and cocultured with the indicated treatments in presence of IL-2. TNFα secretion was detected by ELISA. Representative results are shown. The mean±SE of values from three repeats per treatment are displayed. Unpaired Student’s t-test compared with control IgG for BND-22 or anti-PD-1, compared with anti-PD-1+IgG for anti-PD-1+BND-22.*P<0.05; (E) 786-O cells, or (F) A253-HLA-G cells were stained with pHrodo red cell labeling dye, washed and added to macrophages generated from monocytes isolated from healthy donors, along with the various treatments in triplicates. A single representative time point of the experiment at 9.5 hours is presented. The percentage of increase in phagocytosis compared with control IgG is presented. Unpaired Student’s t-test compared with erbitux+medium. **P<0.01. CRC, colorectal cancer; DC, dendritic cell; IFN-γ, interferon gamma; ILT2, immunoglobulin-like transcript 2; PD-1, programmed cell death protein-1; TCM, central memory T cells; TEMRA, T cells re-expressing CD45RA; TEX, exhausted T cells.
Figure 7
Figure 7
BND-22 inhibits tumor growth in vivo. (A, B) SCID-NOD mice were engrafted with MEL526-HLA-G cells intravenously. Human PBMCs isolated from healthy donors were transferred to the relevant groups together with IL-2 followed by antibody treatments (10 mg/kg each) starting from day 1 (A) or day 14 (B) according to the treatment schedules as indicated in the Materials And Methods section. At the endpoint, the mice were sacrificed; the lungs were weighted; and images were captured. Images showing the lung lesions developed by melanoma cells in the mice lungs from groups are presented (B). Tumor weight was calculated by subtracting naïve mouse lung weight from the lung weight of the experimental mouse. The median value from each group is presented in the graph as a vertical line (A, B). (C) NSG mice were engrafted SC with COLO-320 cells and human macrophages differentiated from monocytes isolated from healthy donors. The animals were treated with BND-22 or with control IgG (20 mg/kg) according to the treatment schedule outlined in the illustration. The data are presented as tumor growth curves from individual mice. Unpaired t-test was used to calculate statistical significance of TGI between the groups (A), One-way ANOVA followed by Dunnett’s multiple comparisons was used (B). A two-way repeated measures ANOVA was used (C, E). Human CD34+cell-engrafted mice were inoculated with A253-HLA-G cells. The mice were treated at indicated treatment schedule with BND-22 or a control IgG (10 mg/kg) when tumors reached 80 mm3. (D) Mean of tumor growth in mice that received CD34+ cells from all three donors and were treated with either BND-22 or control IgG4. (E) Tumor growth in mice inoculated with CD34+ cells from one of the donors treated with either BND-22 or control IgG4. *P<0.05. ANOVA, analysis of variance; IL, interleukin; TGI, tumor growth inhibition.

References

    1. Shiroishi M, Kuroki K, Rasubala L, et al. . Structural basis for recognition of the nonclassical MHC molecule HLA-G by the leukocyte Ig-like receptor B2 (LILRB2/LIR2/ILT4/CD85d). Proc Natl Acad Sci U S A 2006;103:16412–7. 10.1073/pnas.0605228103 - DOI - PMC - PubMed
    1. Jenkins RW, Barbie DA, Flaherty KT. Mechanisms of resistance to immune checkpoint inhibitors. Br J Cancer 2018;118:9–16. 10.1038/bjc.2017.434 - DOI - PMC - PubMed
    1. Engblom C, Pfirschke C, Pittet MJ. The role of myeloid cells in cancer therapies. Nat Rev Cancer 2016;16:447–62. 10.1038/nrc.2016.54 - DOI - PubMed
    1. Demaria O, Cornen S, Daëron M, et al. . Harnessing innate immunity in cancer therapy. Nature 2019;574:45–56. 10.1038/s41586-019-1593-5 - DOI - PubMed
    1. Kang X, Kim J, Deng M, et al. . Inhibitory leukocyte immunoglobulin-like receptors: immune checkpoint proteins and tumor sustaining factors. Cell Cycle 2016;15:25–40. 10.1080/15384101.2015.1121324 - DOI - PMC - PubMed

Publication types

Associated data