. 2022 Oct 5;42(40):7648-7658.
doi: 10.1523/JNEUROSCI.2223-21.2022. Epub 2022 Sep 12.

Effort Reinforces Learning

Affiliations

Effort Reinforces Learning

Huw Jarvis et al. J Neurosci. .

Abstract

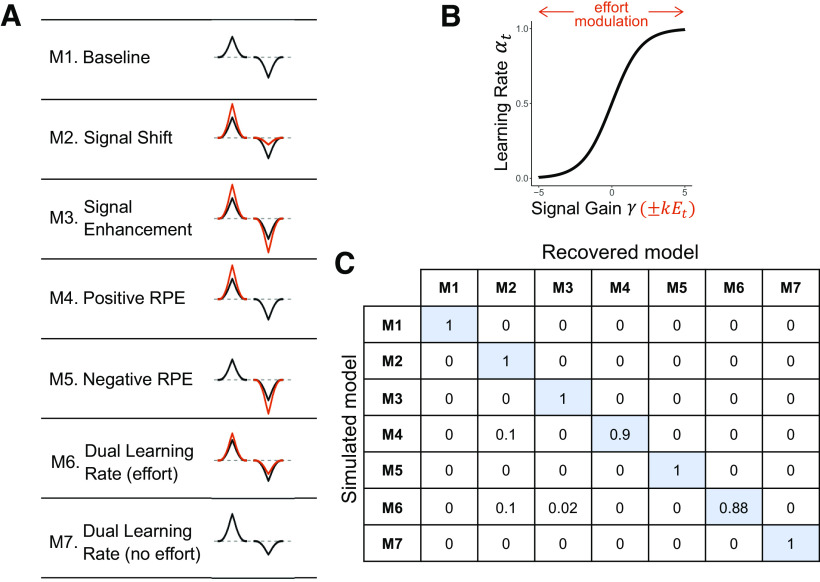
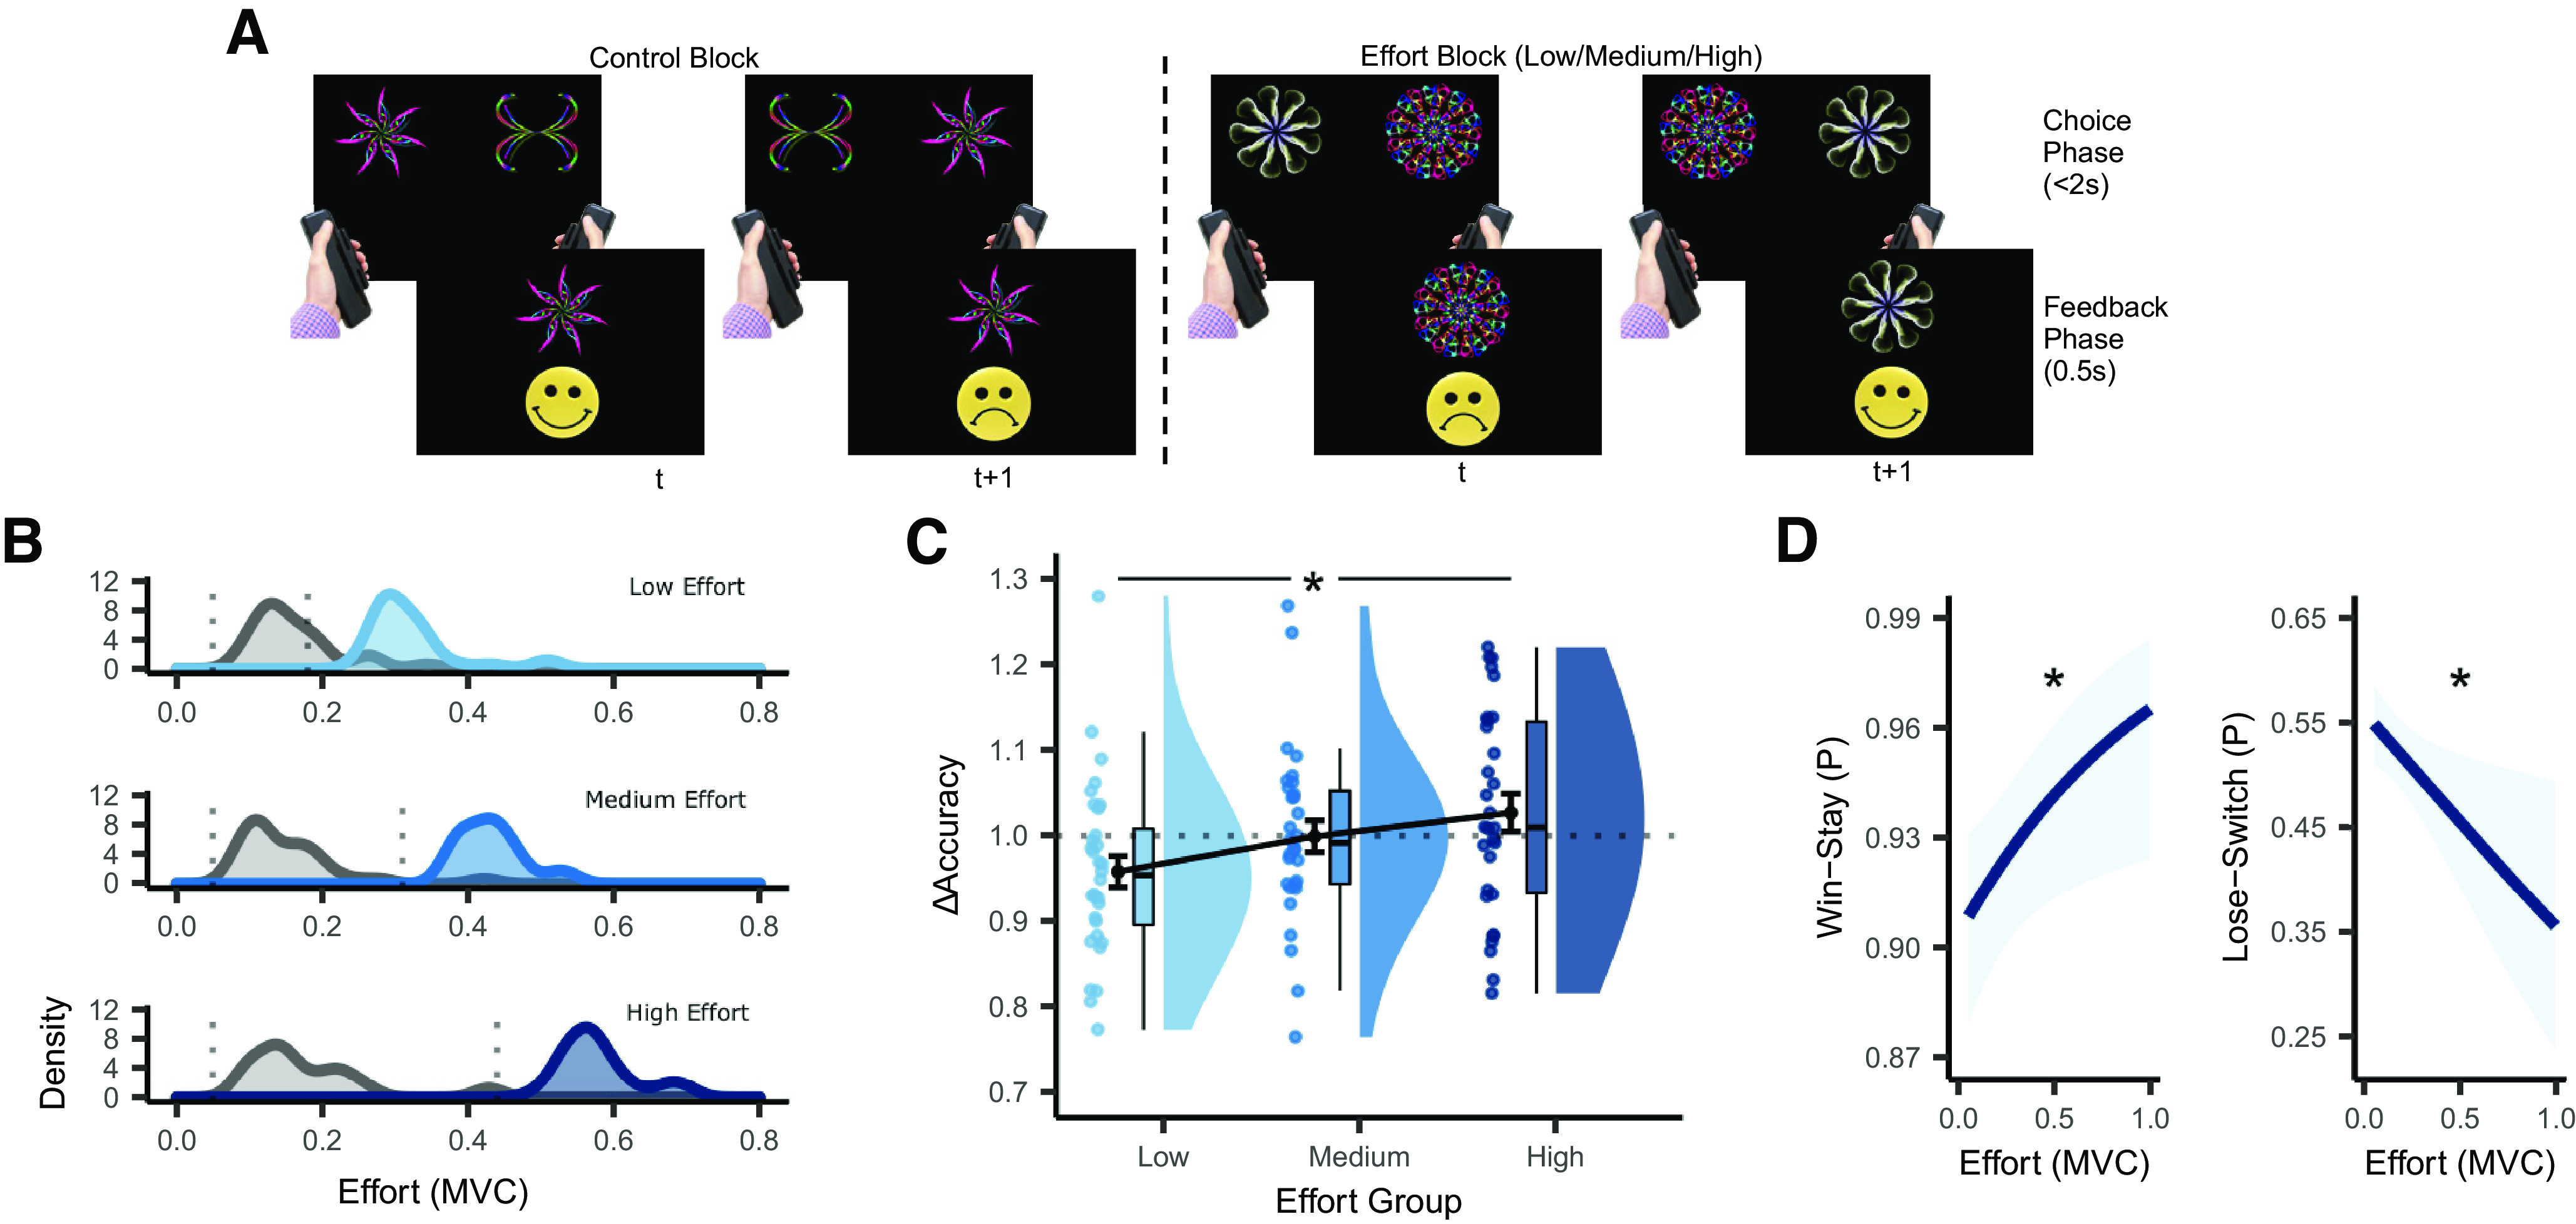
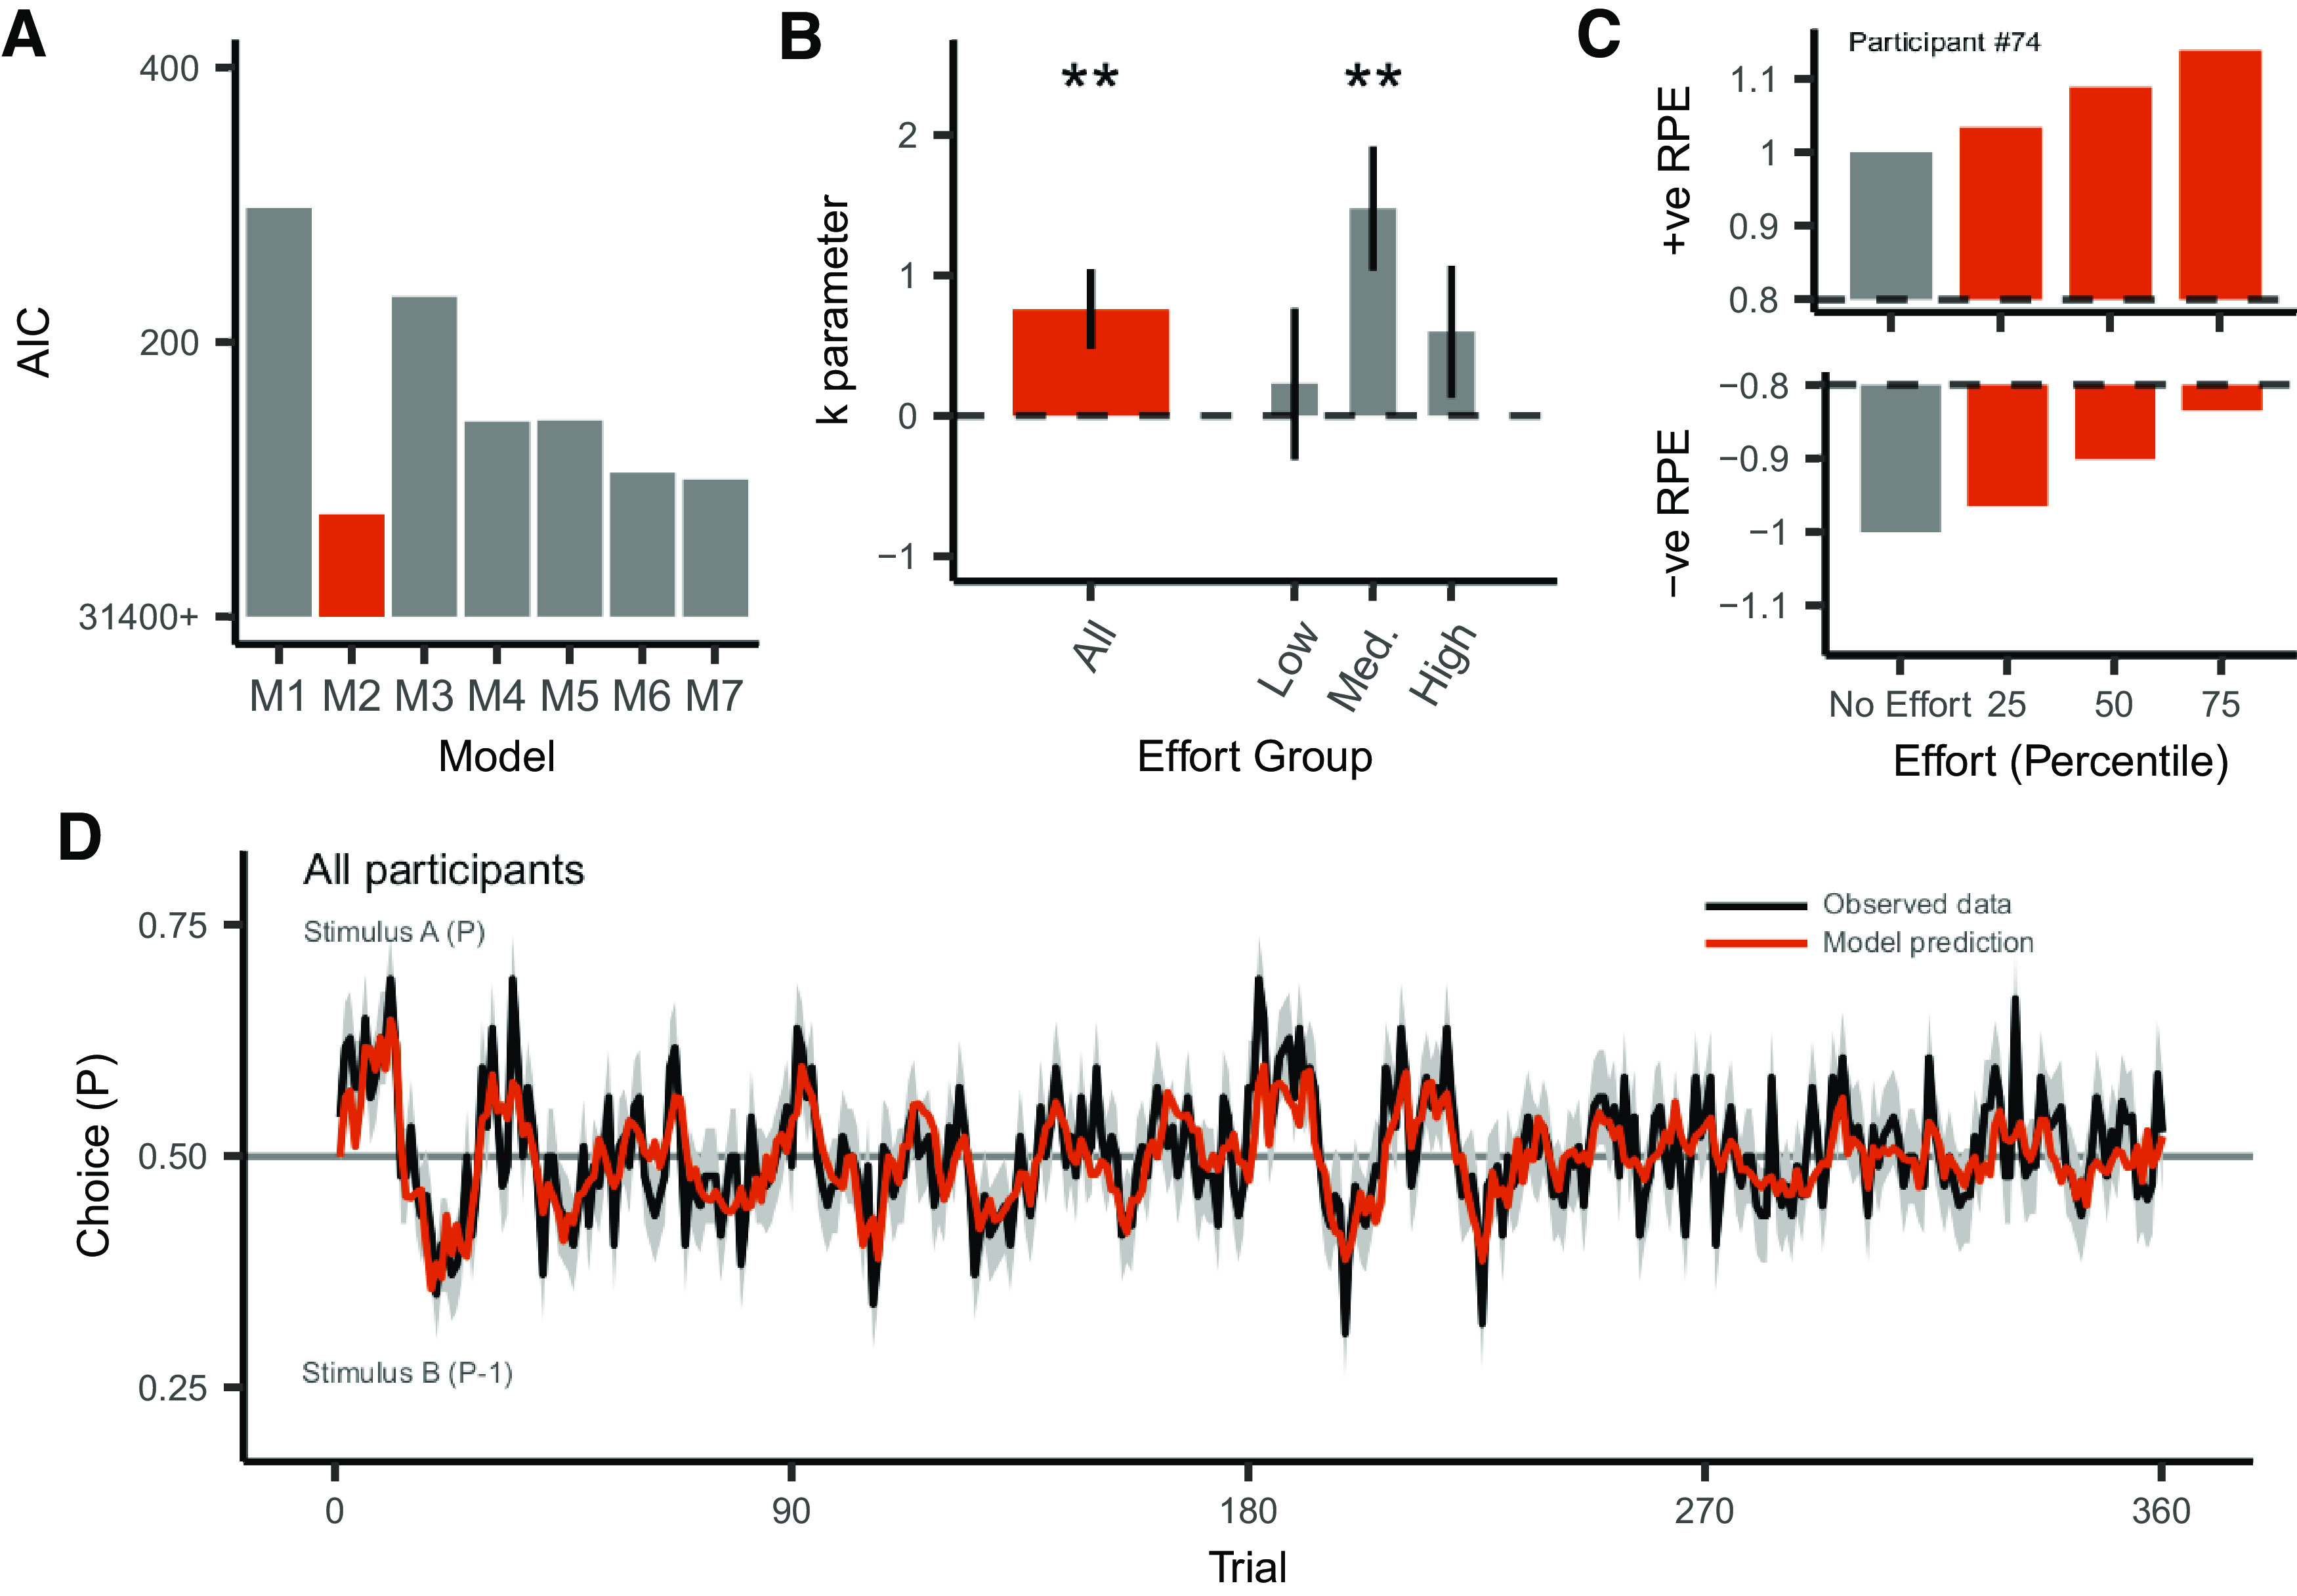
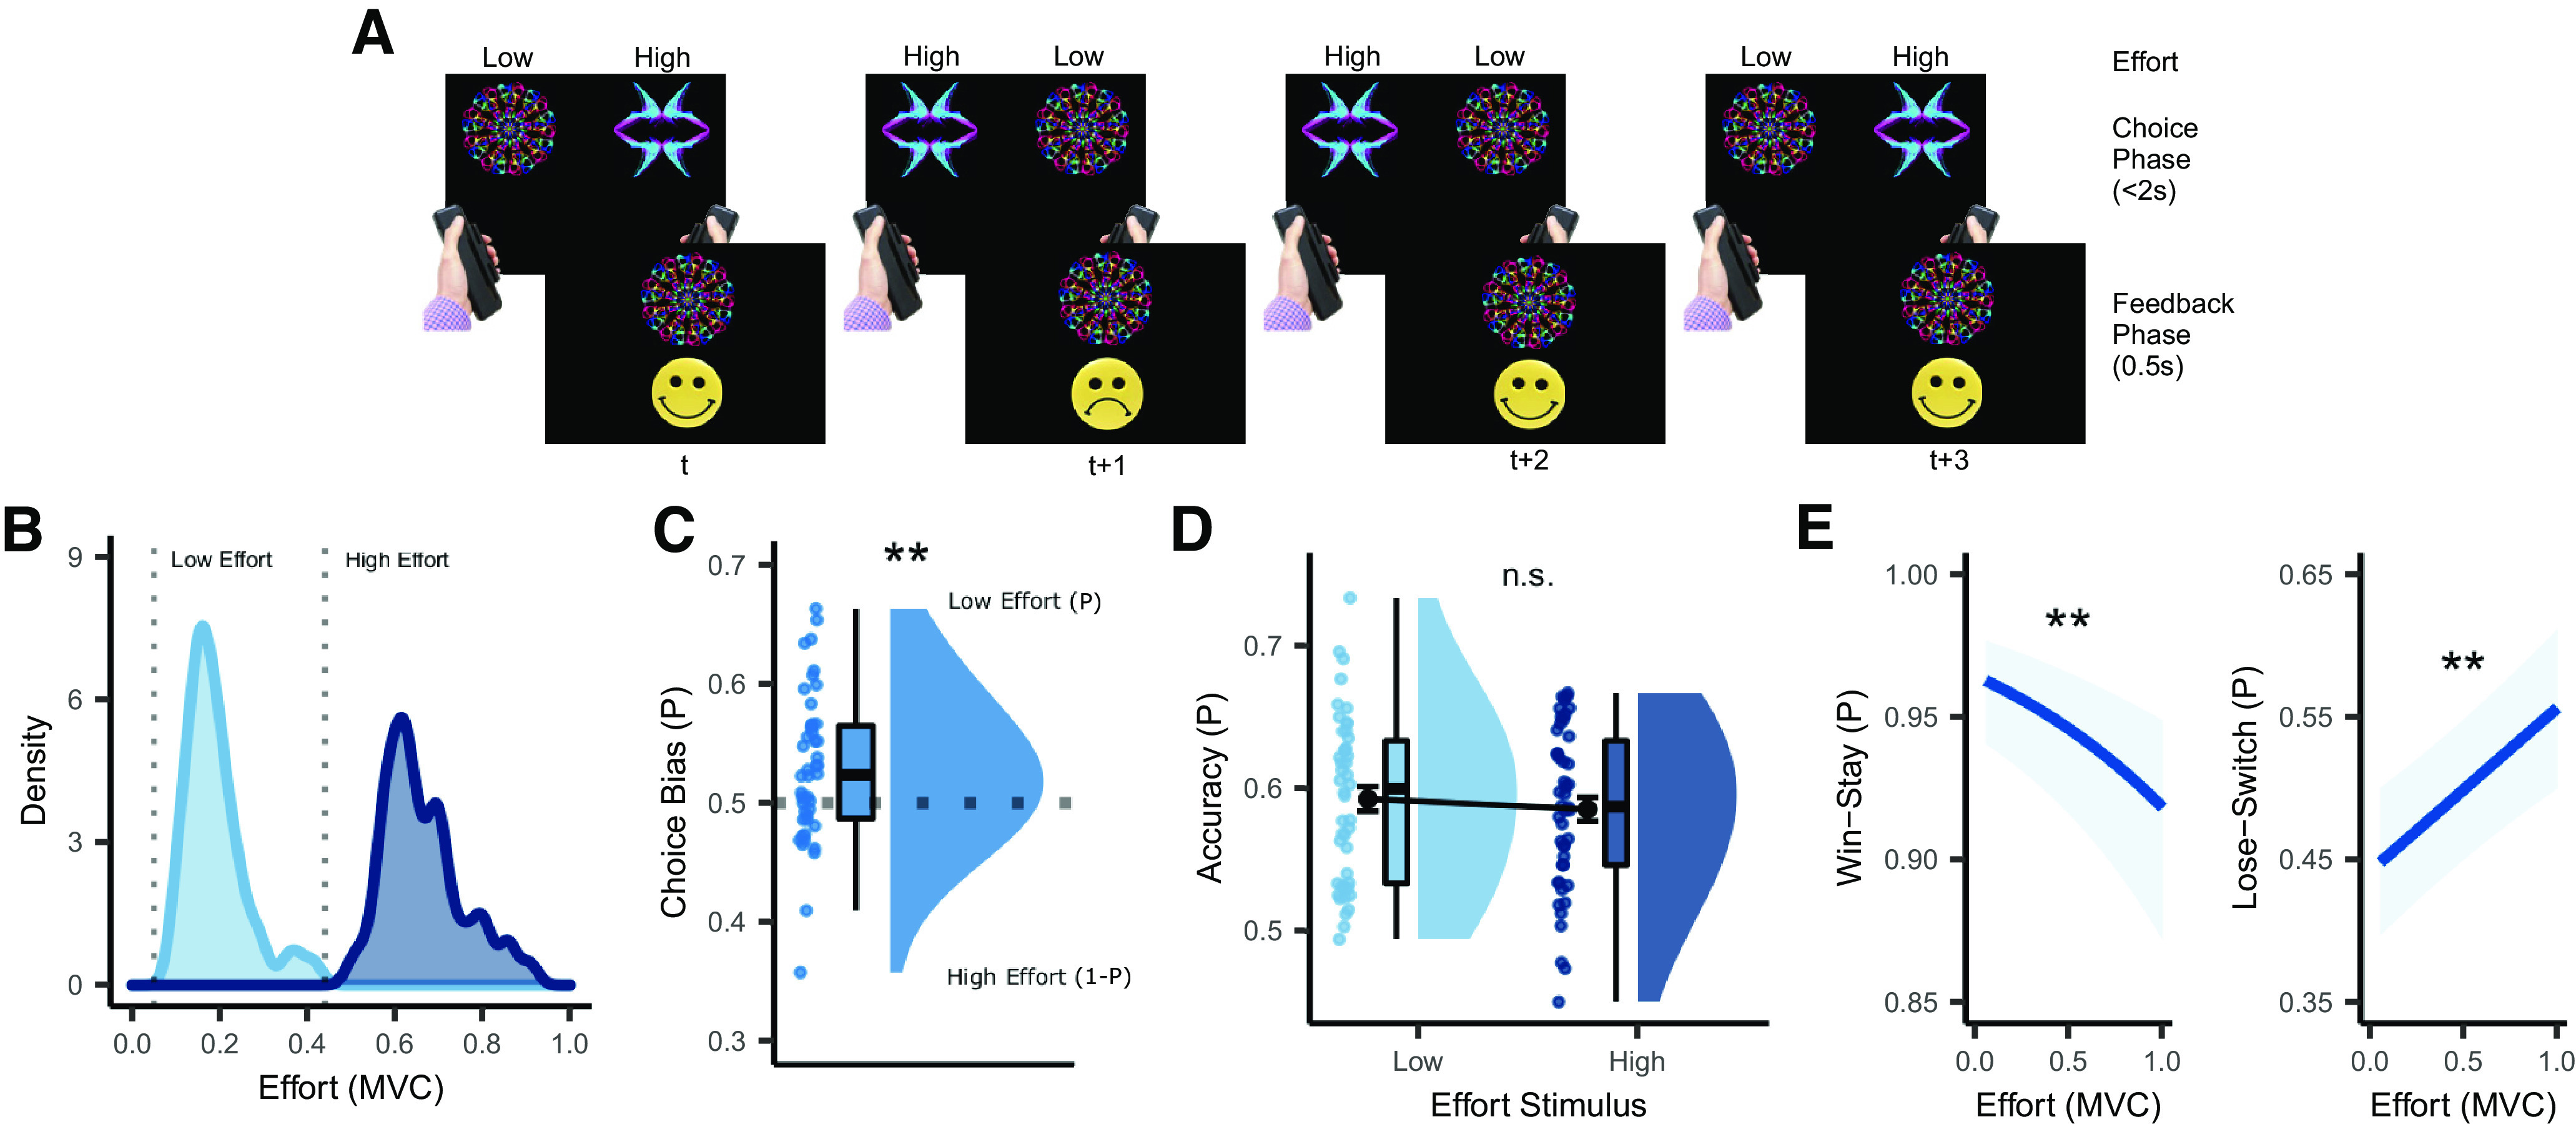
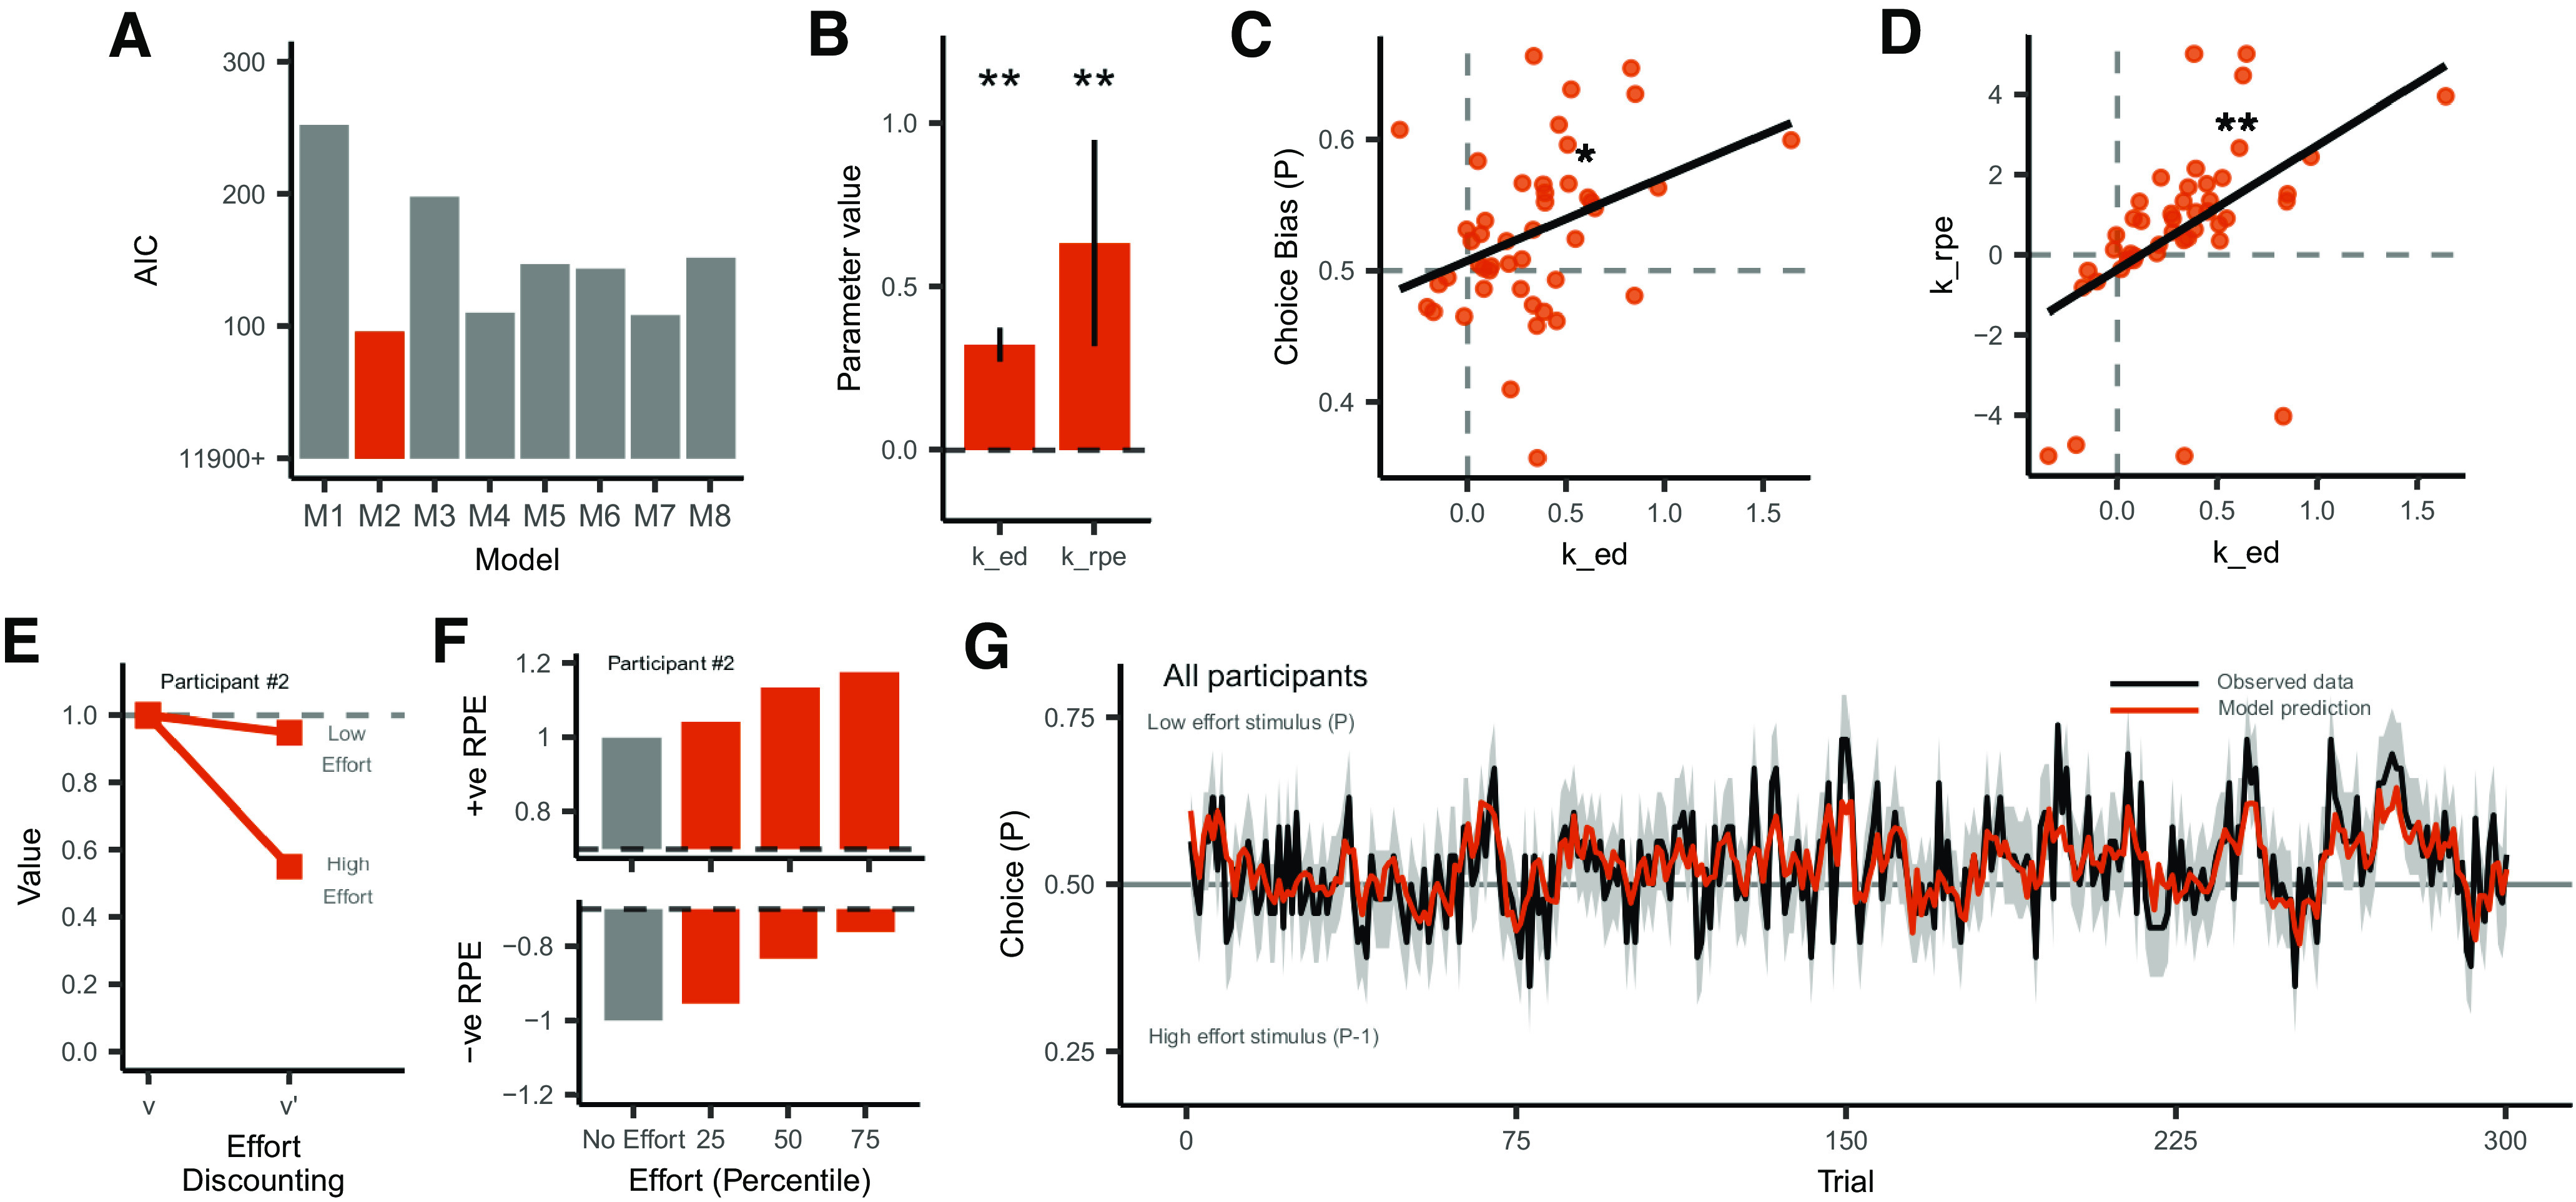
Humans routinely learn the value of actions by updating their expectations based on past outcomes - a process driven by reward prediction errors (RPEs). Importantly, however, implementing a course of action also requires the investment of effort. Recent work has revealed a close link between the neural signals involved in effort exertion and those underpinning reward-based learning, but the behavioral relationship between these two functions remains unclear. Across two experiments, we tested healthy male and female human participants (N = 140) on a reinforcement learning task in which they registered their responses by applying physical force to a pair of hand-held dynamometers. We examined the effect of effort on learning by systematically manipulating the amount of force required to register a response during the task. Our key finding, replicated across both experiments, was that greater effort increased learning rates following positive outcomes and decreased them following negative outcomes, which corresponded to a differential effect of effort in boosting positive RPEs and blunting negative RPEs. Interestingly, this effect was most pronounced in individuals who were more averse to effort in the first place, raising the possibility that the investment of effort may have an adaptive effect on learning in those less motivated to exert it. By integrating principles of reinforcement learning with neuroeconomic approaches to value-based decision-making, we show that the very act of investing effort modulates one's capacity to learn, and demonstrate how these functions may operate within a common computational framework.SIGNIFICANCE STATEMENT Recent work suggests that learning and effort may share common neurophysiological substrates. This raises the possibility that the very act of investing effort influences learning. Here, we tested whether effort modulates teaching signals in a reinforcement learning paradigm. Our results showed that effort resulted in more efficient learning from positive outcomes and less efficient learning from negative outcomes. Interestingly, this effect varied across individuals, and was more pronounced in those who were more averse to investing effort in the first place. These data highlight the importance of motivational factors in a common framework of reward-based learning, which integrates the computational principles of reinforcement learning with those of value-based decision-making.

Keywords: effort; learning; motivation; reinforcement; reward; reward prediction error.


Figures

Figure 1.
Figure 1.
Candidate computational models of how effort modulates learning. A, Schematic diagrams of positive (above the dotted line) and negative (below the dotted line) RPE signals. Black lines depict RPEs unaffected by effort. Orange lines show how effort alters RPEs according to each respective model. B, At the core of each computational model is a modified Rescorla–Wagner model in which the learning rate α is a sigmoidal function of a subject-specific signal gain parameter γ. We compared this baseline model with alternative models that hypothesized distinct effects of trial-by-trial effort E(t) on signal gain γ, scaled by a subject-specific effort parameter k. C, We tested the identifiability of our learning models by simulating a reinforcement learning paradigm with effortful responses. We performed 50 simulations, yielding a model recovery accuracy ≥0.88 for all models.
Figure 2.
Figure 2.
Experiment 1 behavioral results. A, Participants made a series of choices between two stimuli by applying physical force to a pair of hand-held dynamometers. Following each choice, the chosen stimulus was displayed along with a probabilistic reward outcome (smiley or sad face). Each participant completed one effort block and one control block. B, Mean peak amplitudes in control blocks (gray) and effort blocks (blue). The effort required to register choices (dotted lines) was negligible in the control block (5% MVC), and higher in the effort block (18%, 31%, or 44% MVC for separate low, medium, and high effort groups, respectively). C, Raincloud plots of accuracy in the effort block relative to the control block for low, medium, and high effort groups. Effort group was a significant predictor of relative accuracy (p = 0.014). D, Model estimates of trial-by-trial win-stay (left) and lose-switch (right) probabilities with 95% confidence intervals (shaded area). Effort increased the tendency for participants to choose the same stimulus again following a reward (p = 0.021), and reduced the tendency to switch to the alternative stimulus following no reward (p = 0.014); *p < 0.05.
Figure 3.
Figure 3.
Experiment 1 computational modeling results. A, The signal shift model (orange) provided the most parsimonious account of the observed choice data based on AIC scores. B, Group average k values (mean ± SE) derived from the winning signal shift model. k values were significantly greater than 0 (p = 0.006), demonstrating that effort tended to boost positive and blunt negative RPEs. This effect was driven by the medium effort group (p = 0.005). C, RPEs from a representative participant (#74). Relative to baseline (black bars), effort boosted positive RPEs (top) and blunted negative RPEs (bottom). D, Choice probability averaged across all participants on each trial. The signal shift model (orange) was able to predict the observed choice data (black; SE shaded); **p < 0.01.
Figure 4.
Figure 4.
Experiment 2 behavioral results. A, Participants made a series of choices between two stimuli by applying physical force to a pair of hand-held dynamometers. One stimulus required negligible effort to select (low effort stimulus; 5% MVC) and the other required greater effort to select (high effort stimulus; 44% MVC). Participants therefore had to balance an aversion to the high effort stimulus against their desire to maximize reward. B, Mean peak amplitudes for the low effort (light blue) and high effort (dark blue) stimulus. C, Participants chose the low effort stimulus more often than the high effort stimulus (p = 0.003). D, There was no difference in choice accuracy between the low and high effort stimulus (p = 0.34). E, Model estimates of trial-by-trial win-stay (left) and lose-switch (right) probabilities with 95% confidence intervals (shaded area). Greater effort led to reduced win-stay behavior (p < 0.001) and increased lose-switch behavior (p < 0.001), reflecting an aversion to selecting the high effort stimulus; **p < 0.01. n.s. = Not significant.
Figure 5.
Figure 5.
Experiment 2 computational modeling results. A, The effort discounting + signal shift model (orange) provided the most parsimonious account of the observed choice data based on AIC scores. B, Group average ked and krpe values (mean ± SE) derived from the winning model. Parameter values were significantly greater than 0 (both p ≤ 0.001), demonstrating that effort discounted value before choice, while boosting positive and blunting negative RPEs after choice. C, The winning model captured observed effort aversion, demonstrated by a correlation between ked values and choice bias (ρ = 0.36, p = 0.015). D, ked and krpe values were strongly correlated (ρ = 0.70, p < 0.001), suggesting that effort modulated learning to a greater extent in those participants who were more averse to exerting it. E, Effort discounting from a representative participant (#2). Learned value (v) was discounted (v') by the amount of effort required to select each stimulus, scaled by an effort discounting parameter (ked). F, RPEs from a representative participant (#2). Relative to baseline (black bars), effort boosted positive RPEs (top) and blunted negative RPEs (bottom). G, Average choice probability across all participants on each trial. The effort discounting + signal shift model (orange) was able to predict the observed choice data (black; SE shaded). *p < 0.05, **p < 0.01.

Similar articles

Cited by

References

    1. Aberman JE, Salamone JD (1999) Nucleus accumbens dopamine depletions make rats more sensitive to high ratio requirements but do not impair primary food reinforcement. Neuroscience 92:545–552. 10.1016/S0306-4522(99)00004-4 - DOI - PubMed
    1. Akaike H (1974) A new look at the statistical model identification. IEEE Trans Automat Contr 19:716–723. 10.1109/TAC.1974.1100705 - DOI
    1. Alessandri J, Darcheville JC, Delevoye-Turrell Y, Zentall TR (2008) Preference for rewards that follow greater effort and greater delay. Learn Behav 36:352–358. - PubMed
    1. Aronson E, Mills J (1959) The effect of severity of initiation on liking for a group. J Abnorm Soc Psychol 59:177–181. 10.1037/h0047195 - DOI
    1. Atkins KJ, Andrews SC, Stout JC, Chong TT (2020) Dissociable motivational deficits in pre-manifest Huntington's disease. Cell Rep Med 1:100152. - PMC - PubMed

Publication types

LinkOut - more resources