. 2022 Sep 12;5(11):e202201474.
doi: 10.26508/lsa.202201474. Print 2022 Nov.

Sibling rivalry among the ZBTB transcription factor family: homodimers versus heterodimers

Affiliations

Sibling rivalry among the ZBTB transcription factor family: homodimers versus heterodimers

Sofia Piepoli et al. Life Sci Alliance. .

Abstract

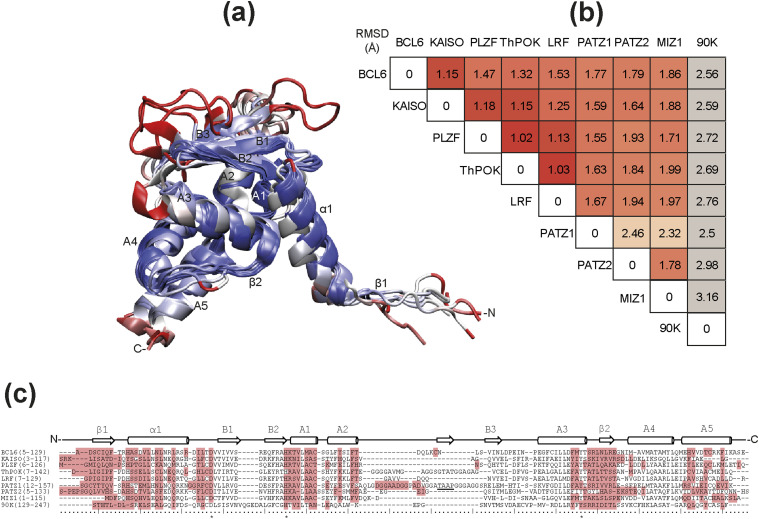
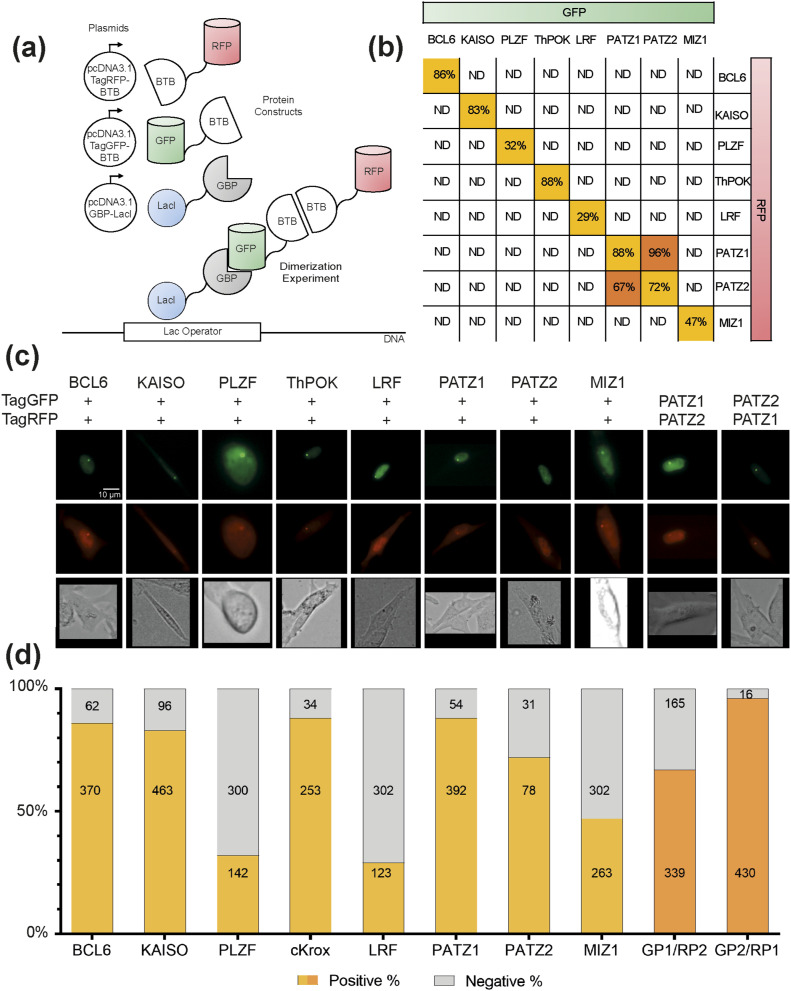
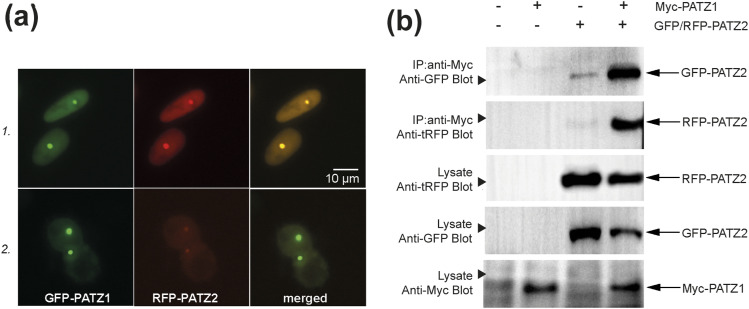
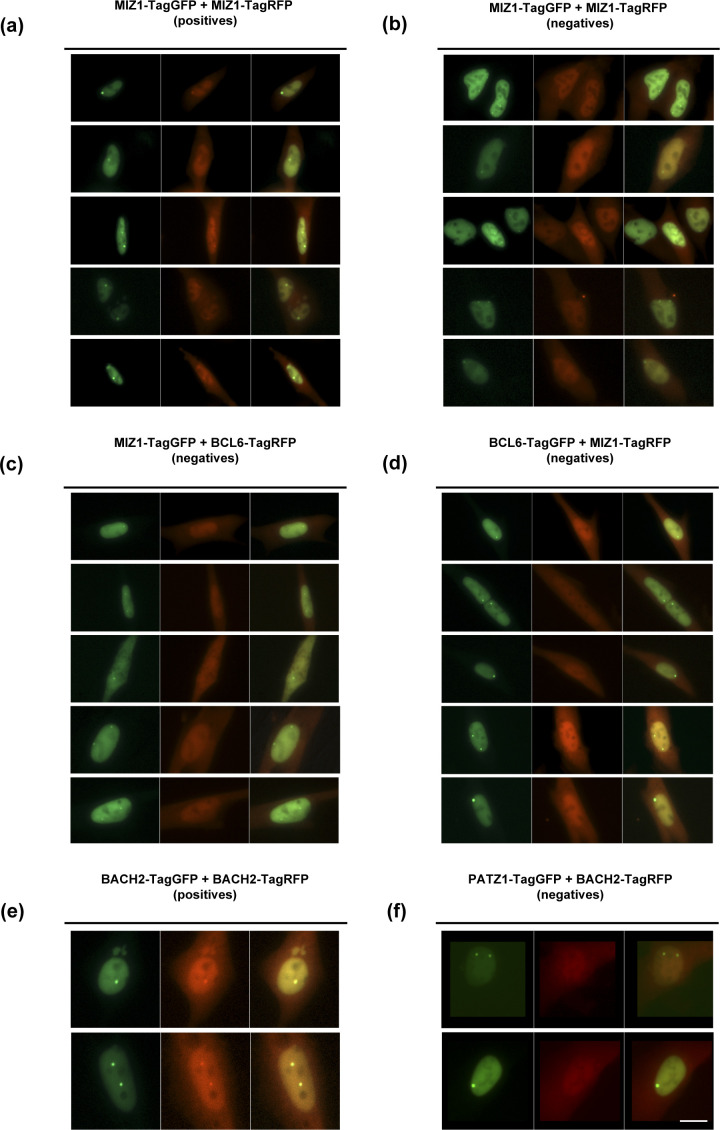
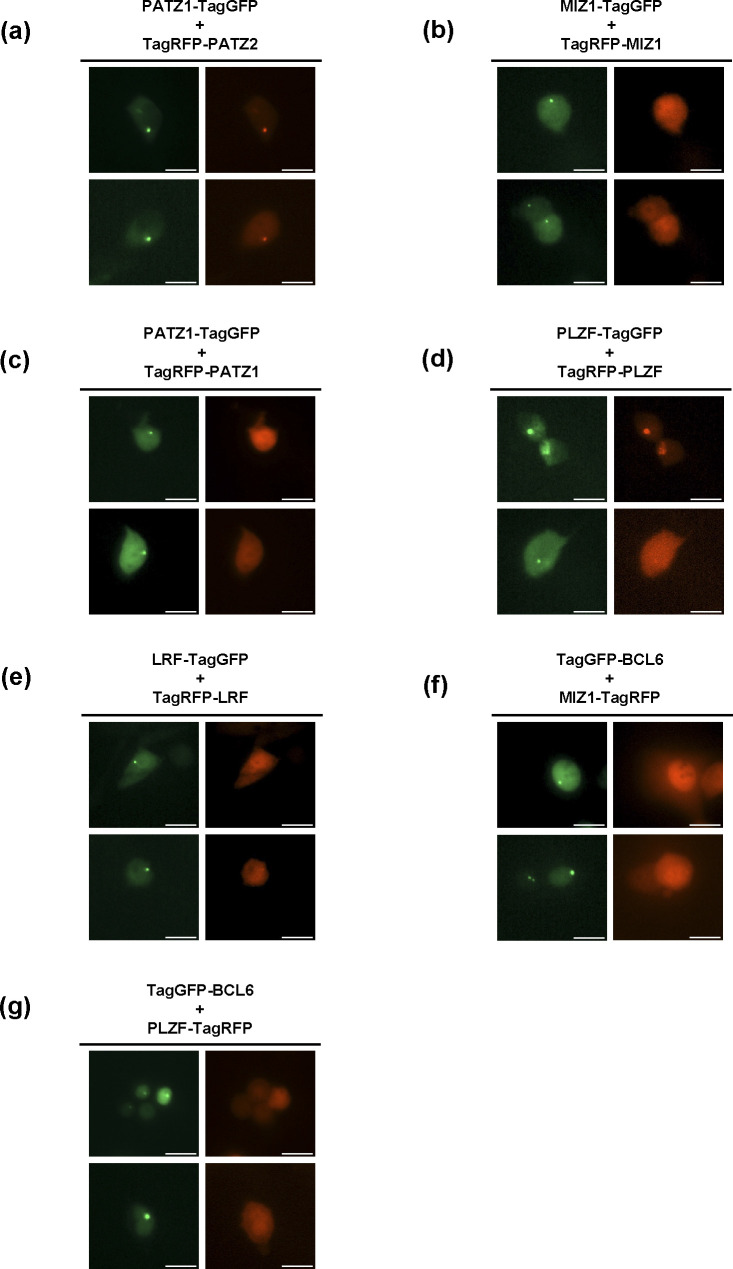
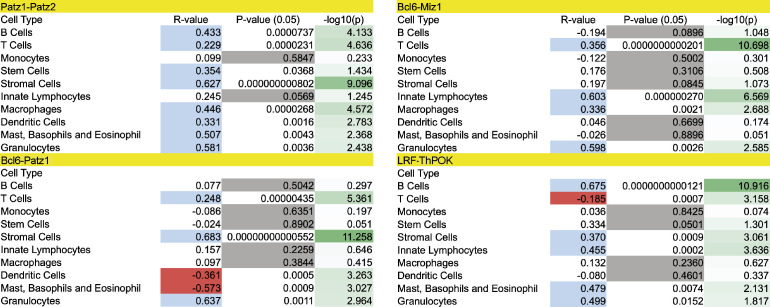
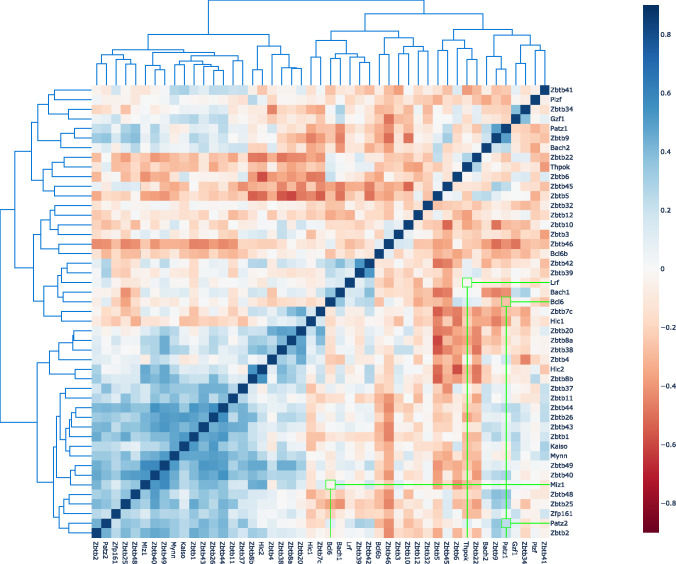
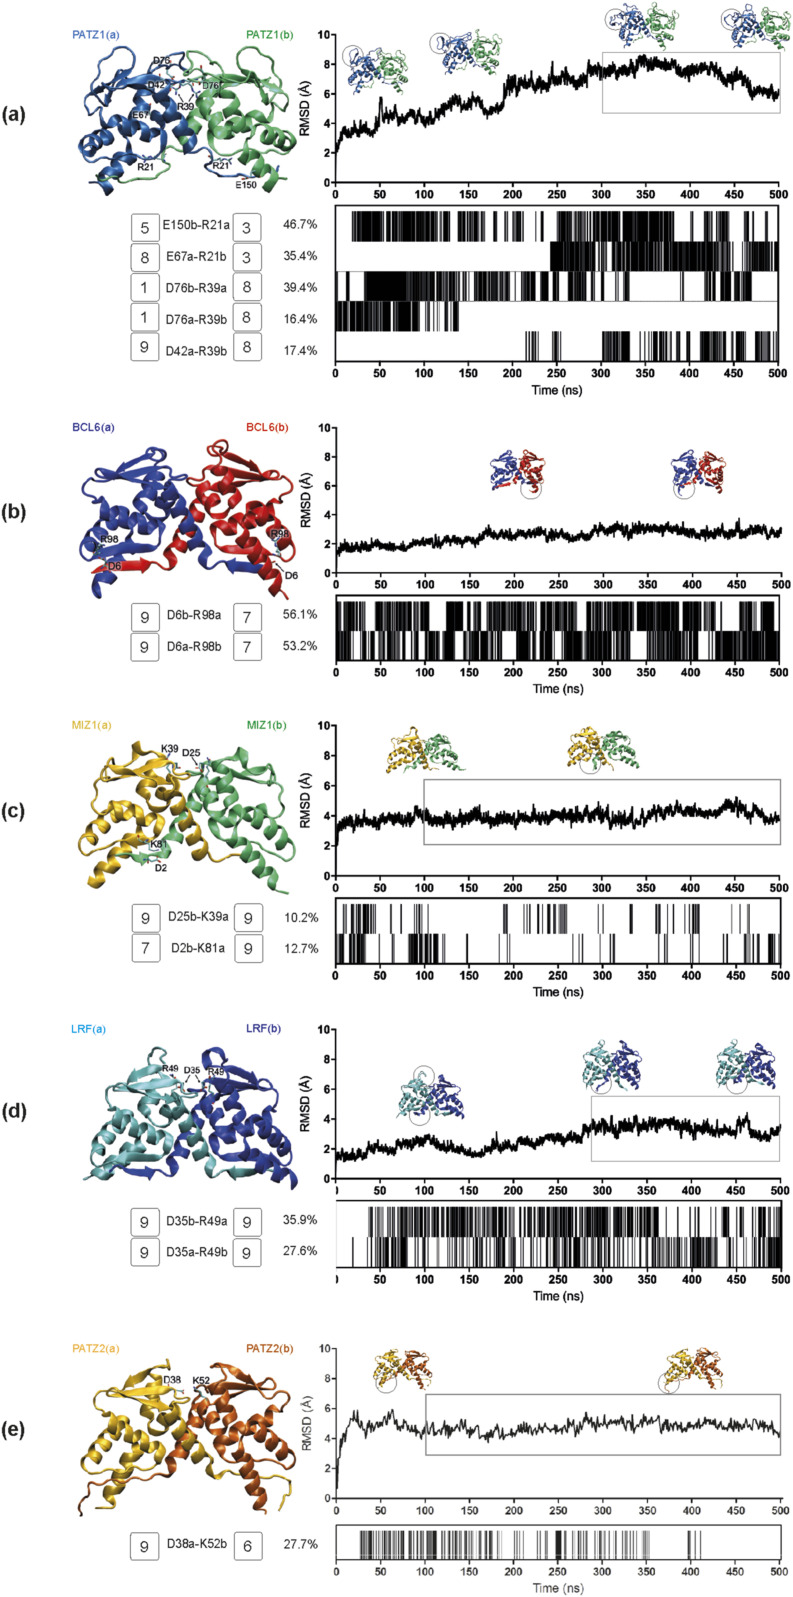
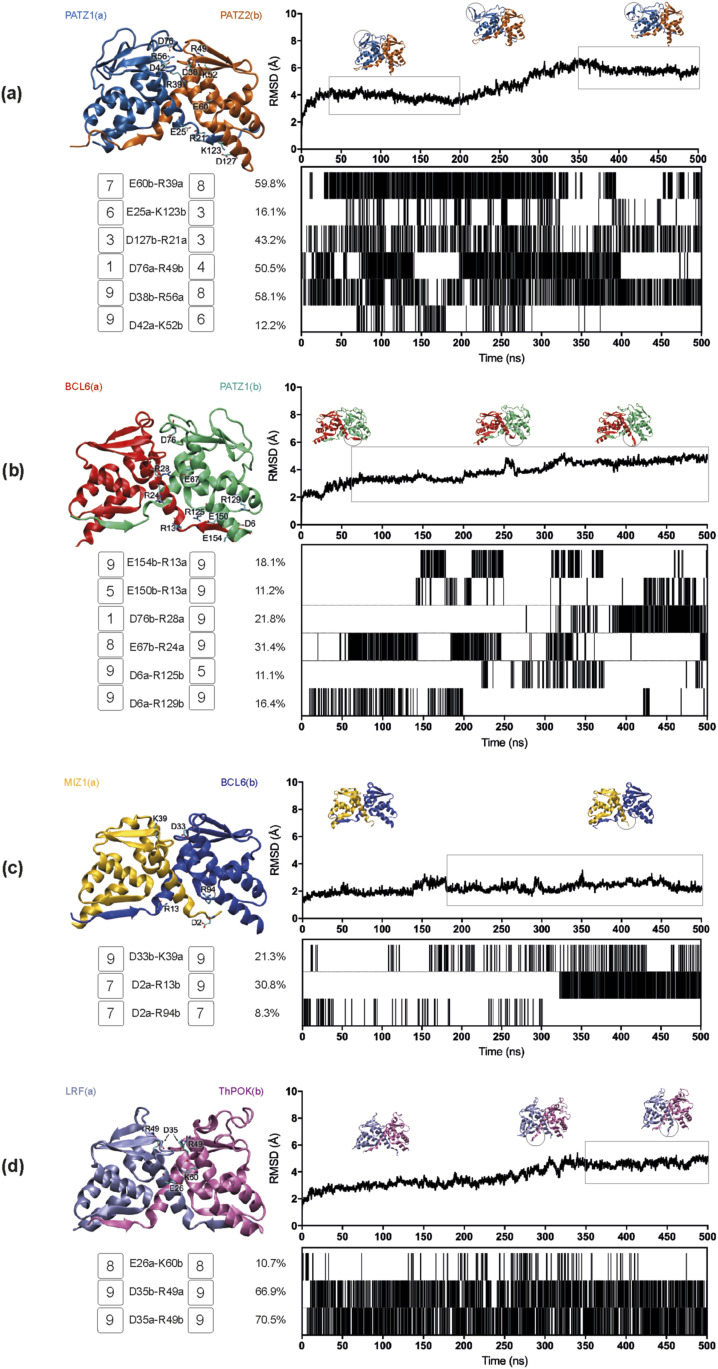
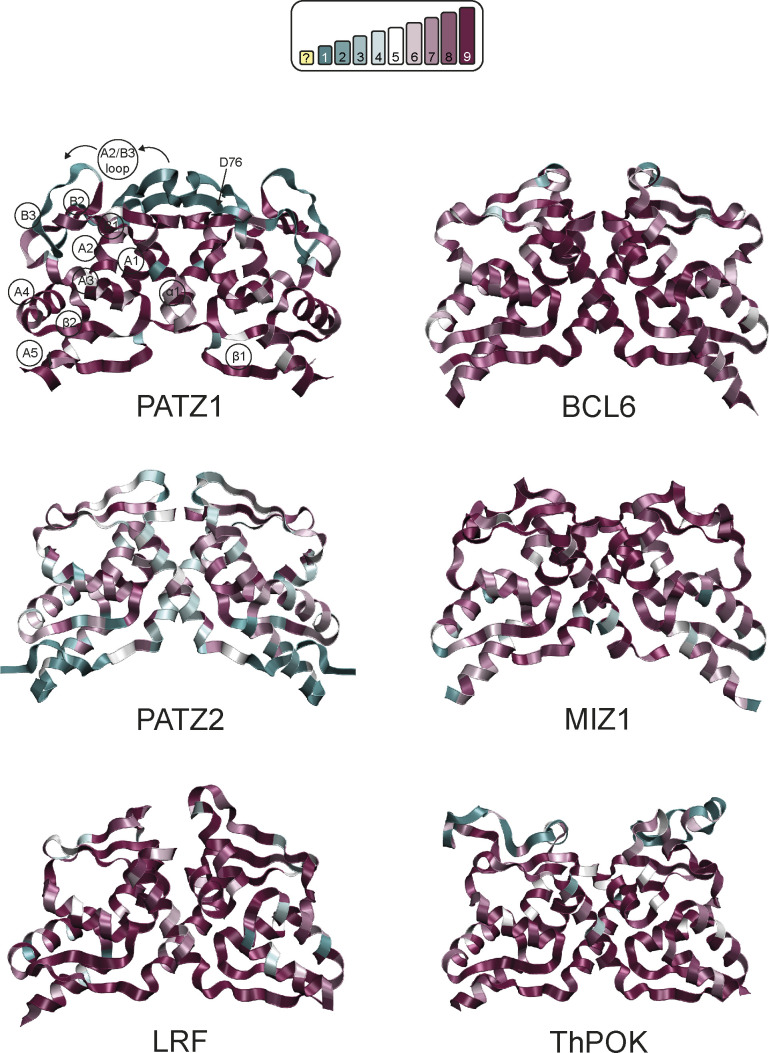
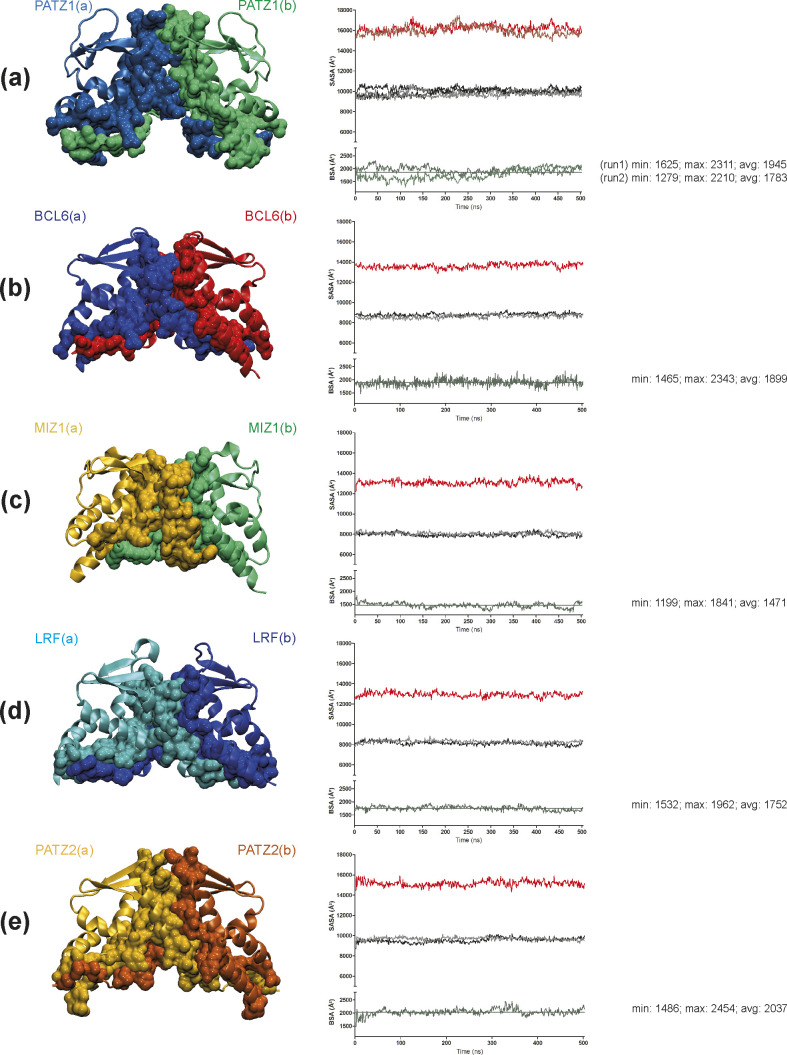
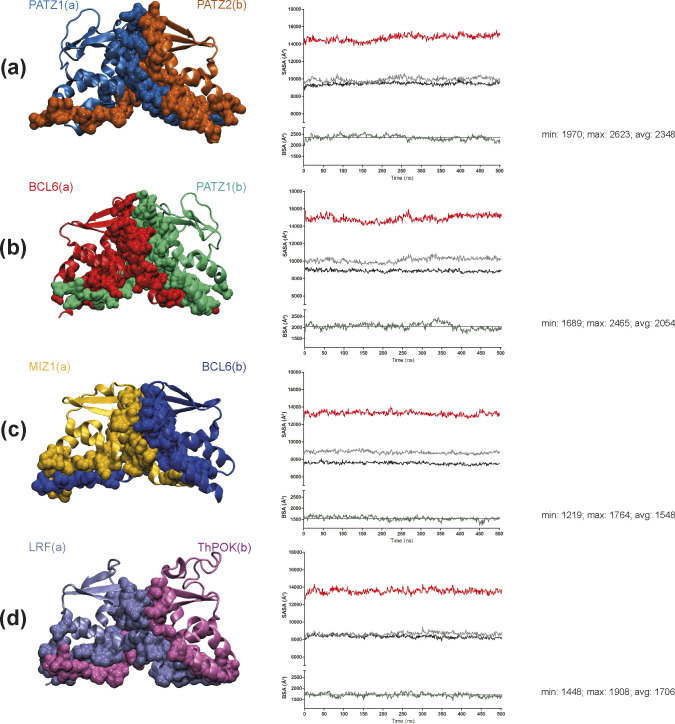
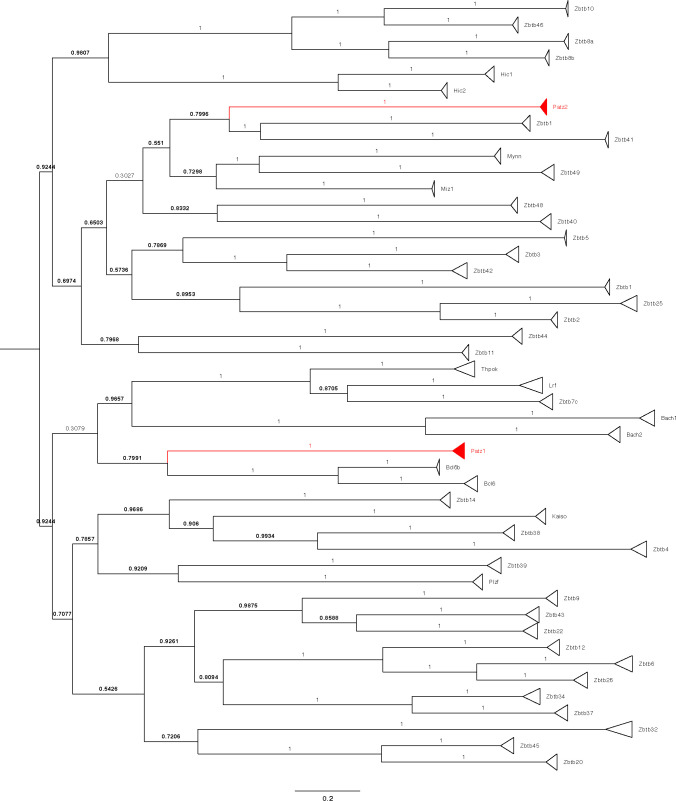
The BTB domain is an oligomerization domain found in over 300 proteins encoded in the human genome. In the family of BTB domain and zinc finger-containing (ZBTB) transcription factors, 49 members share the same protein architecture. The N-terminal BTB domain is structurally conserved among the family members and serves as the dimerization site, whereas the C-terminal zinc finger motifs mediate DNA binding. The available BTB domain structures from this family reveal a natural inclination for homodimerization. In this study, we investigated the potential for heterodimer formation in the cellular environment. We selected five BTB homodimers and four heterodimer structures. We performed cell-based binding assays with fluorescent protein-BTB domain fusions to assess dimer formation. We tested the binding of several BTB pairs, and we were able to confirm the heterodimeric physical interaction between the BTB domains of PATZ1 and PATZ2, previously reported only in an interactome mapping experiment. We also found this pair to be co-expressed in several immune system cell types. Finally, we used the available structures of BTB domain dimers and newly constructed models in extended molecular dynamics simulations (500 ns) to understand the energetic determinants of homo- and heterodimer formation. We conclude that heterodimer formation, although frequently described as less preferred than homodimers, is a possible mechanism to increase the combinatorial specificity of this transcription factor family.


Conflict of interest statement

The authors declare that they have no conflict of interest.

Figures

Figure 1.
Figure 1.. Structural conservation in the BTB domain.
(A) A cartoon representation of the BTB domain with annotated secondary structural elements between N- and C-termini is colored based on a metric for structural alignment (Q-score) ranging from blue to red to show the most and the least conserved regions, respectively. The nine overlapped structures belong to the BTB monomers of BCL6, KAISO, PLZF, ThPOK, LRF, PATZ1, PATZ2, MIZ1, and Galectin-3-binding protein (LG3BP/90K) human proteins. (B) The structural alignment is measured in terms of root mean square deviation (Å) of the Cα atoms for each pair of BTB domain structures. The root mean square deviation among this set of BTB structures is under 2 Å except for the two cases of PATZ1-PATZ2 and PATZ1-MIZ1. The secondary structure labeling follows the convention for the BTB fold as used in Stogios et al (2005). The structure and sequence of the human BTB-containing protein LG3BP/90K (PDB entry 6GFB) (Lodermeyer et al, 2018) is only used here as a divergent example to underline the similarity of the BTB domain in ZBTB proteins. (C) In the corresponding sequence alignment (C), the residues forming the BTB homodimer interface are highlighted. The residues in the BTB characteristic charged pocket are found at the beginning of B1 (negative) and between B2 and A1 (positive). The three absolutely conserved positions are indicated with an asterisk (*). The secondary structures are annotated on the sequences for orientation with part (A). The unlabeled β-strand between A2 and B3 indicates an additional secondary structure revealed in the model of PATZ1 (Piepoli et al, 2020).
Figure 2.
Figure 2.. F2H assay identifies BTB domain homo- and heterodimer formation in vitro.
(A) Schematic description of the experimental setup. The co-transfected plasmids of the recombinant sequences of BTB domains tagged with green or red fluorescent proteins (GFP or RFP) and the GFP-binding nanobody (GBP) fused to Lac I sequence are represented as white circles next to the expressed fusion proteins. Below, a model of the interacting proteins in the co-localization experiment. (B) In matrix representation, the summary of interactions among the different dimer combinations. For each experimental pair, the colocalization signal is either not detected (ND) or detected in the reported percentage of the total number of cells analyzed. The only heterodimer identified with this assay is between PATZ1 and PATZ2 BTB domains. (C) Representative fluorescent microscopy images of colocalized tagGFP or tagRFP fusion BTB domains. Only the positive scored interactions from part (B) are shown. Three channel images displayed GFP (top row), RFP (middle row) fluorescence, and brightfield (bottom row). (D) Quantification of the colocalization assay. The bar graph shows the percentage of GFP focus–positive cells that also displayed an RFP focus (positive) or not (negative). Numbers inside the bar graphs indicate the total number of cells analyzed for each case. Colors refer to part (B) where each column displays data from cells transfected with GFP- and RFP-tagged versions of the indicated BTB domains. The only heterodimers that interact were GFP-tagged PATZ1-BTB (GP1) with RFP-tagged PATZ2-BTB (RP2) and GFP-tagged PATZ2-BTB (GP2) with RFP-tagged PATZ1-BTB (RP1).
Figure 3.
Figure 3.. PATZ1 and PATZ2 BTB domains can efficiently heterodimerize.
(A) Two examples of the cells in which co-localization of the fluorescent signals from GFP-tagged PATZ1 and RFP-tagged PATZ2 BTB domains was detected. Two images of each cell were collected using different fluorescence filters, and an overlay of the two images is shown on the right. (B) Co-immunoprecipitation and Western blotting confirm the interaction between the BTB domains of PATZ1 and PATZ2. HEK-293 cells were transfected with the indicated constructs of Myc epitope–tagged PATZ1 and tagGFP- or tagRFP-tagged PATZ2. Anti-Myc immunoprecipitation of whole-cell lysates was followed by anti-GFP or anti-RFP Western blotting. Un-immunoprecipitated lysates are shown for loading controls. Arrowheads on the left indicate the location of size markers that correspond to 46 kD for the top four rows and to 25 kD for the bottom row.
Figure S1.
Figure S1.. F2H assays showing favoured and unfavoured homo- and heterodimers.
N-terminal tagGFP fusion BTB domains were assessed for co-localization in the F2H assay with N-terminal tagRFP fusion BTB domains. (A, B, C, D, E, F) Indicated pairs of tagged BTB domains were expressed in LacO locus containing BHK cells with the LacI-GFP construct. (A, B) Of the MIZ1-TagGFP–expressing foci–positive cells roughly half were positive for MIZ1-TagRFP foci, and (B) half were negative for MIZ1-TagRFP foci. (C, D) MIZ1 and BCL6 did not heterodimerize in this assay regardless of whether (C) MIZ1-Tag-GFP or (D) BCL6-TagGFP were used to form foci. (E, F) BACH2 could form homodimers, whereas (F) PATZ1/BACH2 could not form heterodimers. Two images of each cell were acquired using different fluorescence filters and an overlay was generated in Fiji software. Scale bar corresponds to 10 μm.
Figure S2.
Figure S2.. F2H assays using C-terminal fluorescent protein–tagged BTB domains.
The C-terminal tagGFP fusion BTB domains were assessed for co-localization in the F2H assay with N-terminal tagRFP fusion BTB domains. (A, B, C, D, E, F, G) Indicated pairs of tagged BTB domains were expressed in LacO locus containing BHK cells with the LacI-GFP construct. Two images of each cell were acquired using different fluorescence filters. Scale bar corresponds to 10 μm.
Figure S3.
Figure S3.. Statistical significance for values in Table 1.
The R-value indicates positive (blue) or negative (red) correlation in the expression profiles of the genes pair. The statistical significance of the R-value is determined by a P-value < 0.05 that is otherwise highlighted in gray. The −log10 of the P-value gives a measure in integer numbers of the P-value significance with a higher number indicating higher significance.
Figure S4.
Figure S4.. Co-expression patterns of ZBTB proteins based on linear least-squares regression correlation coefficients.
Blue indicates a significant positive correlation, red indicates a significant negative correlation, and gray indicates non-significant (P-value > 0.05) correlation. Proteins are clustered based on the correlation coefficients of expression values from all cell-types retrieved from ImmGen database GSE15907 and GSE37448. Four pairs of ZBTB proteins selected for the heterodimers analysis in this study (PATZ1-PATZ2, BCL6-PATZ1, MIZ1-BCL6, and LRF-ThPOK) are highlighted in green. A co-expressed cluster of 22 ZBTB genes is evident in the bottom left corner.
Figure 4.
Figure 4.. Molecular dynamic simulation analyses for the BTB domain homodimers.
(A, B, C, D, E) Root mean square deviation plots, salt bridge formation barcodes, and a cartoon representation of the BTB domain dimer structure are shown for, PATZ1 (A), BCL6 (B), MIZ1 (C), LRF (D), and PATZ2 (E). The root mean square deviation plot shows the structural distance (Å) of the protein atoms coordinates (Cα) as a function of time (ns) and contains the snapshots of the significant conformational changes of the dimer structure. Every salt bridge between a pair of charged amino acids with a distance within the 3.0-Å cutoff is represented with a bar in the barcode plot and reported if present over the 8% of the total simulation time. The amino acids belonging to one monomer (a) or the other (b) involved in the interchain interactions are labeled with one-letter code. For each residue in these interchain salt bridges, the conservation score is displayed next to its label in the range [1,9], increasing from variable (1) to conserved (9) as calculated via the ConSurf web server.
Figure 5.
Figure 5.. Molecular dynamic simulation analyses for the BTB domain heterodimers.
(A, B, C, D) Root mean square deviation plots, salt bridge formation barcodes, and a cartoon representation of the BTB domain dimer structure are shown for PATZ1-PATZ2 (A), BCL6-PATZ1 (B), MIZ1-BCL6 (C), and LRF-ThPOK (D). See caption to Fig 4 for details.
Figure S5.
Figure S5.. Ribbon representation of selected BTB homodimer structures.
The conservation was calculated by ConSurf and color-coded as shown in the scale from blue (variable) to purple (conserved). Secondary structure features are labeled on PATZ1 BTB dimer. Exposed protein surfaces are less conserved than buried and dimer interface regions. PATZ2 and ThPOK dimers are based on novel modeled structured.
Figure S6.
Figure S6.. BTB homodimer representative structures and time evolution of solvent accessibility.
(A, B, C, D, E) Dimerization interface in the BTB homodimers of PATZ1 (A; two independent simulations), BCL6 (B), MIZ1 (C), LRF (D), and PATZ2 (E). For each protein, solvent accessible surface area (SASA) values (Å2) are calculated separately for the dimer (red) and the single monomers (black and gray in the graph) through the simulation. In green, the buried surface area (Å2) obtained by subtracting the sum of the SASA of the two monomers from the SASA of the complex dimer. Below each figure, the minimum, maximum, and average values of buried surface area (Å2) are reported.
Figure S7.
Figure S7.. BTB heterodimer representative structures and time evolution of solvent accessibility.
(A, B, C, D) Dimerization interface in the BTB heterodimers of PATZ1-PATZ2 (A), BCL6-PATZ1 (B), BCL6-MIZ1 (C), and LRF-ThPOK (D). See caption to Fig S6 for details.
Figure S8.
Figure S8.. Phylogenetic tree of the ZBTB family.
The BTB domain sequences of all ZBTB family proteins were used in Blast search, and the phylogenetic tree was constructed from the multiple sequence alignment of the top 10 Blast hits. Bootstrap values considered significant are in bold.

Similar articles

Cited by

References

    1. Adasme-Carreño F, Muñoz-Gutierrez C, Caballero J, Alzate-Morales JH (2014) Performance of the MM/GBSA scoring using a binding site hydrogen bond network-based frame selection: The protein kinase case. Phys Chem Chem Phys 16: 14047–14058. 10.1039/c4cp01378f - DOI - PubMed
    1. Ahmad KF, Engel CK, Prive GG (1998) Crystal structure of the BTB domain from PLZF. Proc Natl Acad Sci U S A 95: 12123–12128. 10.1073/pnas.95.21.12123 - DOI - PMC - PubMed
    1. Ahmad KF, Melnick A, Lax S, Bouchard D, Liu J, Kiang CL, Mayer S, Takahashi S, Licht JD, Prive GG (2003) Mechanism of SMRT corepressor recruitment by the BCL6 BTB domain. Mol Cell 12: 1551–1564. 10.1016/s1097-2765(03)00454-4 - DOI - PubMed
    1. Altschul SF, Madden TL, Schäffer AA, Zhang J, Zhang Z, Miller W, Lipman DJ (1997) Gapped BLAST and PSI-BLAST: A new generation of protein database search programs. Nucleic Acids Res 25: 3389–3402. 10.1093/nar/25.17.3389 - DOI - PMC - PubMed
    1. Ashkenazy H, Abadi S, Martz E, Chay O, Mayrose I, Pupko T, Ben-Tal N (2016) ConSurf 2016: An improved methodology to estimate and visualize evolutionary conservation in macromolecules. Nucleic Acids Res 44: W344–W350. 10.1093/nar/gkw408 - DOI - PMC - PubMed

Publication types

Substances