

Random forest algorithms to classify frailty and falling history in seniors using plantar pressure measurement insoles: a large-scale feasibility study
- PMID: 36096722
- PMCID: PMC9469527
- DOI: 10.1186/s12877-022-03425-5
Random forest algorithms to classify frailty and falling history in seniors using plantar pressure measurement insoles: a large-scale feasibility study
Erratum in
-
Correction: Random forest algorithms to classify frailty and falling history in seniors using plantar pressure measurement insoles: a large-scale feasibility study.BMC Geriatr. 2022 Dec 8;22(1):946. doi: 10.1186/s12877-022-03514-5. BMC Geriatr. 2022. PMID: 36482323 Free PMC article. No abstract available.
Abstract
Background: Frailty and falls are two adverse characteristics of aging that impair the quality of life of senior people and increase the burden on the healthcare system. Various methods exist to evaluate frailty, but none of them are considered the gold standard. Technological methods have also been proposed to assess the risk of falling in seniors. This study aims to propose an objective method for complementing existing methods used to identify the frail state and risk of falling in older adults.
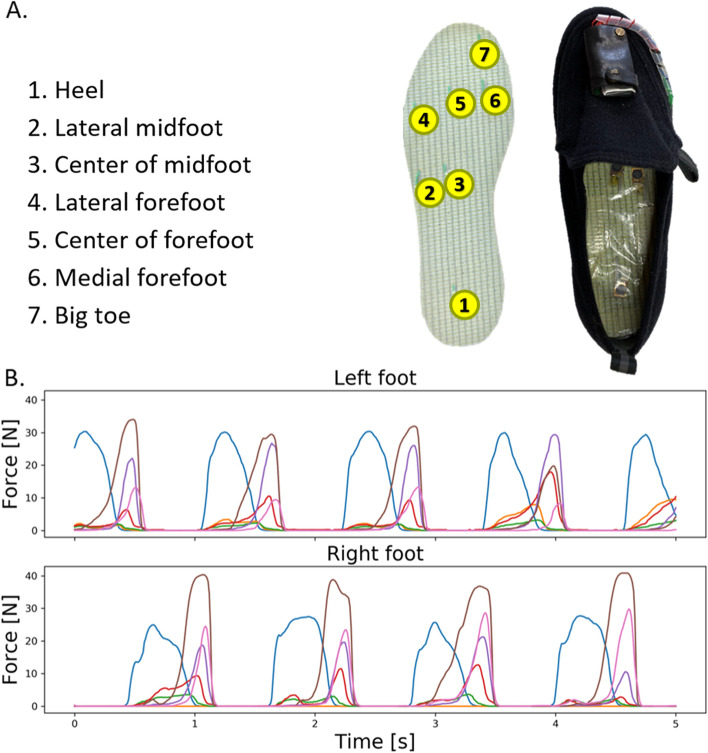
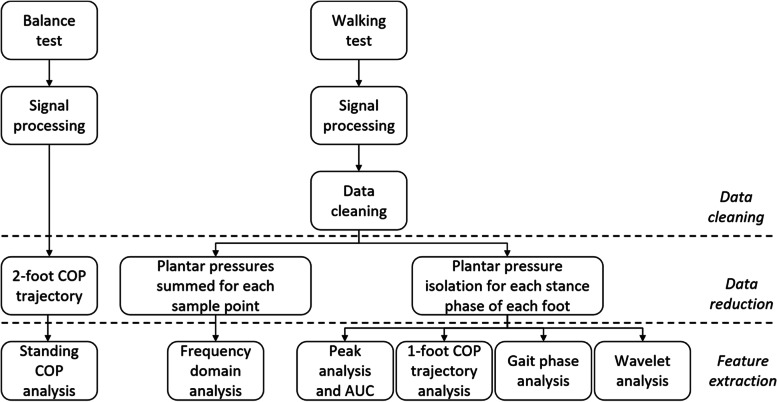
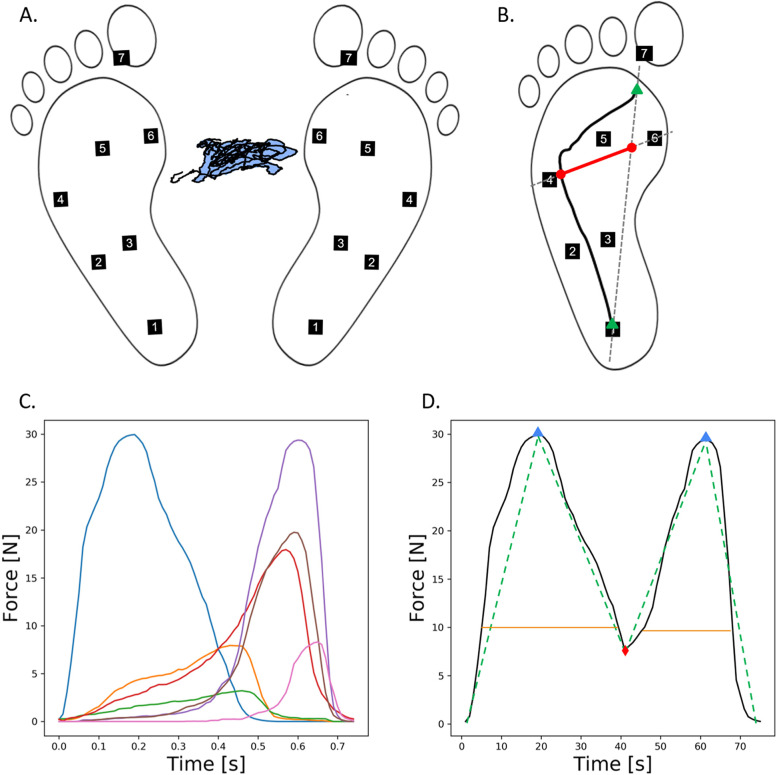
Method: A total of 712 subjects (age: 71.3 ± 8.2 years, including 505 women and 207 men) were recruited from two Japanese cities. Two hundred and three people were classified as frail according to the Kihon Checklist. One hundred and forty-two people presented with a history of falling during the previous 12 months. The subjects performed a 45 s standing balance test and a 20 m round walking trial. The plantar pressure data were collected using a 7-sensor insole. One hundred and eighty-four data features were extracted. Automatic learning random forest algorithms were used to build the frailty and faller classifiers. The discrimination capabilities of the features in the classification models were explored.
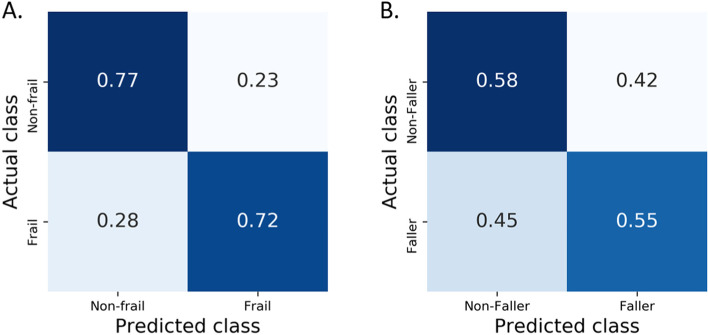
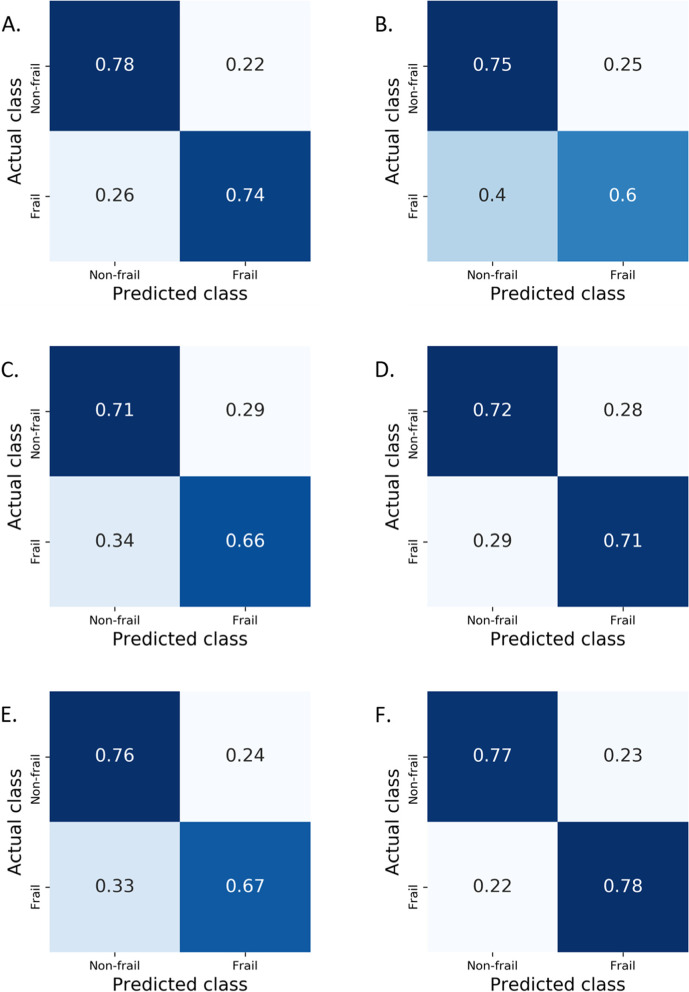
Results: The overall balanced accuracy for the recognition of frail subjects was 0.75 ± 0.04 (F1-score: 0.77 ± 0.03). One sub-analysis using data collected for men aged > 65 years only revealed accuracies as high as 0.78 ± 0.07 (F1-score: 0.79 ± 0.05). The overall balanced accuracy for classifying subjects with a recent history of falling was 0.57 ± 0.05 (F1-score: 0.62 ± 0.04). The classification of subjects relative to their frailty state primarily relied on features extracted from the plantar pressure series collected during the walking test.
Conclusion: In the future, plantar pressures measured with smart insoles inserted in the shoes of senior people may be used to evaluate aspects of frailty related to the physical dimension (e.g., gait and balance alterations), thus allowing assisting clinicians in the early identification of frail individuals.
Keywords: Aging; Balance; Fall risk; Frailty; Gait analysis; Plantar pressure; Random forest classifier; Smart-insole; Walking.
© 2022. The Author(s).
Conflict of interest statement
EM, NAK, LC, DR, YO and JT declare that they have no competing interests.
Figures
Similar articles
-
[Impact of fall risk and fear of falling on mobility of independently living senior citizens transitioning to frailty: screening results concerning fall prevention in the community].Z Gerontol Geriatr. 2007 Aug;40(4):255-67. doi: 10.1007/s00391-007-0473-z. Z Gerontol Geriatr. 2007. PMID: 17701116 German.
-
Frailty and Fear of Falling: The FISTAC Study.J Frailty Aging. 2017;6(3):136-140. doi: 10.14283/jfa.2017.19. J Frailty Aging. 2017. PMID: 28721429
-
Classification of frailty and falls history using a combination of sensor-based mobility assessments.Physiol Meas. 2014 Oct;35(10):2053-66. doi: 10.1088/0967-3334/35/10/2053. Epub 2014 Sep 19. Physiol Meas. 2014. PMID: 25237821
-
Frailty Is a Risk Factor for Falls in the Older Adults: A Systematic Review and Meta-Analysis.J Nutr Health Aging. 2023;27(6):487-595. doi: 10.1007/s12603-023-1935-8. J Nutr Health Aging. 2023. PMID: 37357334
-
Research Progress on Frailty in Elderly People.Clin Interv Aging. 2024 Aug 29;19:1493-1505. doi: 10.2147/CIA.S474547. eCollection 2024. Clin Interv Aging. 2024. PMID: 39224708 Free PMC article. Review.
Cited by
-
Physical Frailty Prediction Using Cane Usage Characteristics during Walking.Sensors (Basel). 2024 Oct 28;24(21):6910. doi: 10.3390/s24216910. Sensors (Basel). 2024. PMID: 39517806 Free PMC article.
-
Which factors affect anxiety in rural older adults in China?Front Public Health. 2025 Jun 11;13:1563505. doi: 10.3389/fpubh.2025.1563505. eCollection 2025. Front Public Health. 2025. PMID: 40567968 Free PMC article.
-
Correction: Random forest algorithms to classify frailty and falling history in seniors using plantar pressure measurement insoles: a large-scale feasibility study.BMC Geriatr. 2022 Dec 8;22(1):946. doi: 10.1186/s12877-022-03514-5. BMC Geriatr. 2022. PMID: 36482323 Free PMC article. No abstract available.
-
Physical ability, cervical function, and walking plantar pressure in frail and pre-frail older adults: An attentional focus approach.Front Aging. 2022 Dec 8;3:1063320. doi: 10.3389/fragi.2022.1063320. eCollection 2022. Front Aging. 2022. PMID: 36568510 Free PMC article.
-
Machine Learning Applications in Sarcopenia Detection and Management: A Comprehensive Survey.Healthcare (Basel). 2023 Sep 7;11(18):2483. doi: 10.3390/healthcare11182483. Healthcare (Basel). 2023. PMID: 37761680 Free PMC article.
References
-
- Ferrucci L, Cavazzini C, Corsi A, Bartali B, Russo CR, Lauretani F, Corsi AM, Bandinelli S, Guralnik JM. Biomarkers of frailty in older persons. J Endocrinol Investig. 2002;25(10 Suppl):10–15. - PubMed
-
- O’Caoimh R, Sezgin D, O’Donovan MR, Molloy DW, Clegg A, Rockwood K, Liew A. Prevalence of frailty in 62 countries across the world: a systematic review and meta-analysis of population-level studies, Age Ageing 2021;50(1):96-104. 10.1093/ageing/afaa219. - PubMed
Publication types
MeSH terms
LinkOut - more resources
Full Text Sources
