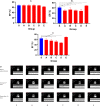
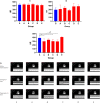
Effect of injection of different doses of isoproterenol on the hearts of mice
- PMID: 36096747
- PMCID: PMC9469628
- DOI: 10.1186/s12872-022-02852-x
Effect of injection of different doses of isoproterenol on the hearts of mice
Abstract
Background: Heart failure (HF) is one of the diseases that seriously threaten human health today and its mechanisms are very complex. Our study aims to confirm the optimal dose ISO-induced chronic heart failure mice model for better study of HF-related mechanisms and treatments in the future.
Methods: C57BL/6 mice were used to establish mice model of chronic heart failure. We injected isoproterenol subcutaneously in a dose gradient of 250 mg/kg, 200 mg/kg, 150 mg/kg, 100 mg/kg and 50 mg/kg. Echocardiography and ELISA were performed to figure out the occurrence of HF. We also supplemented the echocardiographic changes in mice over 30 days.
Results: Except group S and group E, echocardiographic abnormalities were found in other groups, suggesting a decrease in cardiac function. Except group S, myofibrolysis were found in the hearts of mice in other groups. Brain natriuretic peptide was significantly increased in groups B and D, and C-reactive protein was significantly increased in each group.
Conclusion: Our research finally found that the HFrEF mice model created by injection at a dose of 100 mg/kg for 7 days was the most suitable and a relatively stable chronic heart failure model could be obtained by placing it for 21 days.
Keywords: Animal model; Dosage standards; Heart failure; Isoproterenol; Modeling success criteria.
© 2022. The Author(s).
Conflict of interest statement
The authors declare that they have no competing interest.
Figures


Similar articles
-
Chronic GPR30 agonist therapy causes restoration of normal cardiac functional performance in a male mouse model of progressive heart failure: Insights into cellular mechanisms.Life Sci. 2021 Nov 15;285:119955. doi: 10.1016/j.lfs.2021.119955. Epub 2021 Sep 11. Life Sci. 2021. PMID: 34520767 Free PMC article.
-
Aging Impairs Reverse Remodeling and Recovery of Ventricular Function after Isoproterenol-Induced Cardiomyopathy.Int J Mol Sci. 2021 Dec 24;23(1):174. doi: 10.3390/ijms23010174. Int J Mol Sci. 2021. PMID: 35008601 Free PMC article.
-
Interleukin-9 Aggravates Isoproterenol-Induced Heart Failure by Activating Signal Transducer and Activator of Transcription 3 Signalling.Can J Cardiol. 2020 Nov;36(11):1770-1781. doi: 10.1016/j.cjca.2020.01.011. Epub 2020 Jan 24. Can J Cardiol. 2020. PMID: 32621886
-
Echocardiographic assessment of β-adrenoceptor stimulation-induced heart failure with reduced heart rate in mice.Clin Exp Pharmacol Physiol. 2014 Jan;41(1):58-66. doi: 10.1111/1440-1681.12176. Clin Exp Pharmacol Physiol. 2014. PMID: 24107096
-
Changes in cardiac aldosterone and its synthase in rats with chronic heart failure: an intervention study of long-term treatment with recombinant human brain natriuretic peptide.Braz J Med Biol Res. 2014 Aug;47(8):646-54. doi: 10.1590/1414-431x20143474. Epub 2014 Jul 11. Braz J Med Biol Res. 2014. PMID: 25014176 Free PMC article.
Cited by
-
AKAP12 Upregulation Associates With PDE8A to Accelerate Cardiac Dysfunction.Circ Res. 2024 Apr 12;134(8):1006-1022. doi: 10.1161/CIRCRESAHA.123.323655. Epub 2024 Mar 20. Circ Res. 2024. PMID: 38506047 Free PMC article.
-
Transcriptional changes during isoproterenol-induced cardiac fibrosis in mice.Front Mol Biosci. 2023 Dec 18;10:1263913. doi: 10.3389/fmolb.2023.1263913. eCollection 2023. Front Mol Biosci. 2023. PMID: 38178867 Free PMC article.
-
Decoding the Liver-Heart Axis in Cardiometabolic Diseases.Circ Res. 2025 May 23;136(11):1335-1362. doi: 10.1161/CIRCRESAHA.125.325492. Epub 2025 May 22. Circ Res. 2025. PMID: 40403112 Free PMC article. Review.
-
Cardioprotective effects of carvacrol in the isoproterenol-induced myocardial infarction model.BMC Pharmacol Toxicol. 2025 Jul 14;26(1):132. doi: 10.1186/s40360-025-00967-3. BMC Pharmacol Toxicol. 2025. PMID: 40660388 Free PMC article.
References
-
- Bozkurt B, Coats AJ, Tsutsui H, Abdelhamid M, Adamopoulos S, Albert N, Anker SD, Atherton J, Böhm M, Butler J, Drazner MH. Universal definition and classification of heart failure: a report of the heart failure society of America, heart failure association of the European society of cardiology, Japanese heart failure society and writing committee of the universal definition of heart failure. J Card Fail. 2021;27(4):387–413. doi: 10.1016/j.cardfail.2021.01.022. - DOI - PubMed
-
- Seferovic PM, et al. Organization of heart failure management in European society of cardiology member countries: survey of the heart failure association of the European society of cardiology in collaboration with the heart failure national societies/working groups. Eur J Heart Fail. 2013;15(9):947–959. doi: 10.1093/eurjhf/hft092. - DOI - PubMed
Publication types
MeSH terms
Substances
LinkOut - more resources
Full Text Sources
Medical
Research Materials
Miscellaneous

