. 2022 Sep 12;24(1):62.
doi: 10.1186/s13058-022-01558-4.

MiRNA expression deregulation correlates with the Oncotype DX® DCIS score

Affiliations

MiRNA expression deregulation correlates with the Oncotype DX® DCIS score

Olivier Loudig et al. Breast Cancer Res. .

Abstract

Background: Current clinical criteria do not discriminate well between women who will or those who will not develop ipsilateral invasive breast cancer (IBC), or a DCIS recurrence after a ductal carcinoma in situ (DCIS) diagnosis. The 12-gene Oncotype DX® DCIS assay (RT qPCR gene-based scoring system) was established and shown to predict the risk of subsequent ipsilateral IBC or DCIS recurrence. Recent studies have shown that microRNA (miRNA) expression deregulation can contribute to the development of IBC, but very few have evaluated miRNA deregulation in DCIS lesions. In this study, we sought to determine whether specific miRNA expression changes may correlate with Oncotype DX® DCIS scores.

Methods: For this study, we used archived formalin-fixed, paraffin-embedded (FFPE) specimens from 41 women diagnosed with DCIS between 2012 and 2018. The DCIS lesions were stratified into low (n = 26), intermediate (n = 10), and high (n = 5) risk score groups using the Oncotype DX® DCIS assay. Total RNA was extracted from DCIS lesions by macro-dissection of unstained FFPE sections, and next-generation small-RNA sequencing was performed. We evaluated the correlation between miRNA expression data and Oncotype score, as well as patient age. RT-qPCR validations were performed to validate the topmost differentially expressed miRNAs identified between the different risk score groups.

Results: MiRNA sequencing of 32 FFPE DCIS specimens from the three different risk group scores identified a correlation between expression deregulation of 17 miRNAs and Oncotype scores. Our analyses also revealed a correlation between the expression deregulation of 9 miRNAs and the patient's age. Based on these results, a total of 15 miRNAs were selected for RT-qPCR validation. Of these, miR-190b (p = 0.043), miR-135a (p = 0.05), miR-205 (p = 0.00056), miR-30c (p = 0.011), and miR-744 (p = 0.038) showed a decreased expression in the intermediate/high Oncotype group when compared to the low-risk score group. A composite risk score was established using these 5 miRNAs and indicated a significant association between miRNA expression deregulation and the Oncotype DX® DCIS Score (p < 0.0021), between high/intermediate and low risk groups.

Conclusions: Our analyses identified a subset of 5 miRNAs able to discriminate between Oncotype DX® DCIS score subgroups. Together, our data suggest that miRNA expression analysis may add value to the predictive and prognostic evaluation of DCIS lesions.


Conflict of interest statement

The authors O.L., M.I.M., I.Z.B-D, and C.L. declare that they have no competing interests. S.F. declares having served on an expert panel for Genomic Health in 2017 and as an expert consult for AXDEV Group Inc.

Figures

Fig. 1
Fig. 1
DCIS sample processing and pathology across the Oncotype DX® DCIS score groups. A total of 41 DCIS specimens were selected for the study based on their Oncotype DX® DCIS classification into low (n = 26), intermediate (n = 10), and high (n = 5) risk score groups. Tissue-guided macro-dissection was performed on unstained formalin-fixed paraffin-embedded sections for selection of DCIS lesions prior to RNA extractions. All DCIS lesions evaluated in this study were estrogen receptor (ER) positive
Fig. 2
Fig. 2
DCIS sample distribution across the three Oncotype DX® DCIS risk groups between NGS and RT-qPCR molecular analyses. The Venn diagram displays the distribution of the individual DCIS samples between next-generation sequencing (NGS) in green and RT-qPCR analyses in blue. The three Oncotype DX® DCIS risk groups, including the low- (light green for NGS and light blue for RT-qPCR), intermediate- (mild green for NGS and mild blue for RT-qPCR), and high-risk (dark green for NGS and dark blue for RT-qPCR) groups separate each circle in three. The number of DCIS RNA samples per analysis (NGS or RT-qPCR) and per Oncotype DX® DCIS risk group are displayed in white in the different circles. Samples utilized for both assays are numbered in areas of the circles that intersect
Fig. 3
Fig. 3
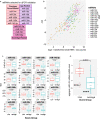
Correlation of top differentially expressed miRNAs with the three Oncotype DX® DCIS risk groups. Four small-RNA cDNA libraries were prepared using RNA samples collected from 32 individual FFPE DCIS specimens, with each library having an even representation of low-, intermediate-, and high-risk score Oncotype DX® DCIS RNA samples. a Individual box plot analyses of 17 differentially expressed miRNAs displaying a correlation with the different Oncotype DX® DCIS risk groups. b Box plot representation of the miRNA reads for the top 10 differentially expressed miRNAs and with distribution in each of the three Oncotype DX® DCIS risk groups. c Comparison of the miRNA composite risk score (obtained from the top 17 differentially expressed miRNAs) to the Oncotype DX® DCIS risk scores of the 32 DCIS samples evaluated by next-generation sequencing (NGS). d Box plot representation of the miRNA composite risk score for each individual Oncotype DX® DCIS risk groups, displaying significant miRNA expression differences between the low and intermediate (p < 0.018), intermediate and high (p < 0.01), and low and high (p < 0.00014) risk groups
Fig. 4
Fig. 4
Correlation of top differentially expressed miRNAs with patient age at the time of Oncotype DX® DCIS testing. a Box plot distribution of the top 12 differentially expressed miRNAs between three age-groups (groups#1 ≤ 55 (n = 6), group#2 56–70 (n = 17), and group#3 > 70 (n = 9) years old) with percentage of reads per miRNA. b Box plot representations of the top 9 differentially expressed miRNAs in the DCIS lesions from patients separated in the three different age-groups, with decreasing expression trends for 7 miRNAs (hsa-miR-135a-2-3p, hsa-miR-205, hsa-miR-212-5p, hsa-miR-19b, hsa-miR-19a, hsa-miR-212-3p, and hsa-miR-132), and an increasing expression trend for hsa-miR-551b and hsa-miR-592
Fig. 5
Fig. 5
RT-qPCR validation of the top 15 differentially expressed miRNAs between Oncotype DX® DCIS risk groups based on expression levels and age of patients. a Five Oncotype DX® DCIS risk score-related miRNAs, six age-related miRNAs, and four miRNAs based on a combination of Oncotype DX® DCIS risk score-related and patient age-related, identified by NGS analyses, were selected for RT-qPCR validations. b A positive correlation was observed for log2-transformed small-RNA sequencing read counts and RT-qPCR Ct values obtained for the top 15 differentially expressed miRNAs evaluated using RNA samples from DCIS lesions classified with Oncotype DX DCIS assay (see Fig. 2, RT-qPCR samples (n = 30). c Individual box plot evaluations of the 15 selected miRNAs measured by RT-qPCR in 30 samples (See Fig. 2), between low and high/intermediate Oncotype DX® DCIS risk score groups for identification of the top 5 differentially expressed miRNAs between the two groups (miR-135a, miR-190b, miR-205, miR-30c and miR-744). d Composite RT-qPCR miRNA score based on RT-qPCR expression of the 5 differentially expressed miRNAs. A highly significant expression difference (p < 0.0017) was obtained between the two Oncotype DX® DCIS risk groups (low and intermediate/high groups). The red dashed rectangle, in the low composite miRNA group (left), identifies DCIS specimen (i.e., Oncotype DX® DCIS low-risk score of 33 in Table 1) from patient DCIS-L7 who experienced an ipsilateral DCIS recurrence after 2 years of the initial DCIS diagnosis. The blue dashed rectangle, in the Int-High miRNA group (right), identifies DCIS specimen (i.e., Oncotype DX® DCIS intermediate risk score of 40 in Table 1), from the patient DCIS-I9 who experienced an ipsilateral invasive breast cancer recurrence after 2 years of the initial DCIS diagnosis

Similar articles

Cited by

  • How much do we know about the metastatic process?
    Rodriguez-Tirado C, Sosa MS. Rodriguez-Tirado C, et al. Clin Exp Metastasis. 2024 Aug;41(4):275-299. doi: 10.1007/s10585-023-10248-0. Epub 2024 Mar 23. Clin Exp Metastasis. 2024. PMID: 38520475 Free PMC article. Review.

References

    1. Vaidya Y, Vaidya P, Vaidya T. Ductal carcinoma in situ of the breast. Indian J Surg. 2015;77(2):141–6. doi: 10.1007/s12262-013-0987-0. - DOI - PMC - PubMed
    1. Allred DC. Ductal carcinoma in situ: terminology, classification, and natural history. J Natl Cancer Inst Monogr. 2010;41:134–138. doi: 10.1093/jncimonographs/lgq035. - DOI - PMC - PubMed
    1. Ward WH, DeMora L, Handorf E, et al. Preoperative delays in the treatment of DCIS and the associated incidence of invasive breast cancer. Ann Surg Oncol. 2020;27:386–396. doi: 10.1245/s10434-019-07844-4. - DOI - PMC - PubMed
    1. Siegel RL, Miller KD, Jemal A. Cancer statistics, 2018. CA Cancer J Clin. 2018;68(1):7–30. doi: 10.3322/caac.21442. - DOI - PubMed
    1. Kong J, Liu X, Zhang X, Zou Y. The predictive value of calcification for the grading of ductal carcinoma in situ in Chinese patients. Medicine (Baltimore) 2020;99(28):e20847. doi: 10.1097/MD.0000000000020847. - DOI - PMC - PubMed

Publication types

MeSH terms