. 2022 Sep 12;7(1):317.
doi: 10.1038/s41392-022-01131-7.

Elaiophylin triggers paraptosis and preferentially kills ovarian cancer drug-resistant cells by inducing MAPK hyperactivation

Affiliations

Elaiophylin triggers paraptosis and preferentially kills ovarian cancer drug-resistant cells by inducing MAPK hyperactivation

Guan-Nan Li et al. Signal Transduct Target Ther. .

Abstract

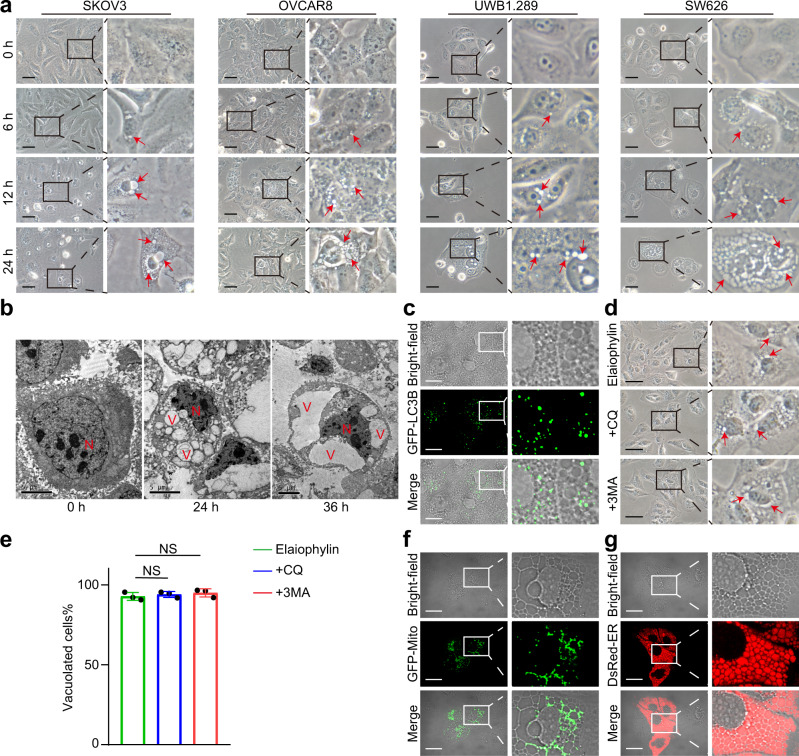
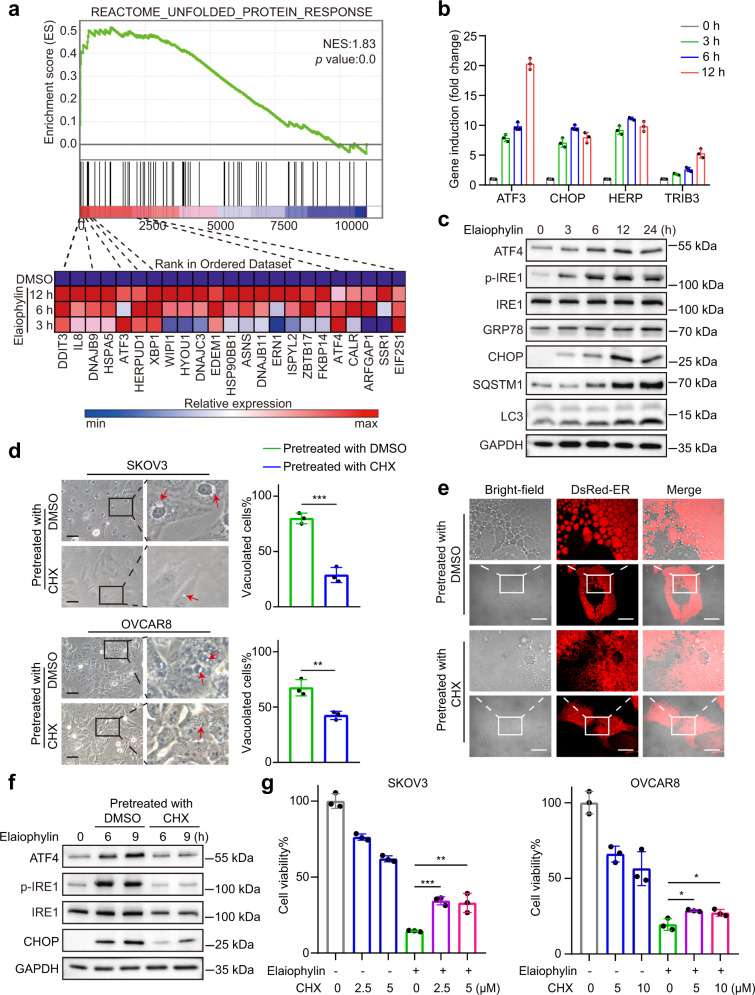
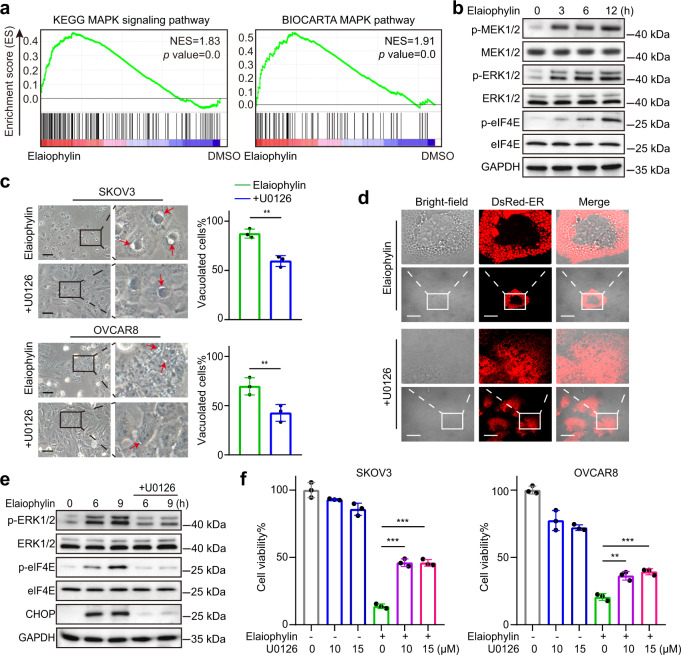
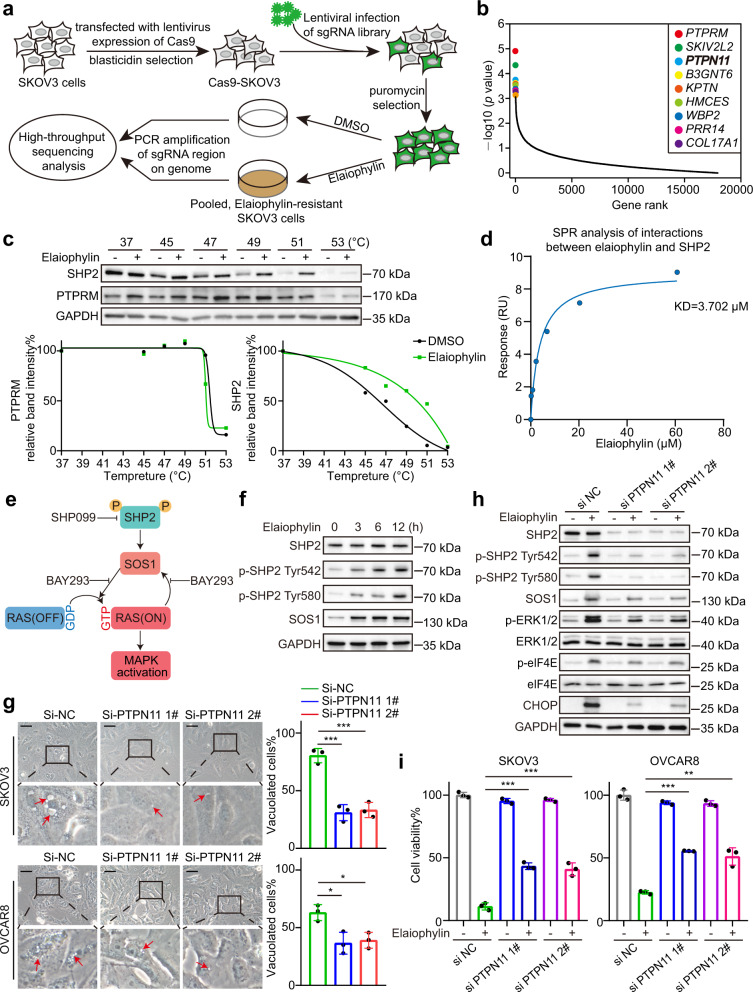
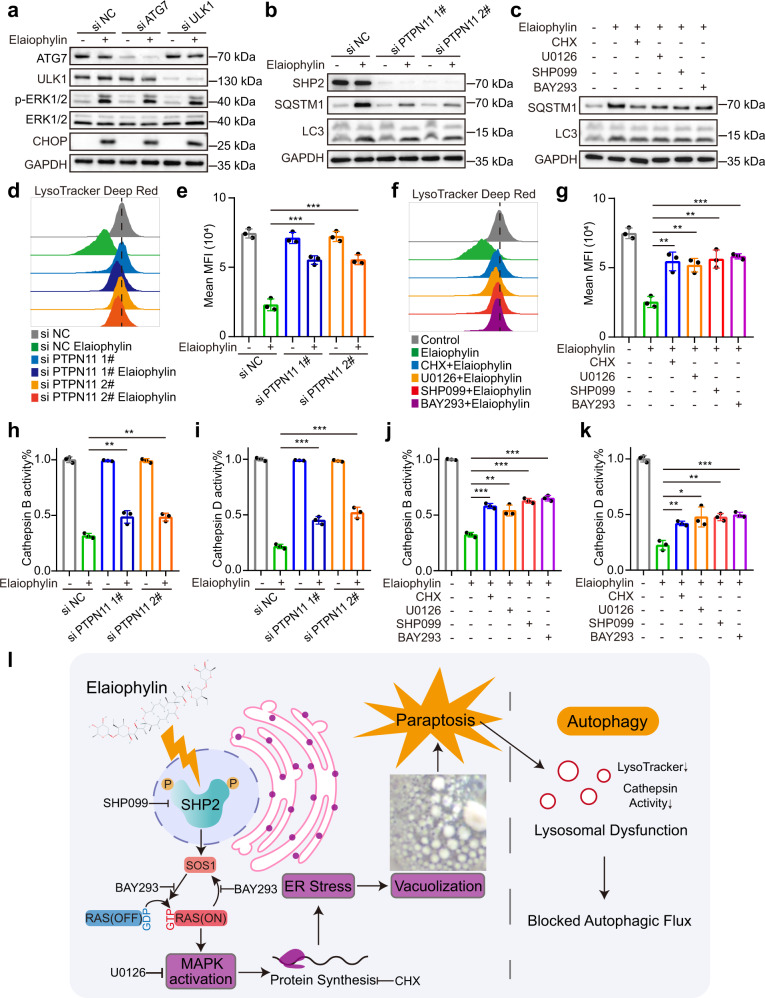
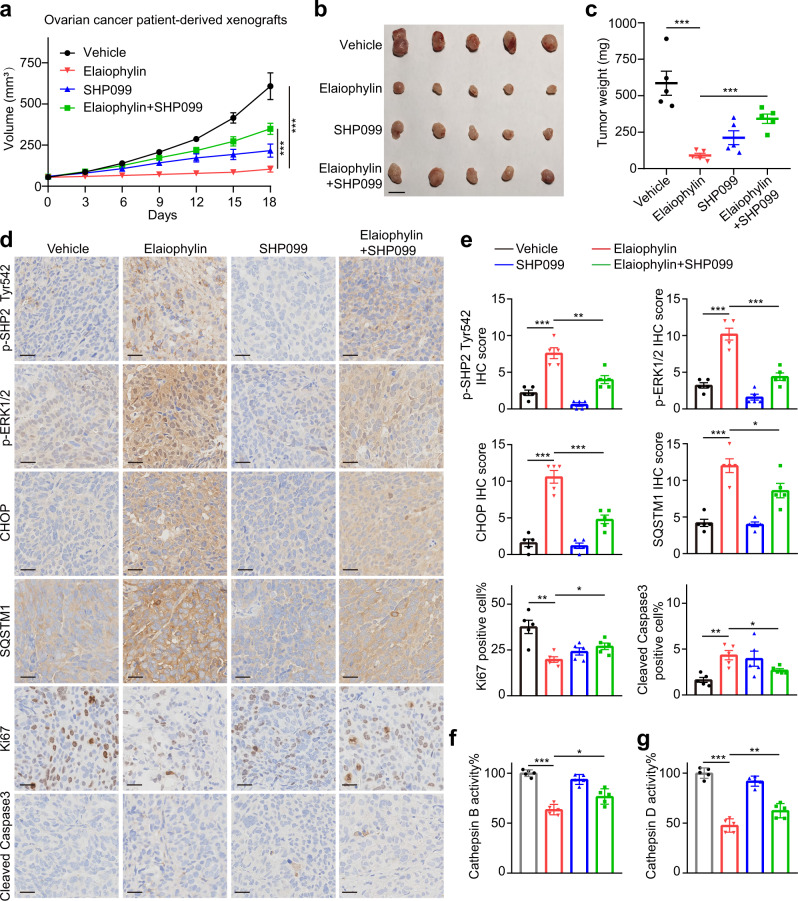
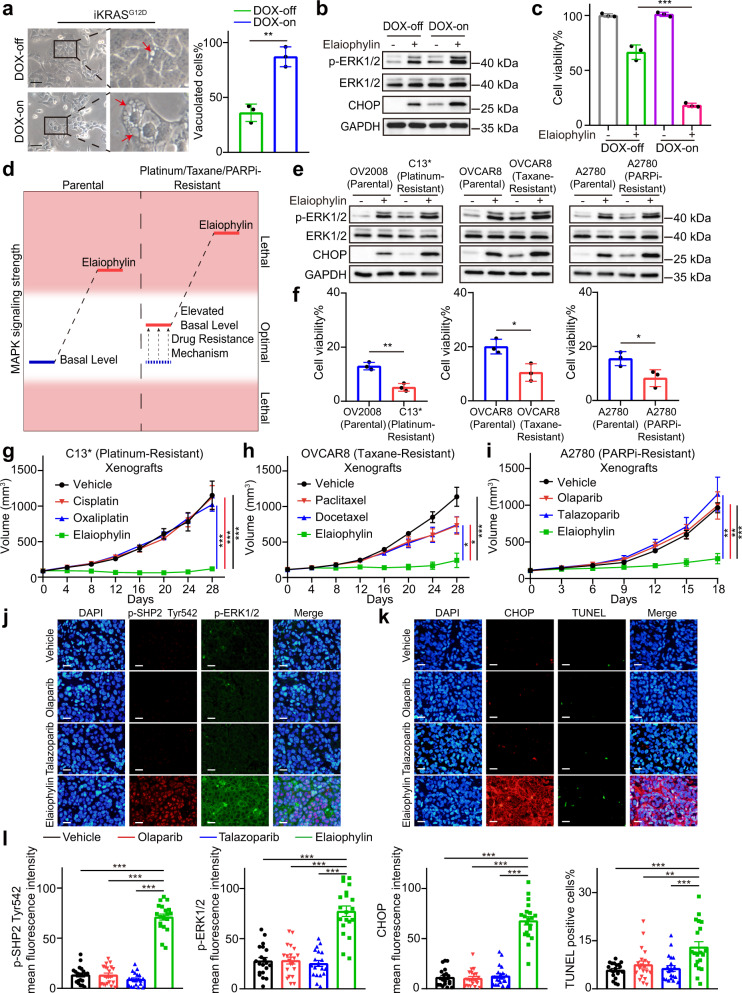
Finely tuned mitogen-activated protein kinase (MAPK) signaling is important for cancer cell survival. Perturbations that push cells out of the MAPK fitness zone result in cell death. Previously, in a screen of the North China Pharmaceutical Group Corporation's pure compound library of microbial origin, we identified elaiophylin as an autophagy inhibitor. Here, we demonstrated a new role for elaiophylin in inducing excessive endoplasmic reticulum (ER) stress, ER-derived cytoplasmic vacuolization, and consequent paraptosis by hyperactivating the MAPK pathway in multiple cancer cells. Genome-wide CRISPR/Cas9 knockout library screening identified SHP2, an upstream intermediary of the MAPK pathway, as a critical target in elaiophylin-induced paraptosis. The cellular thermal shift assay (CETSA) and surface plasmon resonance (SPR) assay further confirmed the direct binding between the SHP2 and elaiophylin. Inhibition of the SHP2/SOS1/MAPK pathway through SHP2 knockdown or pharmacological inhibitors distinctly attenuated elaiophylin-induced paraptosis and autophagy inhibition. Interestingly, elaiophylin markedly increased the already-elevated MAPK levels and preferentially killed drug-resistant cells with enhanced basal MAPK levels. Elaiophylin overcame drug resistance by triggering paraptosis in multiple tumor-bearing mouse models resistant to platinum, taxane, or PARPi, suggesting that elaiophylin might offer a reasonable therapeutic strategy for refractory ovarian cancer.


Conflict of interest statement

The authors declare no competing interests.

Figures

Fig. 1
Fig. 1
Elaiophylin induces ER-derived vacuoles in ovarian cancer cells. a SKOV3, OVCAR8, UWB1.289, and SW626 cells were exposed to 0.5 µM elaiophylin and observed by light microscopy. Arrows indicate cytoplasmic vacuoles. Scale bars: 50 µm. b SKOV3 cells were exposed to 0.5 µM elaiophylin and observed by transmission electron microscopy. N indicates cell nucleus. V indicates cytoplasmic vacuoles. Scale bars: 5 µm. c SKOV3 cells transfected with GFP-LC3B plasmid were exposed to 0.5 µM elaiophylin for 12 h, and observed under the confocal microscope. Representative bright-field and fluorescence images are shown. Scale bar: 20 µm. d SKOV3 cells were exposed to 0.5 µM elaiophylin alone or in combination with CQ (25 µM) or 3-MA (5 mM) for 12 h, and observed by light microscopy. Arrows indicate cytoplasmic vacuoles. Scale bar: 50 µm. e The proportion of cells displaying vacuoles in (d) was scored by visually examining at least 100 cells. Data are mean ± SD of three independent experiments (Two-tailed unpaired Student’s t-test, NS, p > 0.05). f, g SKOV3 cells expressing GFP-Mito (f) or DsRed-ER (g) were exposed to 0.5 µM elaiophylin for 12 h, and observed under the confocal microscope. Representative bright-field and fluorescence images are shown. Scale bar: 20 µm
Fig. 2
Fig. 2
Elaiophylin induces paraptosis in ovarian cancer cells. a Top: gene set enrichment analysis of the unfolded protein response in SKOV3 cells exposed to elaiophylin. Bottom: heatmaps of unfolded protein response gene sets in SKOV3 cells exposed to elaiophylin. b The mRNA relative expression of indicated genes in SKOV3 cells exposed to 0.5 µM elaiophylin. c Assessment of indicated protein levels using western blotting in SKOV3 cells exposed to 0.5 µM elaiophylin. d Left panel: light microscopy images of SKOV3 and OVCAR8 cells exposed for 9 h to 0.5 µM elaiophylin with pretreatment of DMSO or CHX (5 µM for 4 h). Arrows indicate cytoplasmic vacuoles. Scale bar: 50 µm. Right panel: proportion of cells displaying vacuoles was scored by visually examining at least 100 cells. Data are mean ± SD of three independent experiments (Two-tailed unpaired Student’s t test, **p < 0.01, ***p < 0.001). e Representative fluorescence and bright-field images of SKOV3 cells expressing DsRed-ER exposed to 0.5 µM elaiophylin for 9 h with pretreatment of DMSO or CHX (5 µM for 4 h). Scale bar: 20 µm. f Assessment of indicated protein levels using western blotting in SKOV3 cells exposed to 0.5 µM elaiophylin with pretreatment of DMSO or CHX (5 µM for 4 h). g The viability of SKOV3 and OVCAR8 cells exposed to 0.5 µM elaiophylin for 36 h with pretreatment of DMSO or CHX (4 h). Data are mean ± SD of three independent experiments (Two-tailed unpaired Student’s t test, *p < 0.05, **p < 0.01, ***p < 0.001)
Fig. 3
Fig. 3
Paraptosis triggered by elaiophylin is mediated by MAPKs. a Gene set enrichment analysis of MAPK pathway in SKOV3 cells exposed to elaiophylin. b Assessment of indicated protein levels using western blotting in SKOV3 cells exposed to 0.5 µM elaiophylin. c Left panel: light microscopy images of SKOV3 and OVCAR8 cells exposed to 0.5 µM elaiophylin alone or in combination with U0126 (15 µM) for 9 h. Arrows indicate cytoplasmic vacuoles. Scale bar: 50 µm. Right panel: proportion of cells displaying vacuoles was scored by visually examining at least 100 cells. Data are mean ± SD of three independent experiments (Two-tailed unpaired Student’s t test, **p < 0.01). d Representative fluorescence and bright-field images of SKOV3 cells expressing DsRed-ER exposed to 0.5 µM elaiophylin alone or in combination with U0126 (15 µM) for 9 h. Scale bar: 20 µm. e Assessment of indicated protein levels using western blotting in SKOV3 cells exposed to 0.5 µM elaiophylin alone or in combination with U0126 (15 µM). f The viability of SKOV3 cells exposed to 0.5 µM elaiophylin alone or in combination with U0126 for 36 h. Data are mean ± SD of three independent experiments (Two-tailed unpaired Student’s t-test, **p < 0.01, ***p < 0.001)
Fig. 4
Fig. 4
CRISPR library screening identifies PTPN11 as a critical gene for elaiophylin-induced paraptosis. a A diagram for the genome-wide CRISPR/Cas9 knockout library screening. b Elaiophylin selection identified potential target genes. The top 10 positive selected genes were ranked by p value. c Top: SKOV3 cells were exposed for 24 h to DMSO or 0.5 µM elaiophylin and subject to CETSA. Bottom: the intensity of the SHP2 bands or PTPRM bands was quantified to exhibit the binding affinity of elaiophylin to SHP2 or PTPRM in SKOV3 cells. d SPR analysis showing direct interaction between elaiophylin and human recombinant SHP2 protein at the molecular level. e Pattern diagram of SHP2/SOS1/MAPK pathway. f Assessment of indicated protein levels using western blotting in SKOV3 cells exposed to 0.5 µM elaiophylin. g Left panel: representative light microscopy images of SKOV3 and OVCAR8 cells exposed to 0.5 µM elaiophylin for 9 h after PTPN11 knockdown. Arrows indicate cytoplasmic vacuoles. Scale bar: 50 µm. Right panel: proportion of cells displaying vacuoles was scored by visually examining at least 100 cells. Data are mean ± SD of three independent experiments (Two-tailed unpaired Student’s t test, *p < 0.05, ***p < 0.001). h Assessment of indicated protein levels using western blotting in SKOV3 cells exposed to 0.5 µM elaiophylin for 9 h after PTPN11 knockdown. i The viability of SKOV3 and OVCAR8 cells exposed to 0.5 µM elaiophylin for 36 h after PTPN11 knockdown. Data are mean ± SD of three independent experiments (Two-tailed unpaired Student’s t test, **p < 0.01, ***p < 0.001)
Fig. 5
Fig. 5
Elaiophylin-induced paraptosis partially contributes to autophagy inhibition by impairing lysosomal function. a Assessment of indicated protein levels using western blotting in SKOV3 cells exposed to 0.5 µM elaiophylin for 9 h after ATG7 or ULK1 knockdown. b Assessment of indicated protein levels using western blotting in SKOV3 cells exposed to 0.5 µM elaiophylin for 24 h after PTPN11 knockdown. c Assessment of indicated protein levels using western blotting in SKOV3 cells exposed to 0.5 µM elaiophylin for 24 h alone, or in combination with CHX (5 µM pretreatment for 4 h), U0126 (15 µM), SHP099 (30 µM), BAY293 (5 µM), respectively. d FACS analysis of LysoTracker Deep Red in SKOV3 cells exposed to 0.5 µM elaiophylin for 24 h after PTPN11 knockdown. e Mean fluorescence intensities in (d) were quantified. Data are mean ± SD of three independent experiments (Two-tailed unpaired Student’s t test, ***p < 0.001). f FACS analysis of LysoTracker Deep Red in SKOV3 cells exposed to 0.5 µM elaiophylin for 24 h alone, or in combination with CHX (5 µM pretreatment for 4 h), U0126 (15 µM), SHP099 (30 µM), BAY293 (5 µM), respectively. g Mean fluorescence intensities in (f) were quantified. Data are mean ± SD of three independent experiments (Two-tailed unpaired Student’s t-test, **p < 0.01, ***p < 0.001). h, i SKOV3 cells were exposed to 0.5 µM elaiophylin for 36 h after PTPN11 knockdown, and subject to enzymatic activity determination of CTSB (h) and CTSD (i). Data are mean ± SD of three independent experiments (Two-tailed unpaired Student’s t test, **p < 0.01, ***p < 0.001). j, k SKOV3 cells were exposed to 0.5 µM elaiophylin alone for 36 h, or in combination with CHX (5 µM pretreatment for 4 h), U0126 (15 µM), SHP099 (30 µM), BAY293 (5 µM), respectively, and subject to enzymatic activity determination of CTSB (j) and CTSD (k). Data are mean ± SD of three independent experiments (Two-tailed unpaired Student’s t test, *p < 0.05, **p < 0.01, ***p < 0.001). l A schematic diagram of paraptosis and consequent autophagy inhibition induced by elaiophylin. Chemical structure depiction of elaiophylin was obtained from NCBI, PubChem Compound Summary for CID 6444206, Elaiophylin. Retrieved 2 January, 2022 from https://pubchem.ncbi.nlm.nih.gov/compound/Elaiophylin
Fig. 6
Fig. 6
SHP2 inhibition attenuates the effects of elaiophylin in PDX models. a PDX models were established on female NOG mice using the tumor tissues from a high-grade serous ovarian cancer patient, and were treated with vehicle, elaiophylin (2 mg/kg/d), SHP099 (30 mg/kg/d), or the combination of elaiophylin (2 mg/kg/d) and SHP099 (30 mg/kg/d) (n = 5 in each group). From the beginning of treatment, tumor volumes were measured to plot tumor growth curves. Data are mean ± SEM (Two-tailed unpaired Student’s t test, ***p < 0.001). b Photograph of resected tumor tissues from PDX models. Scale bar: 1 cm. c Quantification of tumor weight in (b). Data are mean ± SEM (Two-tailed unpaired Student’s t test, ***p < 0.001). d Representative images of immunohistochemical staining with indicated antibodies in tumor specimens from (b). Scale bar: 25 µm. e Quantification of immunohistochemical scores in (d). Five sections were assessed per group and the mean of four randomly selected viewing fields were evaluated for every section. Data are mean ± SEM (Two-tailed unpaired Student’s t-test, *p < 0.05, **p < 0.01, ***p < 0.001). f, g Enzymatic activity of CTSB (f) and CTSD (g) in tumor tissues from (b). The results are presented as percentages of the vehicle group. Data are mean ± SEM (Two-tailed unpaired Student’s t test, n = 5, *p < 0.05, **p < 0.01, ***p < 0.001)
Fig. 7
Fig. 7
Elaiophylin exploits MAPK activation as a vulnerability in drug-resistant ovarian cancer. a Left panel: representative light microscopy images of doxycycline (DOX)-inducible iKRAS cells cultured in the absence or presence of DOX (2 μg/mL) for 48 h and exposed to 0.75 µM elaiophylin for 6 h. Arrows indicate cytoplasmic vacuoles. Scale bar: 50 µm. Right panel: proportion of cells displaying vacuoles was scored by visually examining at least 100 cells. Data are mean ± SD of three independent experiments (Two-tailed unpaired Student’s t test, **p < 0.01). b Assessment of indicated protein levels using western blotting in iKRAS cells cultured in the absence or presence of DOX (2 μg/mL) for 48 h and then exposed to 0.75 µM elaiophylin for 6 h. c The viability of iKRAS cells cultured in the absence or presence of DOX (2 μg/mL) for 48 h and then exposed to 0.75 µM elaiophylin for 24 h. Data represent three independent experiments and are shown as mean ± SD (Two-tailed unpaired Student’s t test, ***p < 0.001). d A schematic diagram of elaiophylin-induced MAPK activation in parental and resistant cells. e Assessment of indicated protein levels using western blotting in indicated parental and resistant cells exposed to 0.5 µM elaiophylin for 6 h. f The viability of indicated parental and resistant cells exposed to 0.5 µM elaiophylin for 36 h. The results are presented as percentages of the control. Data are mean ± SD of three independent experiments (Two-tailed unpaired Student’s t test, *p < 0.05, **p < 0.01). g Female immune-deficient BALB/c nu/nu (nude) mice were inoculated subcutaneously with C13* cells and were treated with vehicle, cisplatin (10 mg/kg/2d), oxaliplatin (10 mg/kg/2d), or elaiophylin (2 mg/kg/d) (n = 5 in each group). From the beginning of treatment, tumor volumes were measured to plot tumor growth curves. Data are mean ± SEM (Two-tailed unpaired Student’s t test, ***p < 0.001). h Female immune-deficient BALB/c nu/nu (nude) mice were inoculated subcutaneously with OVCAR8 (taxane-resistant) cells and were treated with vehicle, paclitaxel (30 mg/kg/2d), docetaxel (30 mg/kg/2d), or elaiophylin (2 mg/kg/d) (n = 5 in each group). From the beginning of treatment, tumor volumes were measured to plot tumor growth curves. Data are mean ± SEM (Two-tailed unpaired Student’s t test, *p < 0.05, ***p < 0.001). i Female immune-deficient BALB/c nu/nu (nude) mice were inoculated subcutaneously with A2780 (PARPi-resistant) cells and were treated with vehicle, olaparib (50 mg/kg/d), talazoparib (0.33 mg/kg/d), or elaiophylin (2 mg/kg/d) (n = 5 in each group). From the beginning of treatment, tumor volumes were measured to plot tumor growth curves. Data are mean ± SEM (Two-tailed unpaired Student’s t test, **p < 0.01, ***p < 0.001). j Sections of tumors from (i) were stained using p-SHP2 Tyr542 antibody (red), p-ERK1/2 antibody (green), and DAPI (blue). Representative sections are shown. Scale bar: 20 µm. k Sections of tumors from (i) were stained using CHOP antibody (red), DAPI (blue), and using TUNEL assay (green). Representative sections are shown. Scale bar: 20 µm. l Quantification of the mean fluorescence intensity and TUNEL-positive proportion in (j) and (k). Four randomly selected viewing fields were individually evaluated per section and five sections were assessed per group. Data are mean ± SEM (Two-tailed unpaired Student’s t test, **p < 0.01, ***p < 0.001)

References

    1. Yuan J, Dong X, Yap J, Hu J. The MAPK and AMPK signalings: interplay and implication in targeted cancer therapy. J. Hematol. Oncol. 2020;13:113. doi: 10.1186/s13045-020-00949-4. - DOI - PMC - PubMed
    1. Santarpia L, Lippman SM, El-Naggar AK. Targeting the MAPK-RAS-RAF signaling pathway in cancer therapy. Expert Opin. Ther. Targets. 2012;16:103–119. doi: 10.1517/14728222.2011.645805. - DOI - PMC - PubMed
    1. Nazarian R, et al. Melanomas acquire resistance to B-RAF(V600E) inhibition by RTK or N-RAS upregulation. Nature. 2010;468:973–977. doi: 10.1038/nature09626. - DOI - PMC - PubMed
    1. Das Thakur M, et al. Modelling vemurafenib resistance in melanoma reveals a strategy to forestall drug resistance. Nature. 2013;494:251–255. doi: 10.1038/nature11814. - DOI - PMC - PubMed
    1. Leung GP, et al. Hyperactivation of MAPK Signaling Is Deleterious to RAS/RAF-mutant Melanoma. Mol. Cancer Res. 2019;17:199–211. doi: 10.1158/1541-7786.MCR-18-0327. - DOI - PubMed

Publication types