. 2022 Sep 12;5(1):956.
doi: 10.1038/s42003-022-03882-z.

Transmembrane helices mediate the formation of a stable ternary complex of b5R, cyt b5, and SCD1

Affiliations

Transmembrane helices mediate the formation of a stable ternary complex of b5R, cyt b5, and SCD1

Jiemin Shen et al. Commun Biol. .

Abstract

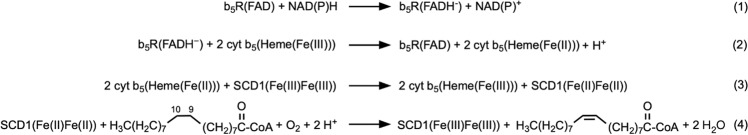
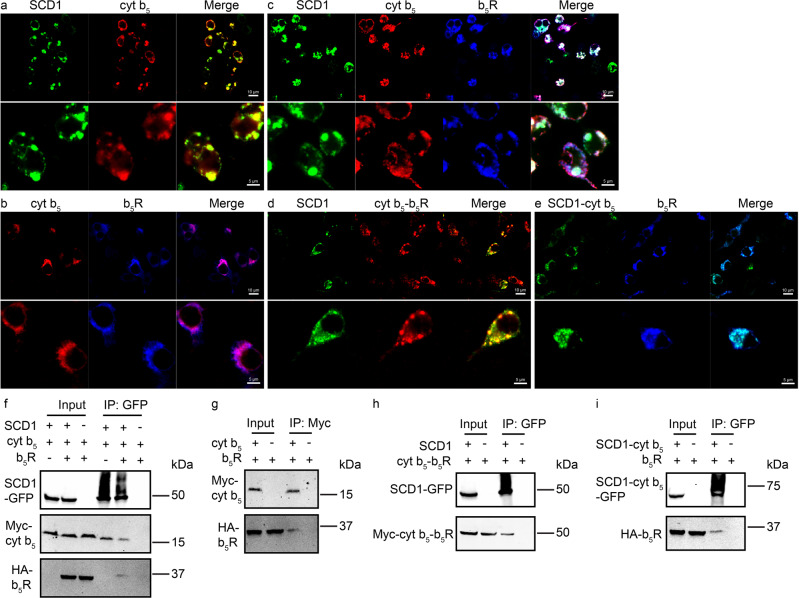
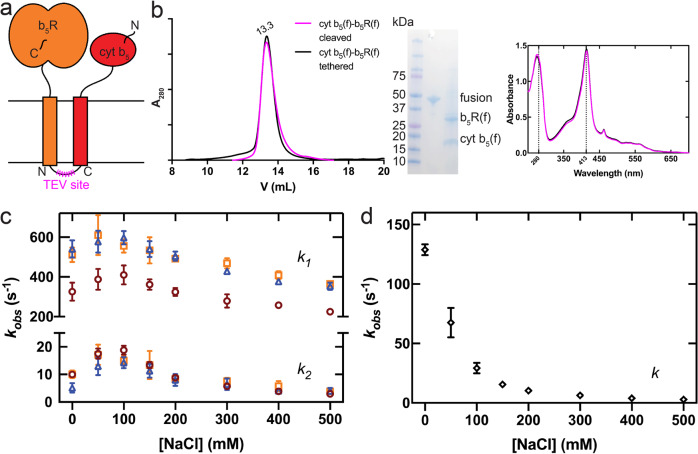
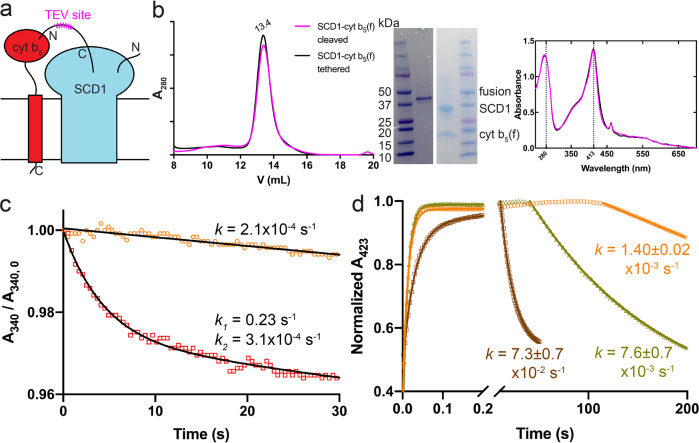
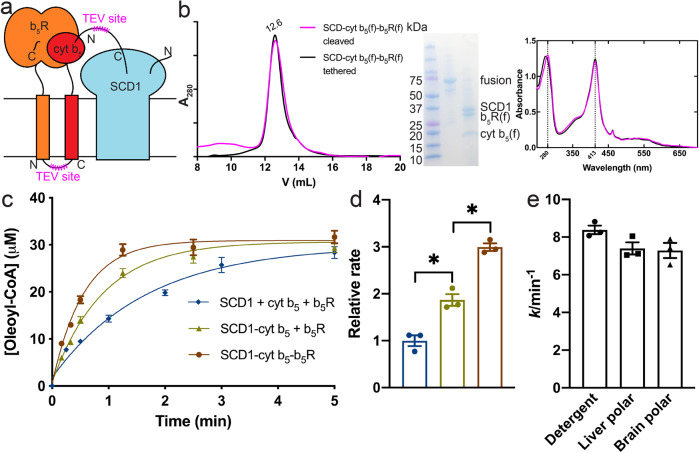
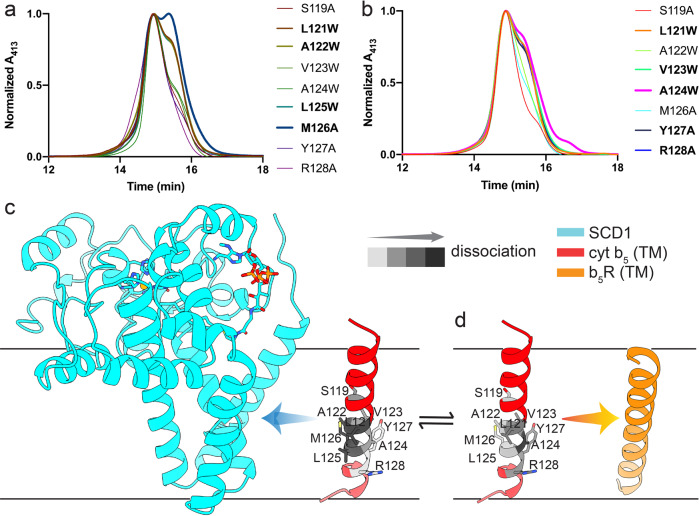
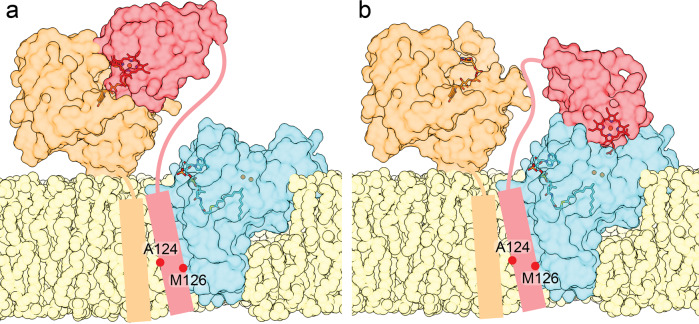
Mammalian cytochrome b5 (cyt b5) and cytochrome b5 reductase (b5R) are electron carrier proteins for membrane-embedded oxidoreductases. Both b5R and cyt b5 have a cytosolic domain and a single transmembrane (TM) helix. The cytosolic domains of b5R and cyt b5 contain cofactors required for electron transfer, but it is not clear if the TM helix has function beyond being an anchor to the membrane. Here we show that b5R and cyt b5 form a stable binary complex, and so do cyt b5 and stearoyl-CoA desaturase-1 (SCD1). We also show that b5R, cyt b5 and SCD1 form a stable ternary complex. We demonstrate that the TM helices are required for the assembly of stable binary and ternary complexes where electron transfer rates are greatly enhanced. These results reveal a role of the TM helix in cyt b5 and b5R, and suggest that an electron transport chain composed of a stable ternary complex may be a general feature in membrane-embedded oxidoreductases that require cyt b5 and b5R.


Conflict of interest statement

The authors declare no competing interests.

Figures

Fig. 1
Fig. 1. Stepwise reactions in the electron transport chain of b5R, cyt b5, and SCD1.
The redox states of cofactors in proteins are indicated in the parentheses.
Fig. 2
Fig. 2. Colocalization and co-immunoprecipitation (co-IP) of SCD1, cyt b5, b5R, and their binary fusions.
Confocal microscopy images show the subcellular distribution and colocalization of a SCD1-GFP (green) and Myc-cyt b5 (red); b Myc-cyt b5 (red) and HA-b5R (blue); c SCD1-GFP (green), Myc-cyt b5 (red), and HA-b5R (blue); d SCD1-GFP (green) and Myc-cyt b5-b5R (red); e SCD1-cyt b5-GFP (green) and HA-b5R (blue). ae Images in the top and bottom panels are from the same samples of different magnifications. White scale bars represent 10 µm for the top panels and 5 µm for the bottom panels. f Co-IP of SCD1, cyt b5, and b5R. Cells co-expressing SCD1-GFP and Myc-cyt b5 (left lane) were solubilized, and the lysate was immunoprecipitated with GFP nanobody-conjugated resins. Detection of Myc-cyt b5 after extensive wash of the resins indicates some stable complex assembly between SCD1 and cyt b5. Similarly, ternary complex formation was demonstrated from cells co-expressing tagged SCD1, cyt b5, and b5R (middle lanes). The lysate from cells expressing tagged cyt b5 and b5R (right lane) served as a negative control to exclude the possibility of non-specific binding of cyt b5 and b5R to resins and non-specificity of antibodies used in western blots. g Co-IP of cyt b5 and b5R shows the existence of some stable cyt b5-b5R complex. Unlike in f, lysates were immunoprecipitated with anti-Myc antibodies and protein A resins to capture Myc-cyt b5. h Co-IP of SCD1 with the binary fusion of cyt b5-b5R. i Co-IP of the binary fusion of SCD1-cyt b5 with b5R. For all the input lanes, 6% of cell lysate was loaded. IP, immunoprecipitation. All the data are from one representative experiment of at least two independent repeats.
Fig. 3
Fig. 3. Full-length cyt b5 and full-length b5R can form a stable complex with faster electron transfer kinetics.
a Schematic diagram of cyt b5-b5R fusion constructs. The N and C denote the N-terminus and C-terminus of cyt b5 and b5R. The magenta zigzag line indicates the placement of a TEV protease site on the linker region connecting the cyt b5 and b5R. b Size-exclusion chromatography (SEC) profile (left), SDS-PAGEl image (inset), and UV-Vis spectra (right) of the linker-cleaved (magenta) and tethered (black) fusion of SCD1-cyt b5. Almost identical SEC profiles and optical spectra suggest the stable assembly between cyt b5 and b5R. c Ionic strength-dependent electron transfer in different constructs of cyt b5–b5R: linker-cleaved full-length (orange); tethered full-length (blue); tethered soluble without TM domains (red). The upper and lower half of the plot represent the rate constants of the fast phase (k1) and the slow phase (k2), respectively. d Ionic strength-dependent electron-transfer between individual b5R and cyt b5. Different from those of cyt b5-b5R fusions, the time courses with individual b5R and cyt b5 are monophasic. Error bars represent standard error of the mean (SEM) from three independent repeats (n = 3).
Fig. 4
Fig. 4. SCD1 and full-length cyt b5 can form a stable complex with faster electron transfer kinetics.
a Schematic diagram of SCD1-cyt b5 fusion constructs. b SEC profile (left), SDS-PAGE image (inset), and UV-Vis spectra (right) of the linker-cleaved (magenta) and tethered (black) fusion of SCD1-cyt b5. Almost identical SEC profile and optical spectra suggest the stable assembly between SCD1 and cyt b5. c Biphasic kinetics of NADH consumption by b5R with SCD1-cyt b5 fusion in the presence of substrate stearoyl-CoA (red) compared to the slow linear decrease of NADH in the absence of substrate (orange). The absorbance of NADH at 340 nm (A340) was measured and the y axis is the normalized A340 against the initial values (A340, 0). Excess NADH was used in the measurements. d The accelerated electron transfer between reduced cyt b5 and SCD1 in the SCD1-cyt b5 complex (brown) compared to that between the individual cyt b5 and SCD1 (yellow) and auto-oxidation of cyt b5 (orange). The Soret absorbance of reduced cyt b5 at 423 nm was monitored. One molar equivalent of NADH was added, which resulted in the initial rising phases of the fast electron transfer to cyt b5 via b5R. Rate constants (k) are denoted as mean ± SEM calculated from three independent repeats (n = 3).
Fig. 5
Fig. 5. SCD1, full-length cyt b5, and full-length b5R can form a stable complex with faster electron transfer kinetics.
a Schematic diagram of SCD1-cyt b5 fusion constructs. b SEC profile (left), SDS-PAGE image (inset), and UV-Vis spectra (right) of the linker-cleaved (magenta) and tethered (black) fusion of SCD1-cyt b5-b5R. Almost identical SEC profile and optical spectra suggest the stable assembly among SCD1, cyt b5, and b5R. c Time courses of oleoyl-CoA production (n = 3) in: individual SCD1, cyt b5 and b5R (blue); the binary complex of SCD1-cyt b5 and individual b5R (yellow); the ternary complex of SCD1-cyt b5-b5R (brown). d Initial rate comparison among conditions in c (n = 3). Asterisks indicate significant different (p < 0.05) in pairwise t tests. e Initial rates of the SCD1-cyt b5-b5R complex in detergent or liposomes. Error bars represent SEM from three independent repeats (n = 3).
Fig. 6
Fig. 6. Mutations on the TM domains of SCD1, cyt b5, and b5R partially disrupt the stable complex assembly of the SCD1-cyt b5 and the cyt b5-b5R.
SEC profiles of: a linker-cleaved SCD1-cyt b5 complexes, and b linker-cleaved cyt b5-b5R complexes with mutations on TM domains. Residues on the TM helix of cyt b5 were mutated to either an Ala from a polar or large hydrophobic residue or a bulky Trp from a small hydrophobic residue. The absorbance at 413 nm from the heme group in cyt b5 was monitored. Mutants causing highest complex dissociation were highlighted. The model of complex assembly in: c SCD1 (cyan) and TM helix of cyt b5 (red); and d TM helix of cyt b5 (red) and b5R (orange). Residues important for complex assembly are shown as sidechain sticks and are colored per their degree of causing complex dissociation when mutated based on results in a, b. Darker color represents a larger effect on disrupting complex assembly. One-sided arrows indicate the side of the TM helix of cyt b5 participating in the binary complex formation.
Fig. 7
Fig. 7. Model of the stable SCD1-cyt b5-b5R complex.
SCD1 (cyan), cyt b5 (red), and b5R (orange) are shown as translucent surfaces highlighting the diiron center (orange sphere) and acyl-CoA (cyan stick) in SCD1, heme (deep red stick) in cyt b5, and FAD (brown stick) in b5R. SCD1 forms a complex with the TM helix of cyt b5 and b5R in lipid bilayer (yellow). The relative positions of two residues on the TM helix of cyt b5 are marked. A flexible linker connecting the soluble domain of cyt b5 and b5R to their TM helix allows the transition of two states: a cyt b5 receiving an electron from b5R; and b cyt b5 delivering an electron to SCD1.

Similar articles

Cited by

References

    1. Schenkman JB, Jansson I. The many roles of cytochrome b5. Pharm. Ther. 2003;97:139–152. doi: 10.1016/S0163-7258(02)00327-3. - DOI - PubMed
    1. Elahian F, Sepehrizadeh Z, Moghimi B, Mirzaei SA. Human cytochrome b5 reductase: structure, function, and potential applications. Crit. Rev. Biotechnol. 2014;34:134–143. doi: 10.3109/07388551.2012.732031. - DOI - PubMed
    1. Yamada M, et al. Elucidations of the catalytic cycle of NADH-cytochrome b5 reductase by X-ray crystallography: new insights into regulation of efficient electron transfer. J. Mol. Biol. 2013;425:4295–4306. doi: 10.1016/j.jmb.2013.06.010. - DOI - PubMed
    1. Vergeres G, Waskell L. Cytochrome b5, its functions, structure and membrane topology. Biochimie. 1995;77:604–620. doi: 10.1016/0300-9084(96)88176-4. - DOI - PubMed
    1. Ackerman D, Simon MC. Hypoxia, lipids, and cancer: surviving the harsh tumor microenvironment. Trends Cell Biol. 2014;24:472–478. doi: 10.1016/j.tcb.2014.06.001. - DOI - PMC - PubMed

Publication types