. 2022 Sep 12;5(1):954.
doi: 10.1038/s42003-022-03869-w.

The choanoflagellate pore-forming lectin SaroL-1 punches holes in cancer cells by targeting the tumor-related glycosphingolipid Gb3

Affiliations

The choanoflagellate pore-forming lectin SaroL-1 punches holes in cancer cells by targeting the tumor-related glycosphingolipid Gb3

Simona Notova et al. Commun Biol. .

Abstract

Choanoflagellates are primitive protozoa used as models for animal evolution. They express a large variety of multi-domain proteins contributing to adhesion and cell communication, thereby providing a rich repertoire of molecules for biotechnology. Adhesion often involves proteins adopting a β-trefoil fold with carbohydrate-binding properties therefore classified as lectins. Sequence database screening with a dedicated method resulted in TrefLec, a database of 44714 β-trefoil candidate lectins across 4497 species. TrefLec was searched for original domain combinations, which led to single out SaroL-1 in the choanoflagellate Salpingoeca rosetta, that contains both β-trefoil and aerolysin-like pore-forming domains. Recombinant SaroL-1 is shown to bind galactose and derivatives, with a stronger affinity for cancer-related α-galactosylated epitopes such as the glycosphingolipid Gb3, when embedded in giant unilamellar vesicles or cell membranes. Crystal structures of complexes with Gb3 trisaccharide and GalNAc provided the basis for building a model of the oligomeric pore. Finally, recognition of the αGal epitope on glycolipids required for hemolysis of rabbit erythrocytes suggests that toxicity on cancer cells is achieved through carbohydrate-dependent pore-formation.


Conflict of interest statement

The authors declare no competing interests.

Figures

Fig. 1
Fig. 1. Classification of β-trefoil lectins according to the TrefLec database.
a Selected examples of β-trefoil lectins from different classes. The binding peptide is represented by a rainbow-colored ribbon, the bound sugar by sticks, and the conserved hydrophobic core-forming amino acids by spheres. b Sunburst statistics for predicted β-trefoil lectins in different classes, in selected domains of life. c Classification of predicted β-trefoil lectins and distribution of sequences in the TrefLec database. d Prediction of β-trefoil lectins with an aerolysin domain based on the corresponding CATH domain (CATH entry 2.170.15.10).
Fig. 2
Fig. 2. SaroL-1 sequence information.
a Exerpt of the TrefLec page of the predicted lectin from Salpingoeca rosetta with information about the protein, the domains and the gene. b Peptide sequence of SaroL-1 with separation of the domains and alignment of lobes for the β-trefoil domain. Amino acids corresponding to the signature of Mytilec-like class are highlighted in yellow, amino acids predicted to be involved in carbohydrate binding in green, and amino acids involved in the hydrophobic core in blue.
Fig. 3
Fig. 3. SaroL-1 recognizes αGal-containing ligands.
a Representative ITC isotherms of SaroL-1 with αGal1-4Gal (green), GalNAc (red), and lactose (βGal1-4Glc) (cyan), b Comparison of KA values of various binding partners for SaroL-1, c 200 nM of SaroL-1 (green) binds to GUVs (red; fluorescent lipid Atto 647 N) functionalised with either FSL-Gb3, Gb3 wt, FSL-iGb3, and lactosylceramide (Lac-cer). SaroL-1 induces tubular membrane invaginations in some cases, as visible for FSL-Gb3 GUVs and SaroL-1 clustering on GUVs, as visible for Gb3 wt, FSL-iGb3 and Lac-Cer GUVs. GUVs without functional group (DOPC) serves as negative control and show no binding of SaroL-1. The GUVs were composed of DOPC, cholesterol, glycolipid of choice, and membrane dye to the molar ratio of 64.7:30:5:0.3, respectively. Scale bars are 10 μm.
Fig. 4
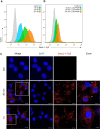
Fig. 4. SaroL-1 shows dose-dependent binding and intracellular uptake into H1299 cells.
a Histograms of fluorescence intensity of gated living H1299 cells incubated for 30 min at 4 °C with increasing concentrations of SaroL-1-Cy5 (grey, dotted histogram: negative control, blue: 55 nM, green: 135 nM, orange: 271 nm). Shifts in fluorescence intensity indicated that SaroL-1 binds to the H1299 cell surface in a dose-dependent manner. b Histogram of fluorescence intensity of gated living H1299 cells pre-treated for 72 h with the GSL synthesis inhibitor PPMP and incubated for 30 min at 4 °C with increasing concentrations of SaroL-1-Cy5 (grey, dotted histogram: negative control, blue: 55 nM, green: 135 nM, orange: 271 nm). In the absence of glucosylceramide-based GSLs, including Gb3, the binding of SaroL-1 to the plasma membrane was remarkably reduced. c Confocal imaging of H1299 human lung epithelial cells incubated with 271 nM Cy5-conjugated SaroL-1 (red) for indicated time points at 37 °C. The fluorescent signals accumulate partially at the plasma membrane and in the intracellular space of treated cells. Nuclei were counterstained by DAPI. Scale bars represent 10 μm.
Fig. 5
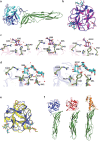
Fig. 5. Crystal structure of SaroL-1.
a Cartoon representation of monomeric SaroL-1 in complex with GalNAc. β-trefoil-domain colored in blue and aerolysin domain in green. The GalNAc ligands are displayed in their electron density map as sticks. b Superimposition of β-trefoil lectin domains, (7QE4, light magenta), (7R55, blue) in complex with 3 molecules of GalNAc (violet) and 2 molecules of Gb3 (cyan). c Zoom on α, β and γ binding sites with GalNAc (violet) polar contacts are represented as dashed lines and bridging water molecules as red spheres. d Zoom on the interactions with Gb3 (cyan) in binding β and γ sites, polar contacts are represented as dashed lines and bridging water molecules as red spheres. e Overlay of β-trefoil domains of SaroL-1 (blue) in complex with Gb3 (cyan) and of monomeric CGL (5F90) (yellow) in complex with Gb3 and αGal1-4Gal (yellow). f Comparison of the structures of monomeric SaroL-1, pore-forming lectin LSL (1W3A) and ε-toxin (1UYJ) from left to right. The pro-aerolysin domain is colored in green and the membrane-binding domain in blue (SaroL-1), red (LSL) and orange (ε-toxin).
Fig. 6
Fig. 6. Pore-forming and hemolytic activity of SaroL-1.
a SaroL-1 (unlabeled, 200 nM) triggers the influx of 3 kDa dextran-AF488 (green) into wt Gb3-containing GUVs (red) via its pore-forming activity. In the control group without SaroL-1, there was no visible influx of dextran-AF488 detected. Yellow arrows indicate events of dextran-AF488 influx to wt Gb3-containing GUVs. The GUVs were composed of DOPC, cholesterol, wt Gb3, and membrane dye to the molar ratio of 64.7:30:5:0.3, respectively. The scale bars represent 10 µm. b Kinetics of SaroL-1 driven dextran-AF488 influx to wt Gb3-containing GUVs. Mean values ± SD are shown. Data represent three independent experiments, n = 3. The molecular weight of fluorescently labelled dextran is 3 kDa. The total amount of control GUVs was at 0 min—225 GUVs, 30 min—344 GUVs, 60 min—349 GUVs and 120 min—393 GUVs. For SaroL-1 experiment with wt Gb3-containing GUVs, the total amount of GUVs was 0 min—230 GUVs, 30 min—185 GUVs, 60 min—183 GUVs and 120 min—178 GUVs. In the PNPG-treated group there was a total amount of GUVs at 0 min—322 GUVs, at 30 min—435 GUVs, 60 min—447 GUVs and at 120 min 446 GUVs. c Relative hemolytic activity of SaroL-1 with estimation of IC50 as 6.3 μg/mL (170 nM). Mean values ± SD are shown. Data represent two independent experiments, n = 2. d Relative inhibition of the hemolytic activity of SaroL-1 by PNPG, GalNAc, melibiose and lactose. Mean values ± SD are shown. Data represent two independent experiments, n = 2. All error bars correspond to mean value ± SD. Data for the graphs are available in Supplementary Data 1.
Fig. 7
Fig. 7. Cytotoxic activity of SaroL-1 against H1299 cells.
a Dose-dependent increase of cytotoxicity following the addition of purified SaroL-1 in a standard cell proliferation assay (MTT) demonstrating increment of cytotoxicity after 24 h of incubation compared to treatment with PBS. Cell viability is reduced by ~87% after stimulation with 1.36 µM SaroL-1. Data represent three independent experiments, n = 3. b Cell proliferation assay (MTT) of H1299 cells pre-treated with PPMP for 72 h before addition of increasing concentrations of purified SaroL-1. Cytotoxicity was remarkably reduced after 24 h of incubation with SaroL-1 in absence of the glycosphingolipid Gb3 at the plasma membrane of treated cells. Data represent three independent experiments, n = 3. c The soluble sugar PNPG inhibited SaroL-1 cytotoxicity. H1299 were incubated with increasing concentrations of SaroL-1 pre-treated with 10 mM PNPG. Cell proliferation assay (MTT) was used to assess SaroL-1´s cytotoxic activity after 24 h in comparison to the treatment with PBS. The results indicate that cell viability is preserved when SaroL-1 glycan-binding sites are saturated with soluble 10 mM PNPG. Data represent three independent experiments, n = 3. d H1299 cells suffer of acute cytotoxicity and membrane damage in presence of SaroL-1. A lactate dehydrogenase (LDH) assay revealed impairment of cell membrane integrity upon incubation with 0.27 µM and 1.36 µM SaroL-1 after 2 and 4 h. Data represent two independent experiments, n = 2. Differences to the control were analyzed for significance by using two-tailed unpaired t-test. *p < 0.05, **p < 0.01, ***p < 0.001, ****p < 0.0001.
Fig. 8
Fig. 8. Prediction and visualization of Sarol-1 pore oligomeric assembly.
a Preliminary model of membrane-bound heptameric SaroL-1 built by homology modeling using the structure similarity displayed in Fig. 3. b Crystal structure of heptameric ε-toxin of C. perfringens (PDB 6RB9). c Crystal structure of heptameric lactose-binding lectin CEL-III from Cucumaria echinata complexed with βGal derivative (PDB 3WT9). dg Cryo TEM images of SaroL-1 clusters bound to Gb3-decorated LUVs. Red arrows indicate mushroom-like oligomers of SaroL-1 with estimated sizes (indicated by blue and red scale bars, respectively) corresponding to the heptameric predicted model (grey surface miniature). Scale bars are 50 nm in d and 20 nm in eg.

Similar articles

Cited by

References

    1. Gabius, H. J. et al. What is the sugar code? Chembiochem10.1002/cbic.202100327 (2022). - PMC - PubMed
    1. Lis H, Sharon N. Lectins: carbohydrate-specific proteins that mediate cellular recognition. Chem. Rev. 2002;98:637–674. doi: 10.1021/cr940413g. - DOI - PubMed
    1. Rutenber E, et al. Crystallographic refinement of ricin to 2.5 A. Proteins. 1991;10:240–250. doi: 10.1002/prot.340100308. - DOI - PubMed
    1. Merritt EA, et al. Crystal structure of cholera toxin B-pentamer bound to receptor GM1 pentasaccharide. Protein Sci. 1994;3:166–175. doi: 10.1002/pro.5560030202. - DOI - PMC - PubMed
    1. Iacovache I, van der Goot FG, Pernot L. Pore formation: an ancient yet complex form of attack. Biochim. Biophys. Acta. 2008;1778:1611–1623. doi: 10.1016/j.bbamem.2008.01.026. - DOI - PubMed

Publication types