. 2022 Sep;24(9):1407-1421.
doi: 10.1038/s41556-022-00977-x. Epub 2022 Sep 12.

Brain-enriched RagB isoforms regulate the dynamics of mTORC1 activity through GATOR1 inhibition

Affiliations

Brain-enriched RagB isoforms regulate the dynamics of mTORC1 activity through GATOR1 inhibition

Gianluca Figlia et al. Nat Cell Biol. 2022 Sep.

Abstract

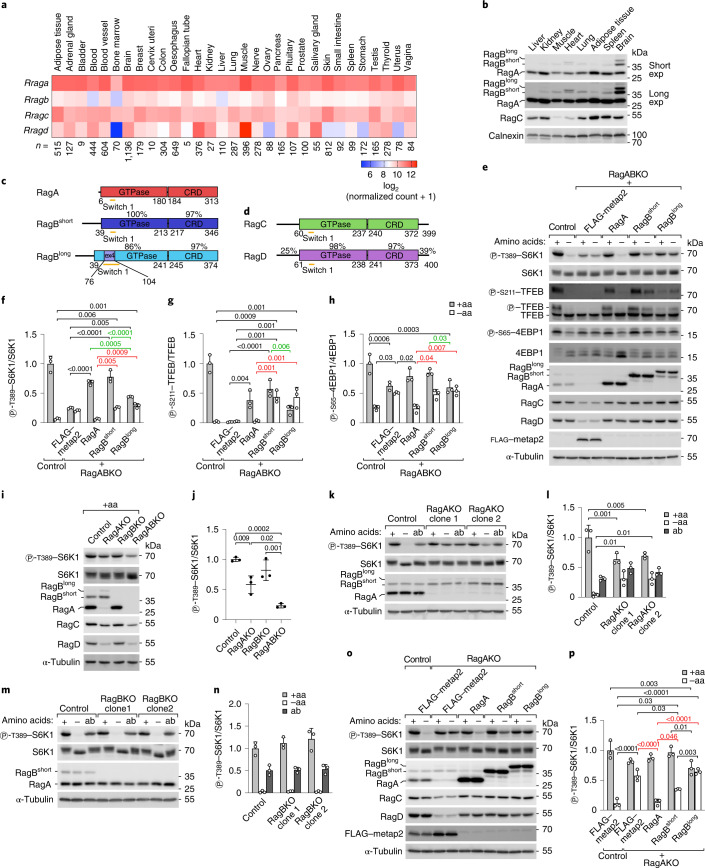
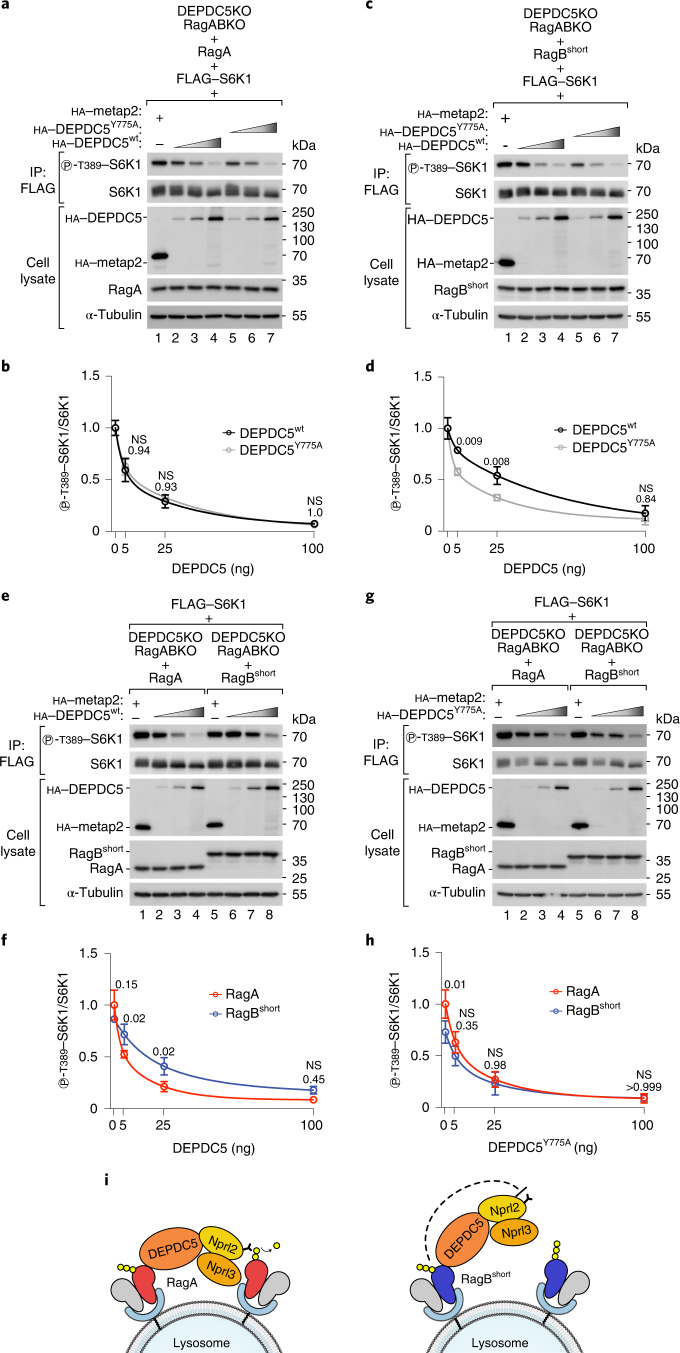
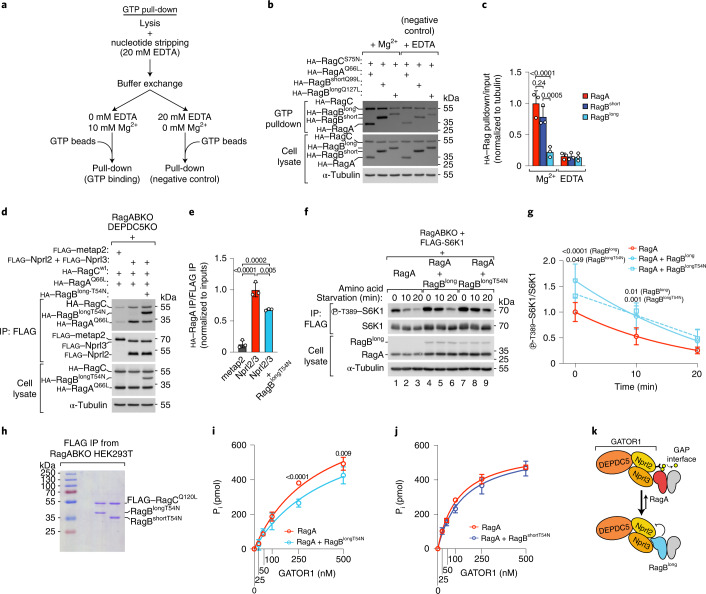
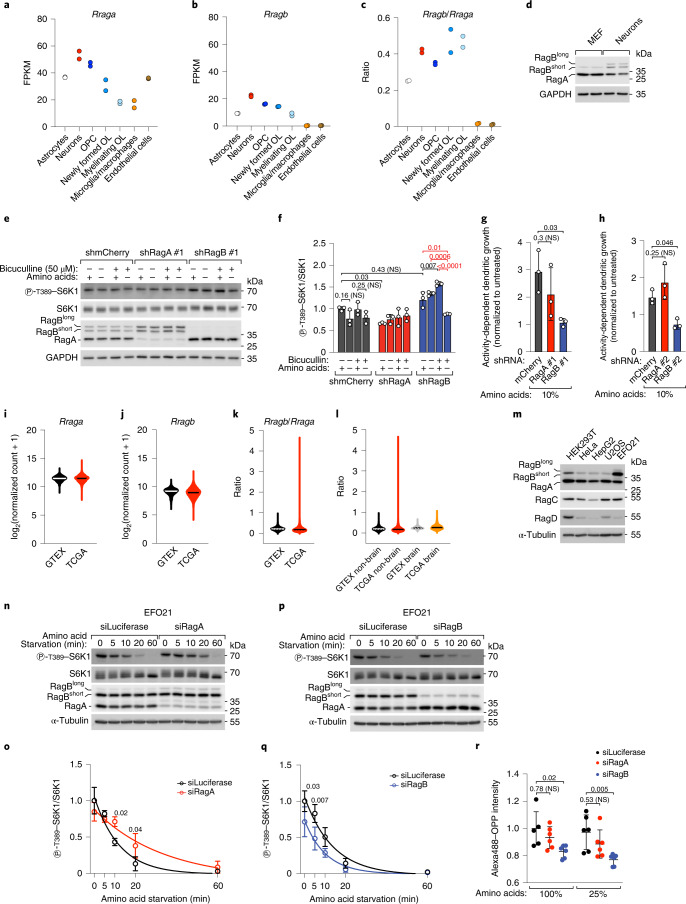
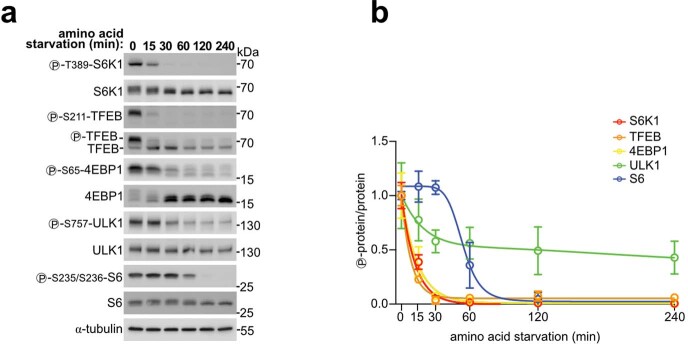
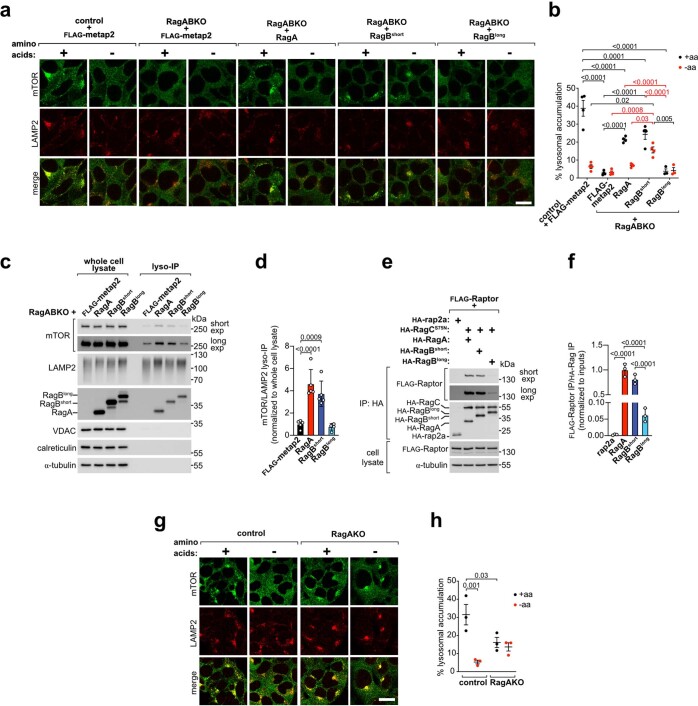
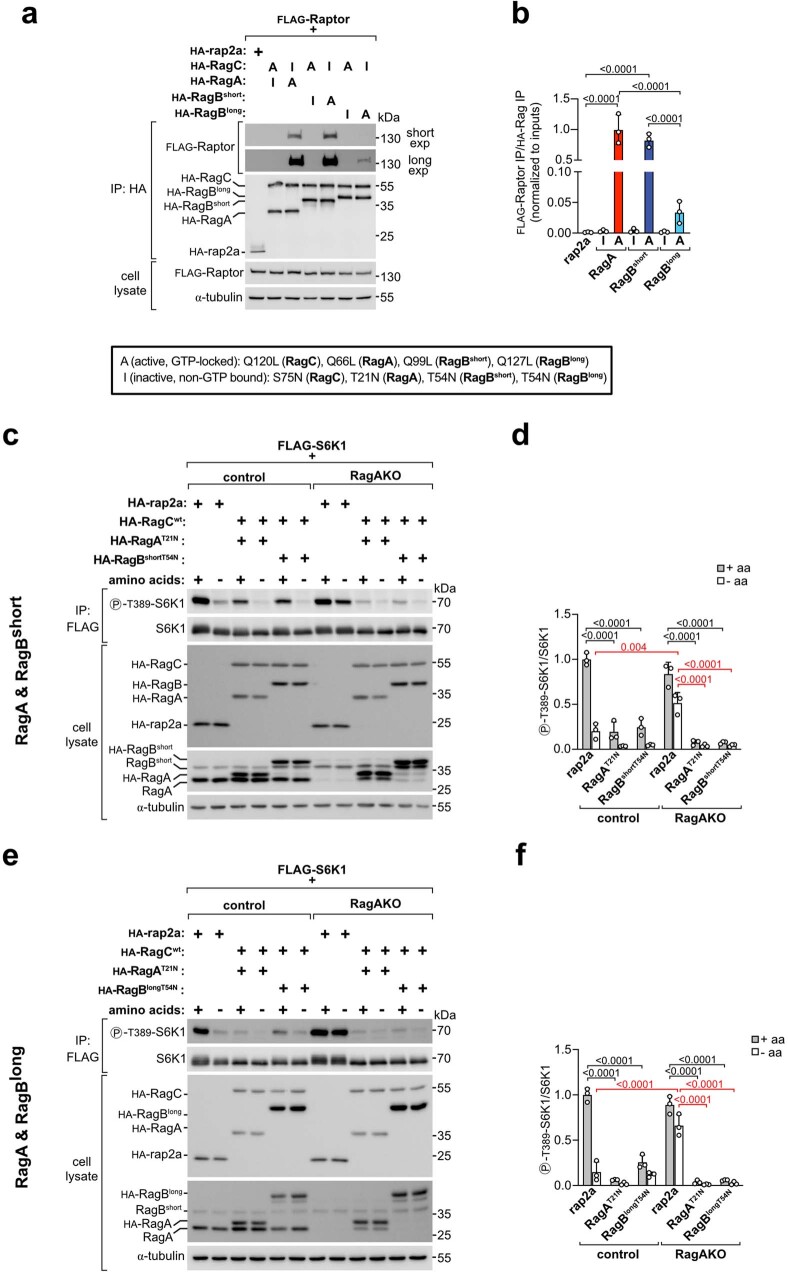
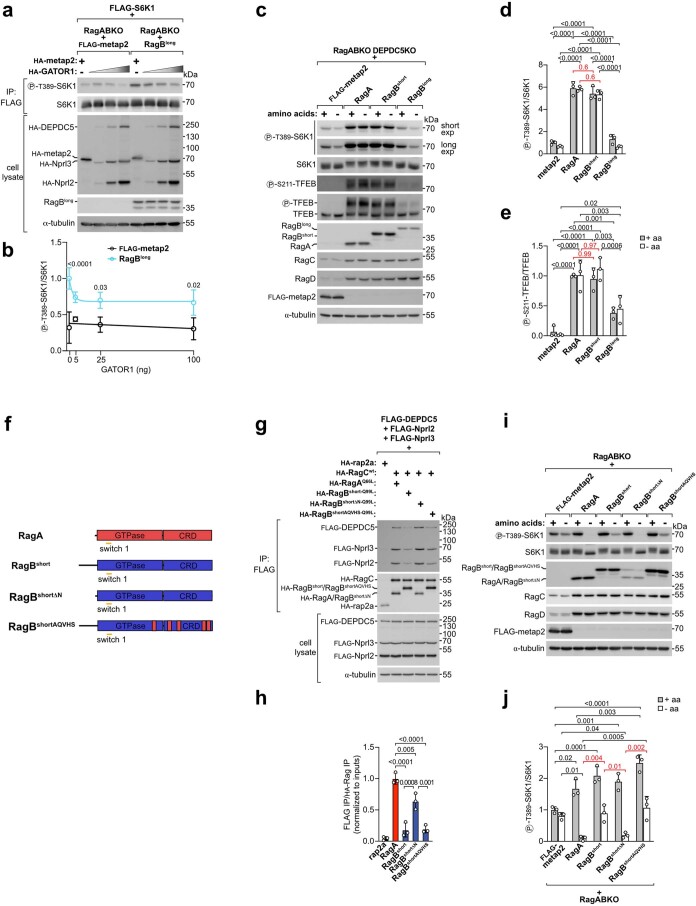
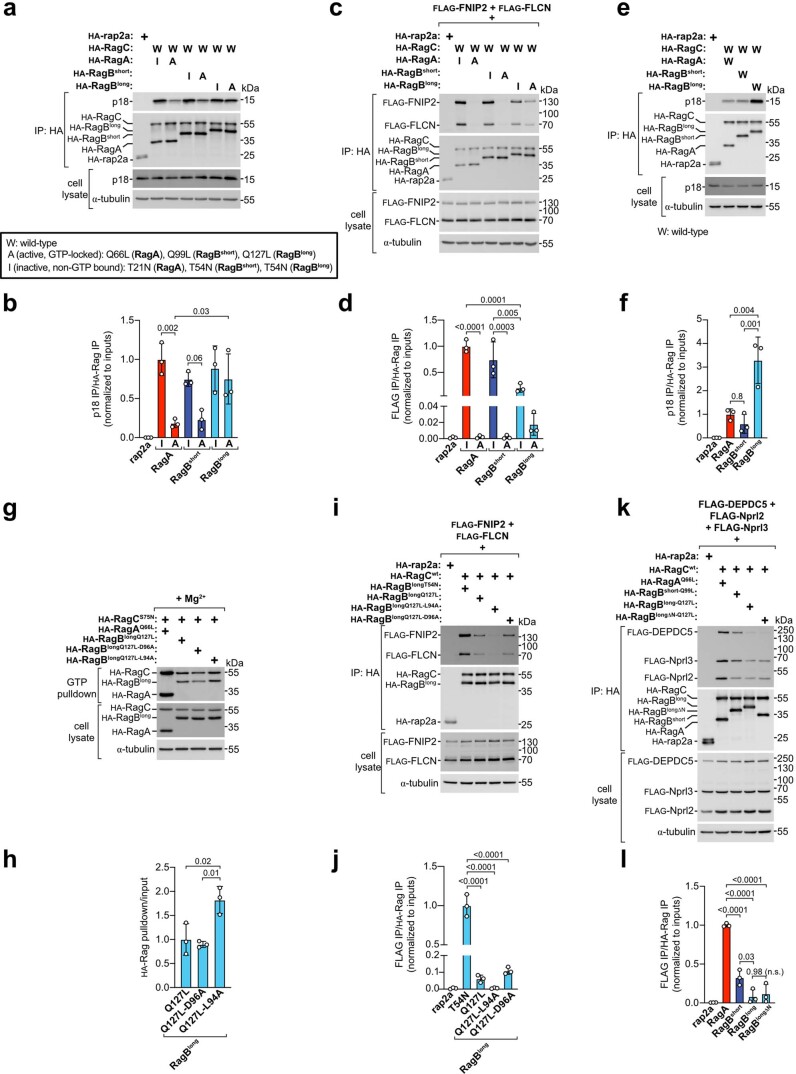
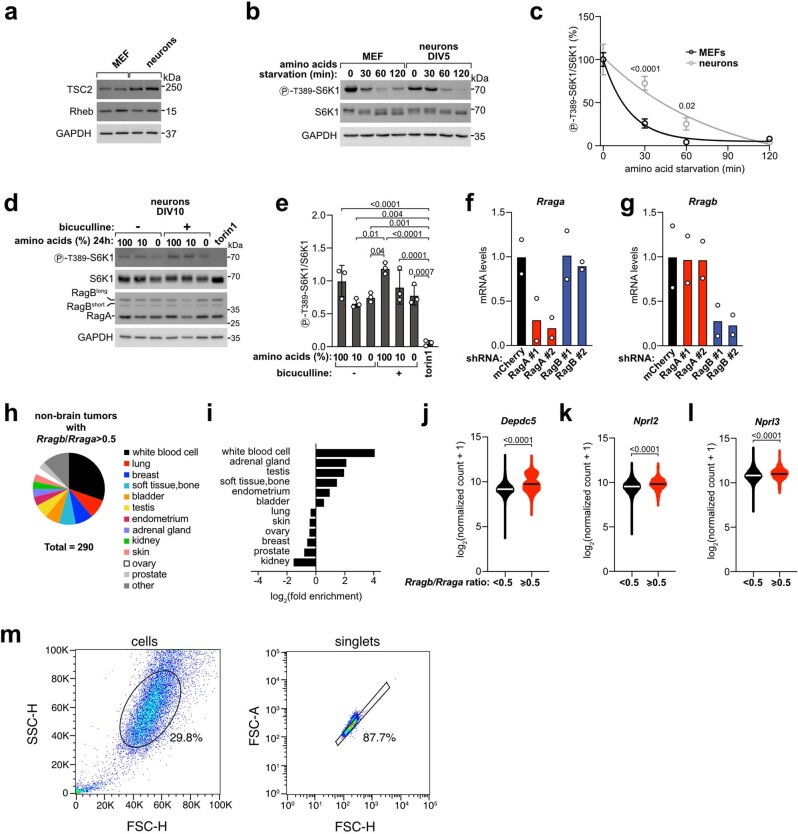
Mechanistic target of rapamycin complex 1 (mTORC1) senses nutrient availability to appropriately regulate cellular anabolism and catabolism. During nutrient restriction, different organs in an animal do not respond equally, with vital organs being relatively spared. This raises the possibility that mTORC1 is differentially regulated in different cell types, yet little is known about this mechanistically. The Rag GTPases, RagA or RagB bound to RagC or RagD, tether mTORC1 in a nutrient-dependent manner to lysosomes where mTORC1 becomes activated. Although the RagA and B paralogues were assumed to be functionally equivalent, we find here that the RagB isoforms, which are highly expressed in neurons, impart mTORC1 with resistance to nutrient starvation by inhibiting the RagA/B GTPase-activating protein GATOR1. We further show that high expression of RagB isoforms is observed in some tumours, revealing an alternative strategy by which cancer cells can retain elevated mTORC1 upon low nutrient availability.


Conflict of interest statement

The authors declare no competing interests.

Figures

Fig. 1
Fig. 1. RagA/B paralogues determine distinct mTORC1 responses.
a, Transcript levels of the Rag isoforms in healthy human tissues (gtexportal.org). n, biological replicates. b, Western blot for RagA, RagB and RagC in mouse tissues. Calnexin is the loading control. The experiment was repeated once. c,d, Domain organization of the Rag isoforms. Numbering indicates amino-acid positions in the human sequence. Percentages represent similarity of each domain between Rag paralogues. Ex4 is the sequence encoded by exon 4 of the Rragb gene. eh, S6K1, TFEB and 4EBP1 phosphorylation in control or RagABKO cells stably transfected with a control protein (FLAG–metap2) or with the indicated Rag isoforms. Cells were incubated in amino-acid-rich medium or starved of amino acids for 30 min: representative example (e) and quantification of three independent experiments, with unstarved control cells set to 1 (fh). Bar height indicates average, and error bars represent standard deviation; n = 3 biological replicates. Two-way ANOVA and Sidak’s post-hoc test. i,j, S6K1 phosphorylation upon loss of RagA, RagB or both: representative example (i) and quantification of three independent experiments, with control cells set to 1 (j). Bar height indicates average, and error bars represent standard deviation; n = 3 biological replicates. One-way ANOVA and Tukey’s post-hoc test. kn, RagA (k and l) but not RagB (m and n) loss causes persistent mTORC1 activity. Cells were incubated in amino-acid-rich medium, starved of amino acids for 1 h, or starved for 1 h and re-stimulated with amino acids for 15 min (addback, ‘ab’): representative examples (k and m) and quantification of three independent experiments, with unstarved control cells set to 1 (l and n). Bar height indicates average, and error bars represent standard deviation; n = 3 biological replicates. Two-way ANOVA and Sidak’s post-hoc test. op, The elevated mTORC1 activity in RagAKO cells upon amino-acid removal cannot be rescued by stable overexpression of the RagB isoforms. Cells were incubated in amino-acid-rich medium or starved of amino acids for 30 min: representative example (o) and quantification of three independent experiments, with unstarved control cells set to 1 (p). Bar height indicates average, error bars represent standard deviation; n = 3 biological replicates. Two-way ANOVA and Sidak’s post-hoc test. −aa, amino-acid-free DMEM + 10% dFBS. +aa, −aa medium supplemented with 1× amino acids. Exact P values are shown in the graphs. Source numerical data and unprocessed blots are available in source data. Source data
Fig. 2
Fig. 2. RagBshort and RagBlong are resistant to GATOR1.
a,b, RagABKO cells expressing each RagA/B isoform were transiently transfected with increasing amounts of GATOR1 plasmids (5 ng, 25 ng or 100 ng of each GATOR1 subunit) or metap2 (100 ng) as negative control: representative example (a) and quantification of four independent experiments, with RagA-expressing cells transfected with metap2 set to 1 (b). Bar height indicates average, and error bars represent standard deviation; n = 4 biological replicates. Two-way ANOVA and Tukey’s post-hoc test. c,d, Control and RagAKO cells were transiently transfected with high (200 ng) levels of each GATOR1 subunit or metap2 as negative control and treated with amino-acid-rich medium or starved of amino acids for 30 min before lysis: representative example (c) and quantification of three independent experiments, with unstarved metap2-transfected control cells set to 1 (d). Bar height indicates average, and error bars represent standard deviation; n = 3 biological replicates. Two-way ANOVA and Sidak’s post-hoc test. e, Schematic representation of the two binding interfaces of GATOR1 to RagA/B. fh, Rag interaction with the inhibitory interface (depicted in f) is assessed by co-immunoprecipitating the whole GATOR1 complex: representative example (g) and quantification of three independent experiments, with the inactive mutant of RagA set to 1 (h). Bar height indicates average, and error bars represent standard deviation; n = 3 biological replicates. One-way ANOVA and Tukey’s post-hoc test. ik, Rag interaction with the GAP interface (depicted in i) is assessed through co-IP with the Nprl2/3 dimer in DEPDC5KO cells: representative example (j) and quantification of three independent experiments, with the inactive mutant of RagA set to 1 (k). Bar height indicates average, and error bars represent standard deviation; n = 3 biological replicates. One-way ANOVA and Tukey’s post-hoc test. −aa, amino-acid-free DMEM + 10% dFBS. +aa, −aa medium supplemented with 1× amino acids. Exact P values are shown in the graphs. NS, not significant. Source numerical data and unprocessed blots are available in source data. Source data
Fig. 3
Fig. 3. RagBshort inhibits GATOR1 through interaction with DEPDC5.
ad, Transient expression of increasing amounts (5 ng, 25 ng or 100 ng DNA) of a non-Rag binding mutant of DEPDC5 (Y775A) suppresses mTORC1 more strongly than wild-type DEPDC5 in RagBshort-expressing cells (c and d) but not in RagA-expressing cells (a and b). Cells were subjected to amino-acid starvation (amino-acid-free DMEM + 10% dFBS) for 30 min to activate GATOR1: representative examples (a and c) and quantifications of three independent experiments, with metap2-transfected cells set to 1 (b and d). Circle indicates average, and error bars represent standard deviation; n = 3 biological replicates. Two-way ANOVA and Sidak’s post-hoc test. eh, Transient expression of increasing amounts (5 ng, 25 ng or 100 ng DNA) of wild-type DEPDC5 (e and f) inhibits mTORC1 activity more strongly in RagA-expressing cells than in RagBshort-expressing cells, whereas expression of a non-Rag binding mutant of DEPDC5 (Y775A) (g and h) inhibits mTORC1 activity equally well in the presence of RagA or RagBshort. Cells were subjected to amino-acid starvation (amino-acid-free DMEM + 10% dFBS) for 30 min to activate GATOR1: representative examples (e and g) and quantification of three independent experiments, with RagA-expressing cells transfected with metap2 set to 1 (f and h). Circle indicates average, and error bars represent standard deviation; n = 3 biological replicates. Two-way ANOVA and Sidak’s post-hoc test. i, Schematic representation of GATOR1 binding to RagA or RagBshort via DEPDC5. DEPDC5 binding to RagBshort but not to RagA inhibits GATOR1 activity. Exact P values are shown in the graphs. NS, not significant. Source numerical data and unprocessed blots are available in source data. Source data
Fig. 4
Fig. 4. RagBlong acts as a ‘sponge’ for the GAP interface of GATOR1.
a, Schematic representation of the GTP pull-down assay. b,c, GTP pull-down of RagA, RagBshort or RagBlong in the presence of magnesium or with addition of 20 mM EDTA as negative control: representative example (b) and quantification of three independent experiments, with RagA Mg2+ set to 1 (c). Bar height indicates average, and error bars represent standard deviation; n = 3 biological replicates. Two-way ANOVA and Sidak’s post-hoc test. d,e, Co-IP of Nprl2 and Nprl3 with Rag dimers consisting of wild-type RagC and GTP-locked RagA (Q66L) expressed with or without non-GTP-bound (T54N) RagBlong. The experiment was performed using RagA/B and DEPDC5 triple-knockout cells to assess specifically the binding to the GAP interface of GATOR1: representative example (d) and quantification of three independent experiments, with the Nprl2/3 condition set to 1 (e). Bar height indicates average, and error bars represent standard deviation; n = 3 biological replicates. One-way ANOVA and Tukey’s post-hoc test. f,g, S6K1 phosphorylation in RagABKO cells transiently transfected with RagA either alone or together with wild-type RagBlong or a non-GTP-bound mutant of RagBlong (T54N) during amino-acid starvation (amino-acid-free DMEM + 10% dFBS): representative example (f) and quantification of six independent experiments, with RagA-expressing cells at timepoint 0 set to 1 (g). Circle/square indicates average, and error bars represent standard deviation; n = 6 biological replicates. Two-way ANOVA and Tukey’s post-hoc test. h, Coomassie staining of RagBlongT54N and RagBshortT54N proteins purified from RagABKO HEK293T cells as dimers with FLAG-tagged RagCQ120L (1 μg dimer per lane). The experiment was repeated once. i,j, Malachite-green GTPase assay with 1 μM of RagA•RagCS75N either alone or mixed with an equimolar amount of RagBlongT54N•RagCQ120L (i) or RagBshortT54N•RagCQ120L (j) in solution in the presence of the indicated amounts of GATOR1. Quantification of four (i) or three (j) independent experiments. Circle indicates average, and error bars represent standard deviation; n = 3 (j) and 4 (i) replicates. Two-way ANOVA and Sidak’s post-hoc test. k, Schematic representation of the mechanism whereby non-GTP-bound RagBlong titrates away the GAP interface of GATOR1. Exact P values are shown in the graphs. Source numerical data and unprocessed blots are available in source data. Source data
Fig. 5
Fig. 5. RagBshort and RagBlong have additive effects on mTORC1.
ah, S6K1 phosphorylation in RagABKO cells transiently transfected with RagA, RagA and RagBshort, or all three RagA/B isoforms and treated with amino-acid-rich medium or medium containing 50% (a and b), 25% (c and d), 10% (e and f) or 0% (g and h) of the normal amino-acid concentration for 30 min, where cells transfected with HA–rap2a were used as a negative control: representative examples (a, c, e and g) and quantification of three independent experiments, with RagA-transfected cells set to 1 (b, d, f and h). Asterisk indicates non-specific band. Bar height indicates average, and error bars represent standard deviation; n = 3 biological replicates. Two-way ANOVA and Sidak’s post-hoc test. i, Graph summarizing the data from ah after fitting a hyperbola curve using non-linear regression analysis. Circle indicates average, and error bars represent standard deviation; n = 12 biological replicates for the 100% amino-acid condition, n = 3 biological replicates for the other conditions. j, Schematic diagram of the effects of different RagA/B isoform combinations on mTORC1 signalling in the presence or absence of amino acids. RagBshort and RagBlong cause persistent mTORC1 activation during amino-acid starvation via GATOR1 inhibition due to RagBshort binding to the inhibitory interface and RagBlong binding to the GAP interface. Exact P values are shown in the graphs. Source numerical data and unprocessed blots are available in source data. Source data
Fig. 6
Fig. 6. RagB determines mTORC1 resistance to starvation in neurons and tumour cells.
ac, mRNA levels of Rraga (a), Rragb (b) and their ratio (c) in brain cells (ref. ; GEO accession number GSE52564); n = 2 biological replicates; OL, oligodendrocytes; FPKM, fragments per kilobase million. d, RagA/B expression in DIV 5 mouse cortical neurons and MEFs, two biological replicates each. GAPDH was loading control. e,f, Control (shmCherry) or RagA- or RagB-knockdown DIV 10 mouse cortical neurons were starved of amino acids for 24 h with/without bicuculline (50 μM). −aa, amino-acid-free MEM 1:10 in buffered saline solution; +aa, −aa medium + 1× amino acids (Methods): representative example (e) and quantification of three biological replicates, with shmCherry +aa/−bicuculline set to 1 (f). Bar height indicates average, and error bars represent standard deviation; n = 3 biological replicates. Two-way ANOVA and Tukey’s post-hoc test. g,h, RagB but not RagA knockdown blunts bicuculline-stimulated dendritogenesis of hippocampal neurons grown in 10% MEM amino-acid concentration (methods). Bar height indicates average, and error bars represent standard deviation; n = 3 biological replicates. One-way ANOVA and Dunnett’s post-hoc test. ik, Violin plot of of Rraga/Rragb mRNA levels and their ratio in normal (GTEX) or cancer (TCGA) tissues. nGTEX = 7,825 biological replicates, nTCGA = 10,534 biological replicates. l, Violin plot of the Rragb/Rraga ratio in normal brain (GTEX brain) or brain cancers (TCGA brain), compared with all other samples (GTEX non-brain and TCGA non-brain). nGTEX non-brain = 6,688 biological replicates, nTCGA non-brain = 9,840 biological replicates, nGTEX brain = 1,136 biological replicates, nTCGA brain = 694 biological replicates. m, RagA/B expression in HEK293T and various cancer cell lines. The experiment was repeated once. nq, mTORC1 inactivation in EFO21 cells knockdown for RagA (n and o) or RagB (p and q) during starvation, where Renilla luciferase was negative control: representative examples (n and p) and quantification of three independent experiments, with control at timepoint 0 set to 1 (o and q). Circle indicates average, and error bars represent standard deviation; n = 3 biological replicates. Two-way ANOVA and Sidak’s post-hoc test. r, OPP incorporation in RagA-, RagB- or luciferase-knockdown EFO21 cells treated with the indicated amino-acid concentrations. The experiment was repeated twice with three biological replicates each. Line indicates average, and error bars represent standard deviation; n = 6 biological replicates. Two-way ANOVA and Sidak’s post-hoc test. Gating strategy in Extended Data Fig. 10m. Exact P values are shown in the graphs. NS, not significant. Source numerical data and unprocessed blots are available in source data. Source data
Extended Data Fig. 1
Extended Data Fig. 1. mTORC1 activity in RagABKO and RagCDKO cells.
(a-f) S6K1 and TFEB phosphorylation in control and RagA/B-double knockout (a-c) or RagC/D-double knockout (d-f) HEK293T cells in nutrient rich conditions, after amino-acid starvation for 1 h, or after starvation for 1 h followed by amino-acid addback for 15 min (‘ab’). n.s.=non-specific band. (a,d) Representative example. (b-c,e-f) Quantification of 3 independent experiments, with unstarved control cells set to 1. Bar Height=average, error bars=standard deviation, n = 3 biological replicates. Two-way ANOVA and Sidak’s post-hoc test. (g) Absolute quantification of Rag levels by qPCR in HEK2983T cells. Line=average, error bars=standard deviation, n = 4 biological replicates. (h-k) S6K1, TFEB, and 4EBP1 phosphorylation in control or RagCDKO cells stably transfected with a control protein (FLAG-metap2) or with the indicated Rag isoforms. Cells were incubated in amino-acid rich medium (‘+’) or starved of amino acids for 30 minutes (‘−’). (h) Representative example. (i-k) Quantification of 3 independent experiments, with unstarved control cells set to 1. Bar Height=average, error bars=standard deviation, n = 3 biological replicates. Two-way ANOVA and Sidak’s post-hoc test. -aa: amino-acid free DMEM + 10% dFBS. +aa: -aa medium supplemented with 1x amino acids. Exact p values are shown in the graphs. Source numerical data and unprocessed blots are available in source data. Source data
Extended Data Fig. 2
Extended Data Fig. 2. Response of mTORC1 targets to amino-acid removal.
(a, b) Phosphorylation of the mTORC1 targets S6K1, TFEB, 4EBP1, ULK1, and the S6K targets S6 in control cells upon amino-acid starvation (amino-acid free DMEM + 10% dFBS) for the indicated time points. (a) Representative example. (b) Quantification of 3 independent experiments, with unstarved cells set to 1. Circle=average, error bars=standard deviation, n = 3 biological replicates. Source numerical data and unprocessed blots are available in source data. Source data
Extended Data Fig. 3
Extended Data Fig. 3. mTOR localization in RagABKO and RagCDKO cells.
(a-d) mTOR and LAMP2 immunofluorescence in control and RagABKO or RagCDKO cells in amino-acid rich conditions. (a,c) Representative examples. (b-d) Quantification of 3 independent experiments as percentage of LAMP2 signal overlapping with the mTOR signal. Each data point represents the average of multiple fields of view of one replicate experiment. Line=average, error bars=standard deviation, n = 3 replicates. Two-tailed, unpaired t-test. Scale bar: 20 µm. (e-k) Lysosomal immunopurification (lyso-IP) from control, RagABKO, and RagCDKO cells in amino-acid replete conditions. LAMP2: lysosomal marker. Markers of other organelles are shown as control: VDAC (mitochondria), calreticulin (ER), α-tubulin (cytosol). (e) Representative example. (f-k) Quantification of 3 independent experiments, with control cells set to 1. Bar Height=average, error bars=standard deviation, n = 3 biological replicates. One-way ANOVA and Tukey’s post-hoc test (f-g) or two-tailed, unpaired t-test (h-k). (l-n) CoIP of HA-tagged RagA, RagBshort, or RagBlong with myc-tagged RagC and RagD. (l) Representative example. (m-n) Quantification of 3 independent experiments, with the HA-RagA condition set to 1. Bar Height=average, error bars=standard deviation, n = 3 biological replicates. One-way ANOVA and Tukey’s post-hoc test. Exact p values are shown in the graphs. Source numerical data and unprocessed blots are available in source data. Source data
Extended Data Fig. 4
Extended Data Fig. 4. mTOR persists on lysosomes during starvation in cells expressing only Rag.
(a, b) mTOR and LAMP2 immunofluorescence in control (FLAG-metap2) or RagABKO cells stably transfected with RagA/B paralogues and incubated in amino-acid rich medium or starved of amino acids for 30 min. (a) Representative example. (b) Quantification of 3 independent experiments with all genotypes and 1 additional experiment with all genotypes except RagABKO + RagBlong. Data are expressed as percentage of LAMP2 signal overlapping with the mTOR signal, each data point represents the average of multiple fields of view from one independent experiment. Line=average, error bars=standard deviation, n = 3-4 replicates. Two-way ANOVA and Sidak’s post-hoc test. Scale bar=20 µm. (c, d) Lysosomal immunopurification (lyso-IP) from RagABKO cells stably transfected with FLAG-metap2 or the indicated RagA/B paralogues in amino-acid replete conditions. LAMP2: lysosomal marker. Markers of other organelles are shown as control: VDAC (mitochondria), calreticulin (ER), α-tubulin (cytosol). (c) Representative example. (d) Quantification of 5 independent experiments, with FLAG-metap2 cells set to 1. Bar Height=average, error bars=standard deviation, n = 5 biological replicates. One-way ANOVA and Tukey’s post-hoc test. (e, f) coIP of Raptor with wild-type-RagA/B•RagCS75N dimers. (e) Representative example. (f) Quantification of 3 independent experiments, with the RagA condition set to 1. Bar Height=average, error bars=standard deviation, n = 3 biological replicates. One-way ANOVA and Tukey’s post-hoc test. (g, h) mTOR and LAMP2 immunofluorescence in control or RagAKO cells. Cells were incubated in amino-acid rich medium or starved of amino acids for 30 min. (g) Representative example. (h) Quantification of 3 independent experiments. Data are expressed as percentage of LAMP2 signal overlapping with the mTOR signal, each data point represents the average of multiple fields of view from one replicate experiment. Line=average, error bars=standard deviation, n = 3 biological replicates. Two-way ANOVA and Sidak’s post-hoc test. Scale bar=20 µm. -aa: amino-acid free DMEM + 10% dFBS. +aa: -aa medium supplemented with 1x amino acids. Exact p values are shown in the graphs. Source numerical data and unprocessed blots are available in source data. Source data
Extended Data Fig. 5
Extended Data Fig. 5. Inactive RagA/B rescue persistent mTORC1 activity in RagAKO cells.
(a, b) coIP of Raptor with Rag dimers harboring the indicated mutations. (a) Representative example. (b) Quantification of 3 independent experiments, with the active mutant of RagA set to 1. Bar Height=average, error bars=standard deviation, n = 3 biological replicates. One-way ANOVA and Tukey’s post-hoc test. (c-f) Persistent mTORC1 activity in RagAKO cells during starvation is rescued by transient transfection of non-GTP bound RagA, RagBshort (c-d), or RagBlong (e-f). Cells were treated with amino-acid rich medium or starved of amino acids for 30 min before lysis. (c,e) Representative examples. (d,f) Quantification of 3 independent experiments, with unstarved HA-rap2a-transfected control cells set to 1. Bar Height=average, error bars=standard deviation, n = 3 biological replicates. Two-way ANOVA and Sidak’s post-hoc test. -aa: amino-acid free DMEM + 10% dFBS. +aa: -aa medium supplemented with 1x amino acids. Exact p values are shown in the graphs. Source numerical data and unprocessed blots are available in source data. Source data
Extended Data Fig. 6
Extended Data Fig. 6. Mechanistic determinants of RagA vs RagBshort functional differences.
(a, b) RagABKO cells expressing RagBlong or a control protein (FLAG-metap2) were transiently transfected with increasing amounts of GATOR1 plasmids (5 ng, 25 ng, or 100 ng of each GATOR1 subunit) or metap2 (100 ng) as negative control. (a) Representative example. (b) Quantification of 3 independent experiments, with RagBlong-expressing cells transfected with metap2 set to 1. Circle=average, error bars=standard deviation, n = 4 biological replicates. Two-way ANOVA and Sidak’s post-hoc test. (c-e) mTORC1 activity is comparable between RagABKO/DEPDC5KO stably expressing RagA or RagBshort and treated with amino-acid rich or amino-acid free medium for 30 min. (c) Representative example. (d-e) Quantification of 3 independent experiments, with unstarved control (FLAG-metap2) cells set to 1. Bar Height=average, error bars=standard deviation, n = 3 biological replicates. Two-way ANOVA and Sidak’s post-hoc test. (f) Scheme of the RagA/B constructs used. RagBshortΔN: deletion of amino acids 2 − 34; RagBshortAQVHS: substitution of 5 amino acids in the RagBshort sequence with the corresponding amino acids in the RagA sequence (S191A, E229Q, A258V, Q341H, C342S). (g, h) coIP of GATOR1 with the RagA, RagBshort, or the RagBshort mutants described in (f). (g) Representative example. (h) Quantification of 3 independent experiments, with the RagA condition set to 1. Bar Height=average, error bars=standard deviation, n = 3 biological replicates. One-way ANOVA and Tukey’s post-hoc test. (i-j) S6K1 phosphorylation in RagABKO cells stably expressing a control protein (FLAG-metap2) or RagA, RagBshort, or the two RagBshort mutants described in (f) and treated with amino-acid rich or amino-acid free medium for 30 min before lysis. (i) Representative example. (j) Quantification of 3 independent experiments, with unstarved control (FLAG-metap2) cells set to 1. Bar Height=average, error bars=standard deviation, n = 3 biological replicates. Two-way ANOVA and Sidak’s post-hoc test. -aa: amino-acid free DMEM + 10% dFBS. +aa: -aa medium supplemented with 1x amino acids. Exact p values are shown in the graphs. Source numerical data and unprocessed blots are available in source data. Source data
Extended Data Fig. 7
Extended Data Fig. 7. in vitro GTPase assays with purified RagA/B proteins.
(a) Purification strategy and Coomassie staining of RagA and RagBshort purified as dimers with His-tagged RagCS75N (1 μg dimer per lane) from E. coli. The experiment was repeated once. (b) Coomassie staining of the GATOR1 complex purified from HEK293T cells as trimer of wild-type or mutant (Y775A) FLAG-DEDPC5 and HA-tagged Nprl2/3 (1 μg complex per lane). The experiment was repeated once. (c) Scheme depicting the malachite-green based reaction used to assay the Rag GTPase activity. The inorganic phosphate released upon hydrolysis of GTP forms a complex with molybdate and malachite green that causes the malachite green to change from yellow to blue-green. (d, e) GTPase activity of RagA/B dimerized to RagCS75N (1 μM) and mixed with the indicated concentrations of GATOR1 containing wild-type (d) or Y775A-mutant (e) DEPDC5 after immobilization of RagA/B on His-tag beads. Data from three (d) or four (e) independent experiments were plotted and a curve was fit with non-linear regression analysis following a hyperbola model. Circle=average, error bars=standard deviation, n = 3 (d) or 4 (e) replicates. Two-way ANOVA and Sidak’s post-hoc test, p values are indicated above the circles. n.s., not significant. Source numerical data are available in source data. Source data
Extended Data Fig. 8
Extended Data Fig. 8. RagBlong interactions are consistent with low GTP binding.
(a, b) coIP of endogenous p18 with Rag dimers harboring the indicated mutations. (a) Representative example. (b) Quantification of 3 independent experiments, with the inactive mutant of RagA set to 1. Bar Height=average, error bars=standard deviation, n = 3 biological replicates. One-way ANOVA and Tukey’s post-hoc test. (c, d) coIP of the folliculin complex (FLCN, FNIP2) with Rag dimers harboring the indicated mutations. (c) Representative example. (d) Quantification of 3 independent experiments, with the inactive mutant of RagA set to 1. Bar Height=average, error bars=standard deviation, n = 3 biological replicates. One-way ANOVA and Tukey’s post-hoc test. (e, f) coIP of endogenous p18 with wild-type RagA/B isoforms. (e) Representative example. (f) Quantification of 3 independent experiments, with the RagA condition set to 1. Bar Height=average, error bars=standard deviation, n = 3 biological replicates. One-way ANOVA and Tukey’s post-hoc test. (g, h) GTP-pull down assay comparing RagA, RagBlong, and two mutants of RagBlong. (g) Representative example. (h) Quantification of 3 independent experiments, with RagBQ127L set to 1. Bar Height=average, error bars=standard deviation, n = 3 biological replicates. One-way ANOVA and Tukey’s post-hoc test. (i, j) coIP of the folliculin complex (FLCN, FNIP2) with RagBlong mutants. (i) Representative example. (j) Quantification of 3 independent experiments, with the RagBlongT54N condition set to 1. Bar Height=average, error bars=standard deviation, n = 3 biological replicates. One-way ANOVA and Tukey’s post-hoc test. (k) coIP of GATOR1 with RagA, RagBshort, RagBlong, or a RagBlong mutant lacking the N-terminal extension (RagBlongΔN). (k) Representative example. (l) Quantification of 3 independent experiments, with the RagA condition set to 1. Bar Height=average, error bars=standard deviation, n = 3 biological replicates. One-way ANOVA and Tukey’s post-hoc test. Exact p values are shown in the graphs. n.s., not significant. Source numerical data and unprocessed blots are available in source data. Source data
Extended Data Fig. 9
Extended Data Fig. 9. RagBlong acts as a ‘sponge’ for the GAP interface of GATOR1.
(a, b) Coomassie staining of RagBlong (a) or RagA (b) purified from RagABKO HEK293T cells as dimers with FLAG-tagged RagCS75N (1 μg dimer per lane). The experiment was repeated once. (c, d) GTPase activity of RagA or RagBlong proteins dimerized to RagCS75N (1 μM) and mixed in solution with the indicated concentrations of GATOR1. RagBlong was purified from mammalian cells and RagA was purified from either (c) bacteria or (d) mammalian cells. Data from three (c) or two (d) independent experiments were plotted and a curve was fit with non-linear regression analysis following a hyperbola model. Circle=average (c) or individual replicates (d), error bars=standard deviation. (e, f) in vitro interaction of purified Rag dimers with GATOR1 (containing DEPDC5Y775A) in the presence of GDP. (e) Representative example. (f) Quantification of 3 independent experiments normalized for the background in the empty beads control. Bar Height=average, error bars=standard deviation, n = 3 replicates. One-way ANOVA and Tukey’s post-hoc test. (g) Quantification of the total RagA/B protein levels in Fig. 5a-i, with the RagA condition set to 1. Line=average, error bars=standard deviation, n = 9 biological replicates. One-way ANOVA and Tukey’s post-hoc test. (h-i) S6K1 phosphorylation in RagABKO cells transiently transfected with RagA, RagA and RagBshort, or all three RagA/B isoforms during starvation (amino-acid free DMEM + 10% dFBS) for the indicated time points. (h) Representative example. (i) Quantification of six independent experiments, with RagA-expressing cells at time point 0 set to 1. Circle=average, error bars=standard deviation, n = 6 biological replicates. Two-way ANOVA and Tukey’s post-hoc test. (j-m) Amino-acid titration in Neuro-2a cells knockout for RagA (j-k) or RagB (l-m) treated with the indicated amino-acid concentrations for one hour. (j,l) Representative examples. (k.m) Quantifications of 3 independent experiments, with unstarved control cells set to 1. Circle=average, error bars=standard deviation, n = 3 biological replicates. Two-way ANOVA and Tukey’s post-hoc test. Exact p values are shown in the graphs. n.s., not significant. Source numerical data and unprocessed blots are available in source data. Source data
Extended Data Fig. 10
Extended Data Fig. 10. RagB determines mTORC1 resistance to starvation in neurons and cancer cells.
(a) Rheb and TSC2 expression in mouse cortical neurons at DIV 5 as compared to mouse embryonic fibroblasts (MEF). Two biological replicates per cell type are shown. GAPDH: loading control. (b, c) S6K1 phosphorylation in MEF or neurons (DIV 5) during amino-acid starvation for the indicated time points. (b) Representative example. (c) Quantification of 3 independent experiments, with the unstarved conditions set to 100%. Circle=average, error bars=standard deviation, n = 3 biological replicates. Two-way ANOVA and Sidak’s post-hoc test. (d, e) DIV 10 mouse cortical neurons were incubated in medium containing the indicated amino-acid concentrations (in amino-acid free MEM 1:10 in buffered saline solution, see methods) with/without bicuculline (50 μM) for 24 hours or torin1 (250 nM) for 30 minutes, as control. (d) Representative example. (e) Quantification of 3 independent experiments, with 100% aa/-bicuculline neurons set to 1. Bar Height=average, error bars=standard deviation, n = 3 biological replicates. One-way ANOVA and Tukey’s post-hoc test. (f, g) qPCR of Rraga (f) and Rragb (g) in DIV 10 neurons infected with viruses expressing a control shRNA (shmCherry) or two sets of shRNAs targeting RagA or RagB. Data are shown as fold change compared to the shmCherry condition after normalization to Rpl13a. Bar Height=average, n = 2 biological replicates. (h) Primary site distribution of the TCGA cancer samples (excluding brain cancer samples) with a high Rragb/Rraga ratio (≥0.5) (n = 290 biological replicates). other=primary sites representing individually <3%. (i) Primary site enrichment of the TCGA cancer samples (excluding brain cancer samples) with a high Rragb/Rraga ratio (≥0.5) (n = 290 biological replicates) as compared to all non-brain TCGA cancer samples (n = 9841 biological replicates). Only primary sites representing ≥3% of the TCGA cancer samples with a high Rragb/Rraga ratio were considered. (j-l) Violin plot of the mRNA levels of the three GATOR1 subunits Depdc5 (j), Nprl2 (k), and Nprl3 (l) in cancer (TCGA) samples with low (<0.5) or high (>0.5) Rragb/Rraga ratio. Two-tailed, unpaired t-test, n = 10210 (Rragb/Rraga < 0.5) or 325 (Rragb/Rraga > 0.5) biological replicates. (m) Gating strategy for the OPP incorporation experiment shown in Fig. 6r. Exact p values are shown in the graphs. Source numerical data and unprocessed blots are available in source data. Source data

Comment in

  • Keeping up with the Rag GTPases.
    Alesi N, Henske EP. Alesi N, et al. Nat Cell Biol. 2022 Sep;24(9):1330-1331. doi: 10.1038/s41556-022-00981-1. Nat Cell Biol. 2022. PMID: 36097073 No abstract available.

Similar articles

Cited by

References

    1. Kim J, Guan KL. mTOR as a central hub of nutrient signalling and cell growth. Nat. Cell Biol. 2019;21:63–71. doi: 10.1038/s41556-018-0205-1. - DOI - PubMed
    1. Liu GY, Sabatini DM. mTOR at the nexus of nutrition, growth, ageing and disease. Nat. Rev. Mol. Cell Biol. 2020;21:183–203. doi: 10.1038/s41580-019-0199-y. - DOI - PMC - PubMed
    1. Figlia G, Gerber D, Suter U. Myelination and mTOR. Glia. 2018;66:693–707. doi: 10.1002/glia.23273. - DOI - PMC - PubMed
    1. Lipton JO, Sahin M. The neurology of mTOR. Neuron. 2014;84:275–291. doi: 10.1016/j.neuron.2014.09.034. - DOI - PMC - PubMed
    1. Yoon MS. mTOR as a key regulator in maintaining skeletal muscle mass. Front Physiol. 2017;8:788. doi: 10.3389/fphys.2017.00788. - DOI - PMC - PubMed

Publication types

MeSH terms

Substances