. 2022 Sep 12;13(1):5341.
doi: 10.1038/s41467-022-33041-1.

SREBP2-dependent lipid gene transcription enhances the infection of human dendritic cells by Zika virus

Affiliations

SREBP2-dependent lipid gene transcription enhances the infection of human dendritic cells by Zika virus

Emilie Branche et al. Nat Commun. .

Abstract

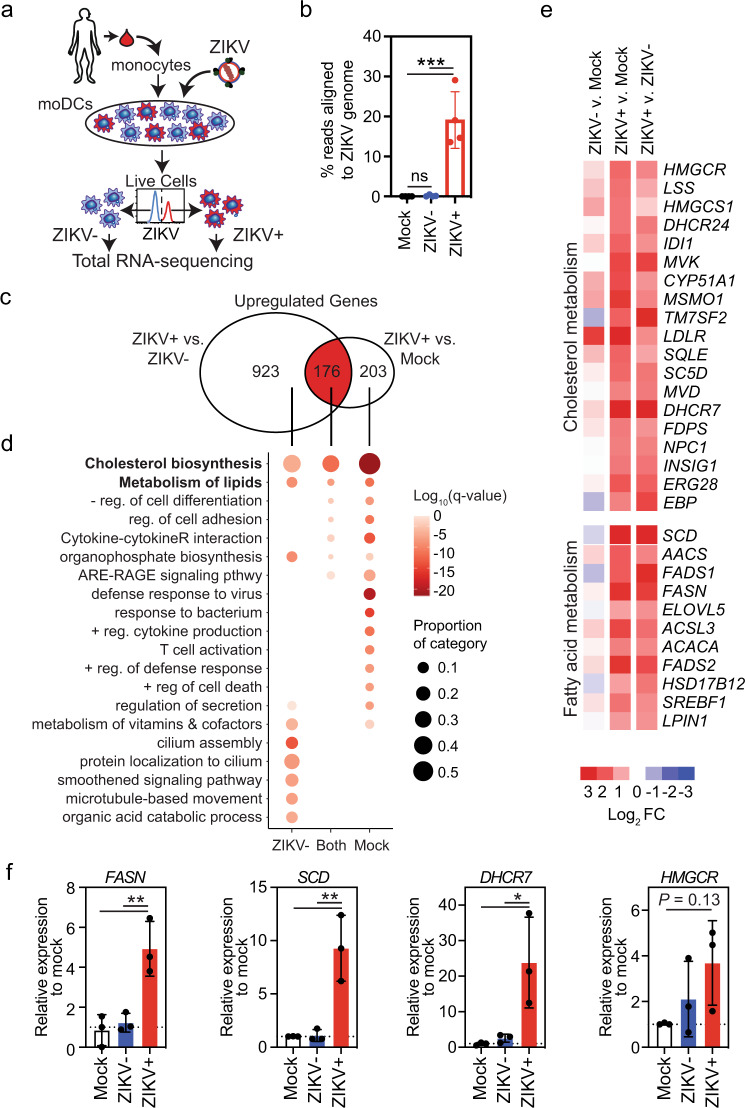
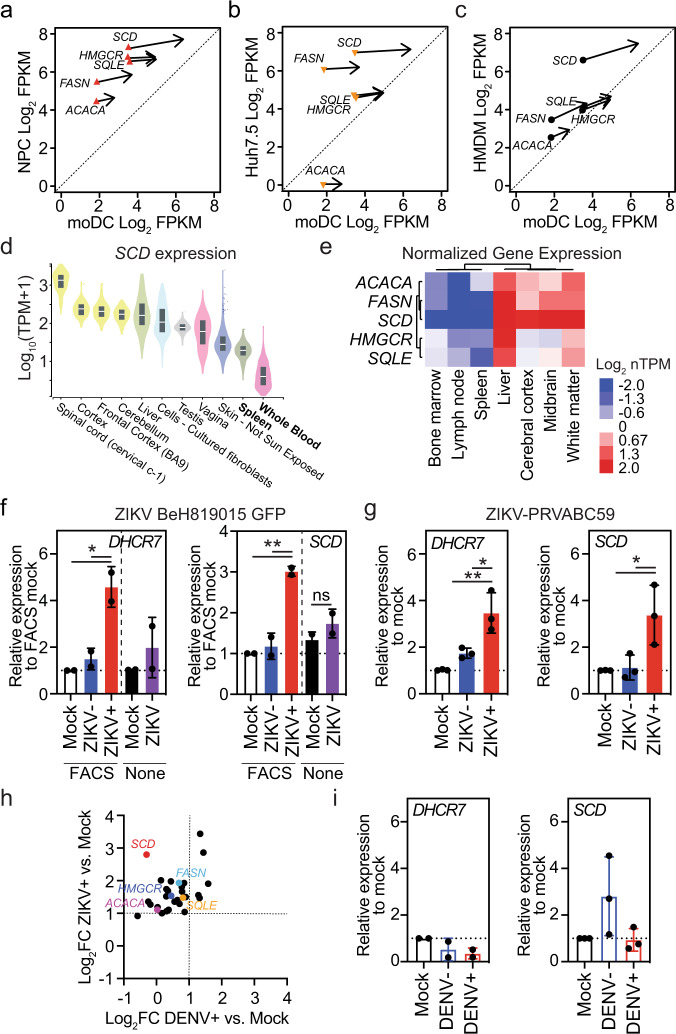
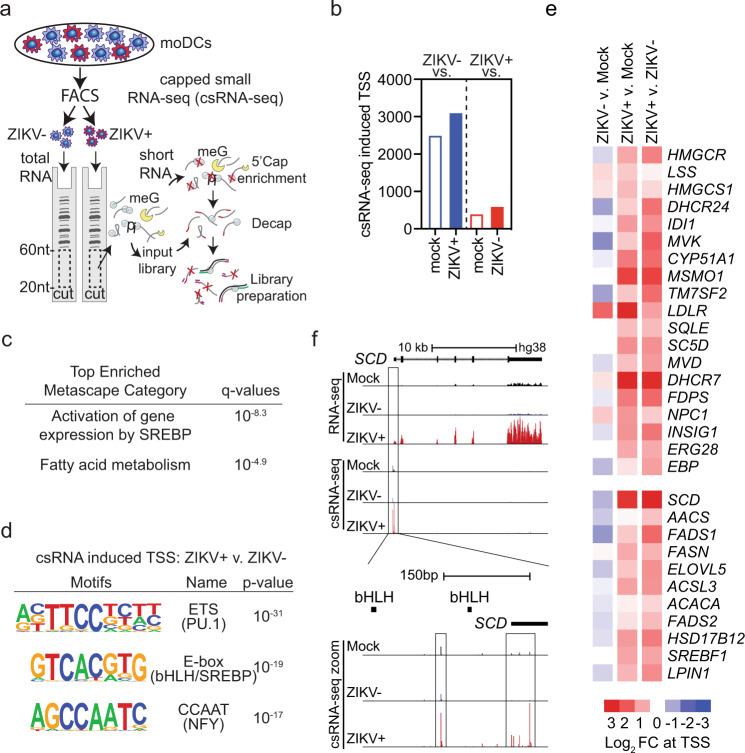
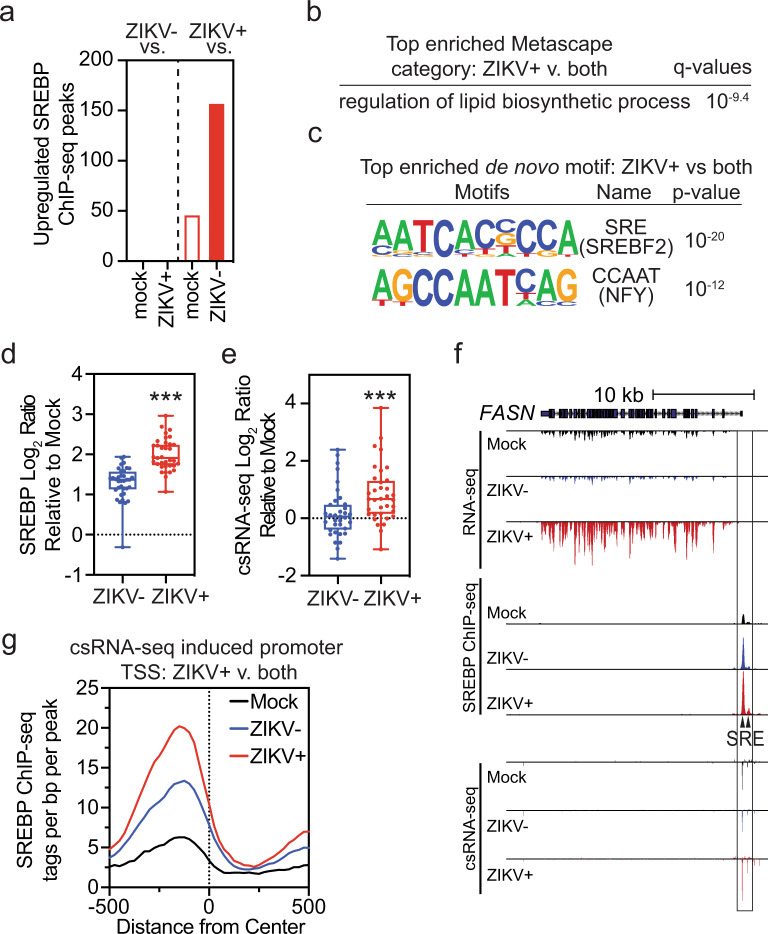
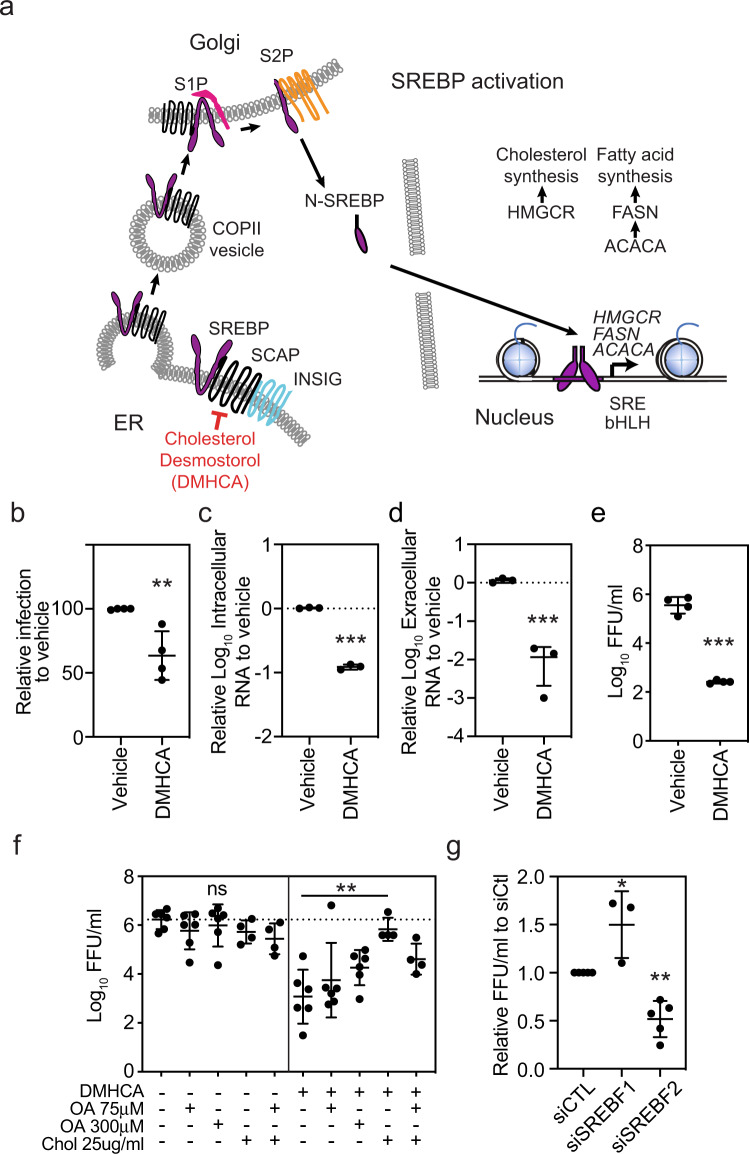
The emergence of Zika virus (ZIKV) as a global health threat has highlighted the unmet need for ZIKV-specific vaccines and antiviral treatments. ZIKV infects dendritic cells (DC), which have pivotal functions in activating innate and adaptive antiviral responses; however, the mechanisms by which DC function is subverted to establish ZIKV infection are unclear. Here we develop a genomics profiling method that enables discrete analysis of ZIKV-infected versus neighboring, uninfected primary human DCs to increase the sensitivity and specificity with which ZIKV-modulated pathways can be identified. The results show that ZIKV infection specifically increases the expression of genes enriched for lipid metabolism-related functions. ZIKV infection also increases the recruitment of sterol regulatory element-binding protein (SREBP) transcription factors to lipid gene promoters, while pharmacologic inhibition or genetic silencing of SREBP2 suppresses ZIKV infection of DCs. Our data thus identify SREBP2-activated transcription as a mechanism for promoting ZIKV infection amenable to therapeutic targeting.


Conflict of interest statement

The authors declare no competing interests.

Figures

Fig. 1
Fig. 1. ZIKV infection of human moDCs reprograms expression of lipid-related genes.
a Human moDCs from four different donors were infected for 24 h with ZIKV SD001 at MOI 0.5. Cells were then stained for the viral envelope (E) protein using mAb 4G2 and sorted into ZIKV-infected (ZIKV+) and bystander uninfected (ZIKV−) cells. Total RNA was isolated and subjected to RNA-seq. Mock-infected cells (Mock) were analyzed in parallel. b Percent of reads aligned to the ZIKV genome in each cell population. c Venn diagram showing the number of unique and shared genes upregulated (fold-change >2, false discovery rate <0.01) in ZIKV+ vs ZIKV− or Mock moDCs. d Gene ontology analysis of genes significantly upregulated in ZIKV+ vs ZIKV− or Mock moDCs. e Heat map of the relative expression of selected genes implicated in lipid metabolism. f qRT-PCR analysis of the relative expression of fatty acid (FASN and SCD) and cholesterol (DHCR7 and HMGCR) synthesis genes. Data are presented as the mean ± SD. n = 4 (b) and n = 3 (f) biologically independent experiments. Symbols represent moDCs derived from individual donors. *P < 0.05, **P < 0.01, ***P < 0.001 by one-way ANOVA with Tukey’s correction for multiple comparisons. Source data and exact P values are provided as a Source Data file.
Fig. 2
Fig. 2. Cell type- and virus-specific reprogramming of lipid metabolism genes.
ac Effect of ZIKV infection on the expression of rate-limiting enzymes in cholesterol and fatty acid synthesis in a neural progenitor cells (NPCs), b Huh7.5 human hepatoma cells, and c human monocyte-derived macrophages (HMDMs) compared with moDCs. Each symbol represents the baseline expression and the arrows point to the expression in ZIKV+ cells. d SCD expression in tissues that can be infected by ZIKV in order of median expression level (data from GTEx Analysis Release V8). The box shows the median value and extends from the 25th to 75th percentile, while the whiskers extend from min to max values. Points are displayed as outliers if they are above or below 1.5 times the interquartile range. e Unsupervised clustering of normalized expression (Log2 nTPM) of the indicated genes in the indicated tissues (data from The Human Protein Atlas v21.0). f, g qRT-PCR analysis of the relative expression of DHCR7 and SCD in moDCs infected for 24 h with f ZIKV BEH819015 (MOI 1) or g ZIKV PRVABC59 (MOI 1). h RNA-seq analysis of the relative expression of lipid biosynthetic genes (listed in Fig. 1e) in ZIKV+ (SD001) and DENV2+ (UIS353) moDCs vs Mock moDCs at 24 h post-infection. Enzymes catalyzing rate-limiting steps in cholesterol and fatty acid synthesis are highlighted. i qRT-PCR analysis of the relative expression of DHCR7 and SCD in moDCs infected for 24 h with DENV2 (UIS353) at MOI 1. Data are presented as the mean ± SD. Symbols represent moDCs derived from individual donors n = 2 (f) and DHCR7 (i) or n = 3 (g) and SCD (i) biologically independent experiments. *P < 0.05, **P < 0.01 by one-way ANOVA with Tukey’s correction for multiple comparisons (g), (i) and (f) [FACS] or two-sided unpaired t test (f) [None]. Source data and exact P values are provided as a Source Data file.
Fig. 3
Fig. 3. ZIKV infection of human moDCs induces de novo expression of lipid-related genes.
a moDCs from 3 donors were infected for 24 h with ZIKV SD001 (MOI 0.5) and cells were FACS sorted into ZIKV− and ZIKV+ populations. RNA from Mock, ZIKV−, and ZIKV+ moDCs were subjected to csRNA-seq. b Number of upregulated (fold-change >2, false discovery rate <0.01) TSRs. c Most enriched Metascape pathways associated with genes containing upregulated promoter proximal TSRs in ZIKV+ moDCs vs ZIKV− or Mock moDCs. d De novo motif analysis of TSRs upregulated in ZIKV+ moDCs vs ZIKV− moDCs. e Heat map of csRNA-seq reads at the TSRs of selected genes implicated in the lipid metabolism. f UCSC browser visualization of the SCD locus with RNA-seq and csRNA-seq in Mock, ZIKV−, and ZIKV+ moDCs. RNA-seq and csRNA-seq are strand-specific, with positive- and negative-strand transcription displayed above and below the central line, respectively.
Fig. 4
Fig. 4. ZIKV infection of human moDCs increases SREBP recruitment and transcription of lipid-related genes.
ag ChIP-seq analysis was performed to detect SREBP TF binding to DNA in Mock, ZIKV−, or ZIKV+ moDCs from 3 donors infected for 24 h with ZIKV PRVABC59 (MOI 1). a Number of upregulated (fold-change >1.5, false discovery rate <0.1) SREBP peaks. b Most enriched Metascape pathways among genes with increased SREBP binding in ZIKV+ vs ZIKV− and Mock moDCs. c De novo motif analysis of upregulated SREBP peaks in ZIKV+ vs ZIKV− and Mock moDCs. d, e Log2 ratio of d SREBP or e csRNA-seq tags from −500 bp to +500 bp at upregulated SREBP peaks in ZIKV+ or ZIKV− vs Mock moDCs. All points representing upregulated ZIKV+ SREBP peaks are shown. Box plots show the median value and extend from the 25th to 75th percentile, while the whiskers extend from min to max values. N = 3 biologically independent experiments. ***P < 0.001 by two-sided paired t test. f UCSC browser visualization of the FASN locus with RNA-seq, SREBP ChIP-seq, and csRNA-seq in Mock, ZIKV−, and ZIKV+ moDCs. Location of SREBP (SRE) motifs is indicated. g SREBP-binding relative to csRNA-seq promoter proximal TSS upregulated in ZIKV+ vs ZIKV− and Mock moDCs. Source data and exact P values are provided as a Source Data file.
Fig. 5
Fig. 5. Treatment of moDCs with the SREBP2 inhibitor DMHCA suppresses ZIKV infection.
a Simplified model of the SREBP activation pathway. b moDCs were treated with vehicle (ethanol) or DMHCA (10 μM) for 4 h, infected with ZIKV PRVABC49 (MOI 1) for 24 h, and ZIKV-infected cells were quantified by 4G2 staining and flow cytometry. ce moDCs were infected with ZIKV PRVABC49 (MOI 1) and treated with DMHCA (10 μM) at 2.5 h post infection (pi). At 24 h pi, c intracellular and d extracellular ZIKV RNA were quantified by qRT-PCR and e infectious virions were quantitated by focus-forming assay (FFA). Data are presented as the mean ± SD. n = 4 (b, e) or n = 3 (c, d) biologically independent experiments. f moDCs were infected with ZIKV PRVABC59 (MOI 1) for 1 h, washed, and treated with vehicle (left) or DMHCA 10 μM (right) in the presence or absence of oleic acid–BSA (OA) and/or cholesterol–methyl-β-cyclodextrin (Chol) at the indicated concentrations. At 24 h pi, infectious virions were quantitated by FFA. Data are presented as the mean ± SD. n = 4, for Chol treatment, or n = 6, for all other treatments, biologically independent experiments. g moDCs were transfected with siRNAs targeting SREBF1 or SREBF2 for 24 h before infection with ZIKV SD001 (MOI 0.5). At 24 h pi, infectious virions in the supernatants were quantified by FFA. Data are presented as the mean ± SD. n = 5 (siCTL, siSREBF2) or n = 3 (siSREBF1) biologically independent experiments. Symbols represent moDCs derived from individual donors. **P < 0.01, ***P < 0.001 by two-sided unpaired t test (be) or one-way ANOVA with Dunnett’s correction for multiple comparisons (f, g). Source data and exact P values are provided as a Source Data file.

Similar articles

Cited by

References

    1. Brasil P, et al. Guillain-Barre syndrome associated with Zika virus infection. Lancet. 2016;387:1482. doi: 10.1016/S0140-6736(16)30058-7. - DOI - PubMed
    1. Bautista LE, Sethi AK. Association between Guillain-Barre syndrome and Zika virus infection. Lancet. 2016;387:2599–2600. doi: 10.1016/S0140-6736(16)30844-3. - DOI - PubMed
    1. Mlakar J, et al. Zika virus associated with microcephaly. N. Engl. J. Med. 2016;374:951–958. doi: 10.1056/NEJMoa1600651. - DOI - PubMed
    1. Rasmussen SA, Jamieson DJ, Honein MA, Petersen LR. Zika virus and birth defects–reviewing the evidence for causality. N. Engl. J. Med. 2016;374:1981–1987. doi: 10.1056/NEJMsr1604338. - DOI - PubMed
    1. de Araujo TVB, et al. Association between microcephaly, Zika virus infection, and other risk factors in Brazil: final report of a case-control study. Lancet Infect. Dis. 2018;18:328–336. doi: 10.1016/S1473-3099(17)30727-2. - DOI - PMC - PubMed

Publication types