. 2022 Sep;4(9):1150-1165.
doi: 10.1038/s42255-022-00629-2. Epub 2022 Sep 12.

Independent phenotypic plasticity axes define distinct obesity sub-types

Collaborators, Affiliations

Independent phenotypic plasticity axes define distinct obesity sub-types

Chih-Hsiang Yang et al. Nat Metab. 2022 Sep.

Abstract

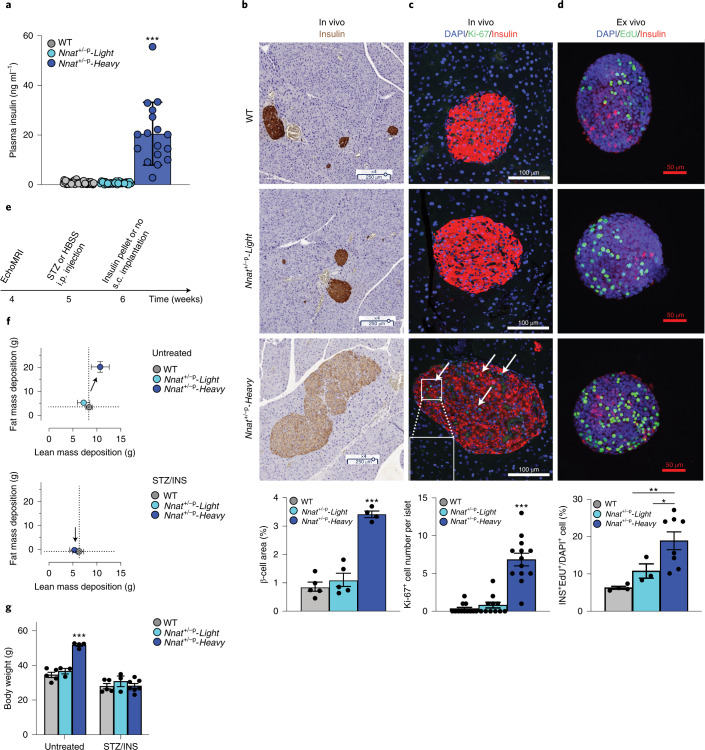
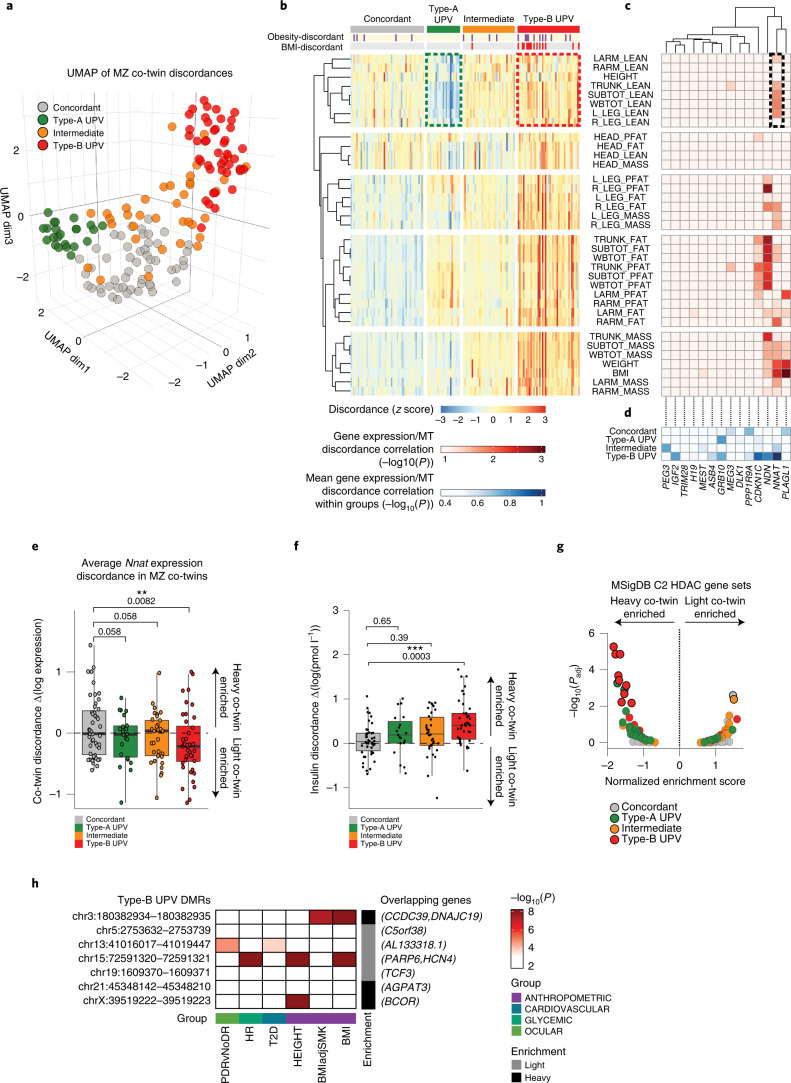
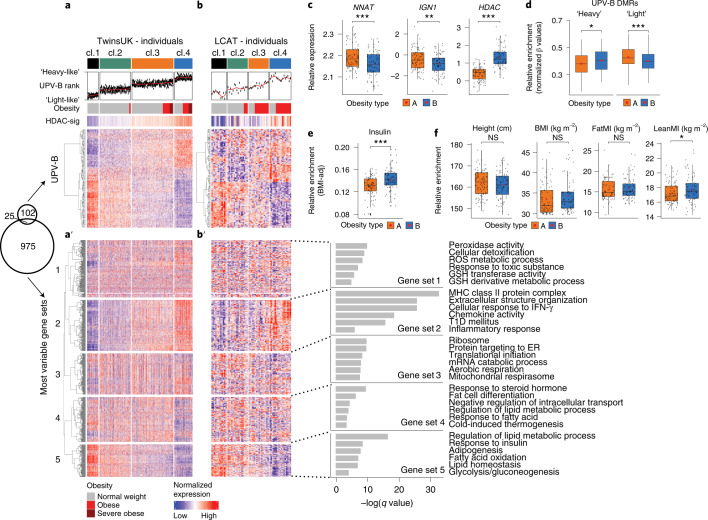
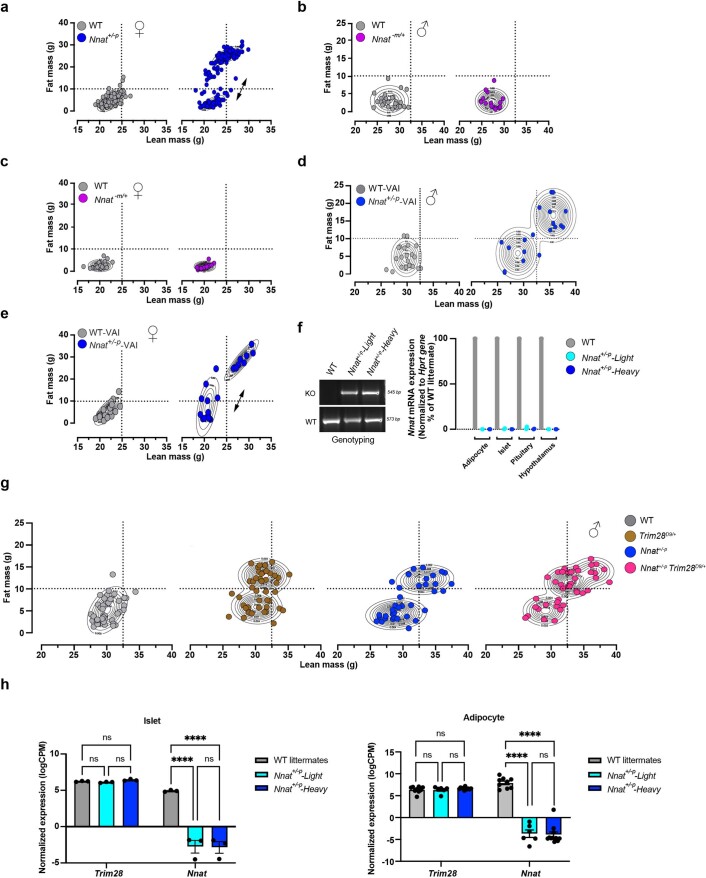
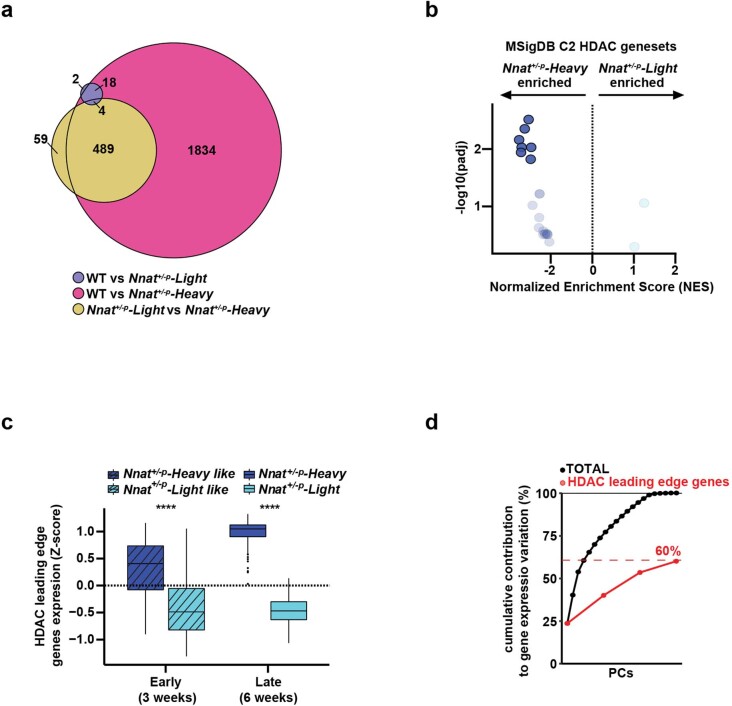
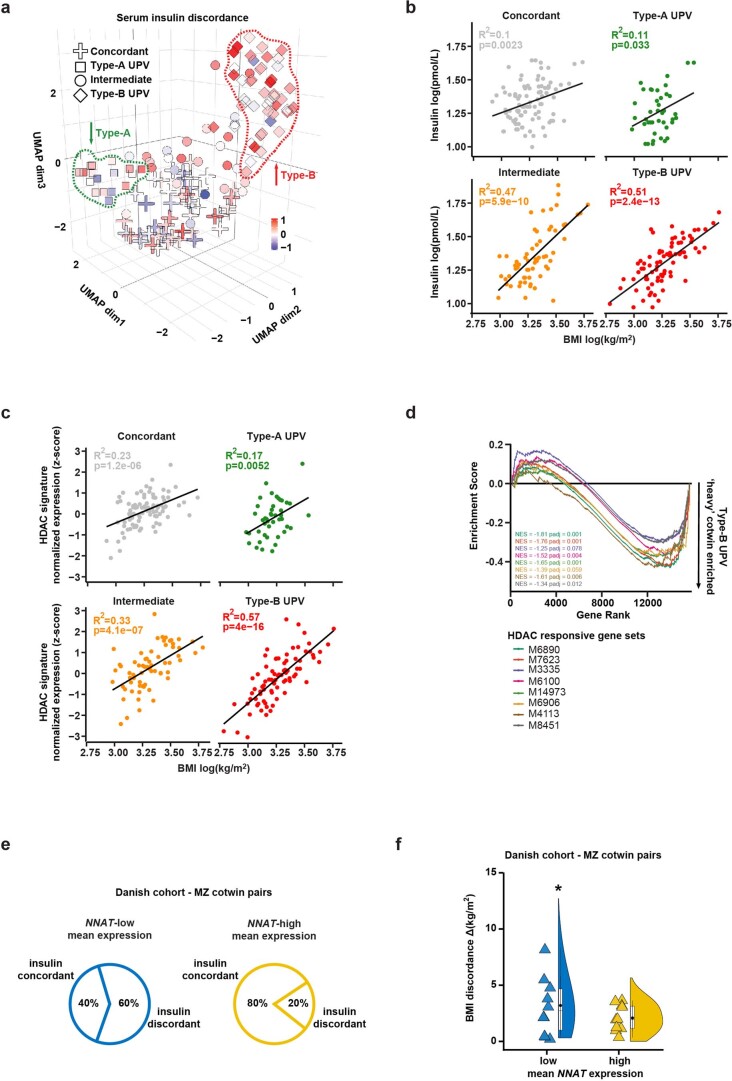
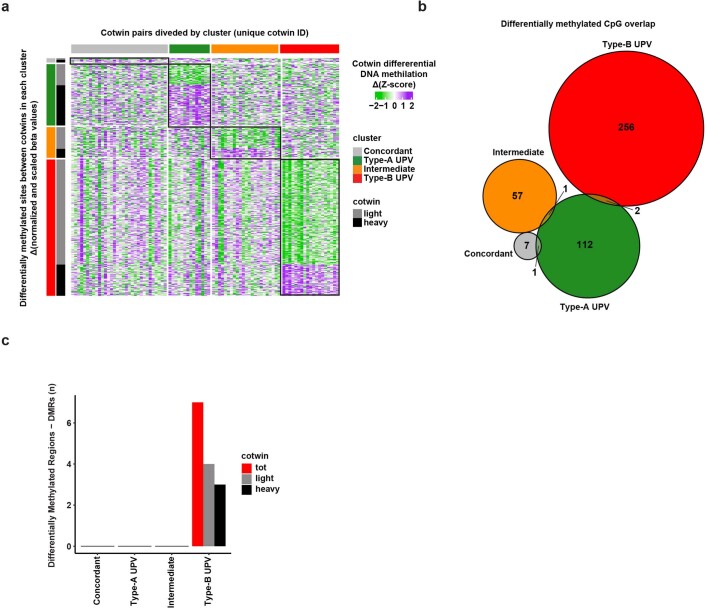
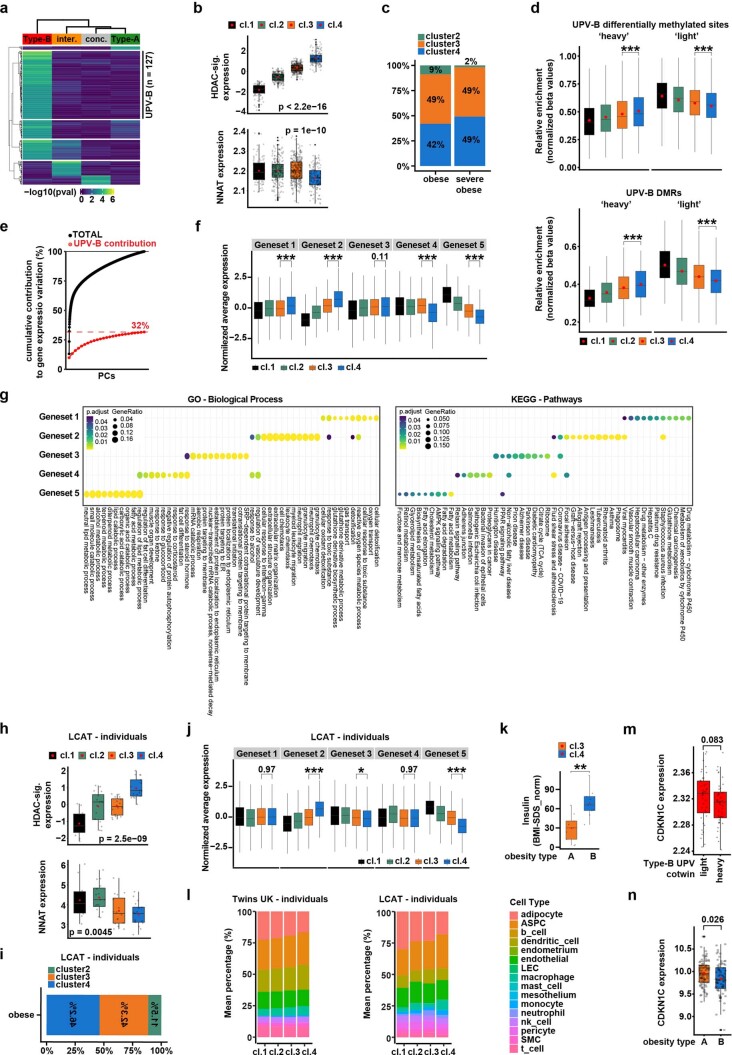
Studies in genetically 'identical' individuals indicate that as much as 50% of complex trait variation cannot be traced to genetics or to the environment. The mechanisms that generate this 'unexplained' phenotypic variation (UPV) remain largely unknown. Here, we identify neuronatin (NNAT) as a conserved factor that buffers against UPV. We find that Nnat deficiency in isogenic mice triggers the emergence of a bi-stable polyphenism, where littermates emerge into adulthood either 'normal' or 'overgrown'. Mechanistically, this is mediated by an insulin-dependent overgrowth that arises from histone deacetylase (HDAC)-dependent β-cell hyperproliferation. A multi-dimensional analysis of monozygotic twin discordance reveals the existence of two patterns of human UPV, one of which (Type B) phenocopies the NNAT-buffered polyphenism identified in mice. Specifically, Type-B monozygotic co-twins exhibit coordinated increases in fat and lean mass across the body; decreased NNAT expression; increased HDAC-responsive gene signatures; and clinical outcomes linked to insulinemia. Critically, the Type-B UPV signature stratifies both childhood and adult cohorts into four metabolic states, including two phenotypically and molecularly distinct types of obesity.


Conflict of interest statement

The authors declare no competing interests.

Figures

Fig. 1
Fig. 1. Paternal Nnat deletion triggers a bi-stable epigenetic overgrowth in mice.
a, Body composition shown for 16-week-old F1 male progeny from Nnat+/-p × FVBN/J crosses. Contour plots highlighted main clusters identified by Gaussian finite mixture modeling. b, Representative picture presented for Nnat+/p isogenic morphs and WT littermates. c, Organ masses were measured from Nnat+/p colony. Each group had at least eight animals. *Adjusted P ≤ 0.05, as assessed by one-sided Tukey’s multiple comparisons test, comparing Nnat+/p-Heavy and Nnat+/p-Light littermates. Specifically, gonadal white adipose tissue (gWAT) P < 0.0001, subcutaneous white adipose tissue (sWAT) P < 0.0001, spleen P < 0.0001, pancreas P = 0.0019, kidney P = 0.0011, liver P < 0.0001 and heart P < 0.0297. Data are presented as mean ± s.e.m. BAT, brown adipose tissue. d, The lumbar spine (L1–L5) length was measured for the Nnat+/p colony. Each group had at least five animals. In all box-plots, the lower and upper hinges represent 25th and 75th percentiles. The upper/lower whiskers represent largest/smallest observation less/greater than upper/lower hinge+1.5 × interquartile range (IQR). Central median represents 50% quantile. *Adjusted P = 0.015) as assessed by one-sided Tukey’s multiple comparisons test. e, Body composition (fat and lean mass) was measured via EchoMRI for each F1 male progeny at 4, 6, 8, 12 and 16 weeks from B6.Nnat+/-p × FVB.Trim28D9/+ crosses. Developmental trajectories according to the phenotypic groups were plotted from 4 to 16 weeks. Each trajectory had at least four animals. Data are presented as mean ± s.e.m. *P ≤ 0.05 by Student’s t-test. Source data
Fig. 2
Fig. 2. Nnat+/-p-overgrowth exhibits autonomous β-cell hyperplasia and hyperinsulinemia.
a, Plasma insulin was measured from 16-week-old male animals fasted for 6 h. Each group had at least 17 animals. ***Adjusted P ≤ 0.001, as assessed by one-sided Tukey’s multiple comparisons test. b, Insulin-positive β-cells (brown) in Nnat+/-p pancreata were detected by immunohistochemistry staining. Scale bar, 250 µm. β-cell area was quantified as percentage of the entire pancreas area. Each group had at least four animals. ***Adjusted P ≤ 0.001, as assessed by one-sided Tukey’s multiple comparisons test. c, In vivo immunofluorescence was performed for proliferating β-cells (white arrows) in primary islets from 16-week-old animals (red, insulin; blue, DAPI; green, Ki-67). Scale bar, 100 µm. Ki-67+ β-cells were quantified and each group had at least 11 islets. ***Adjusted P ≤ 0.001, as assessed by one-sided Tukey’s multiple comparisons test. DAPI, 4,6-diamidino-2-phenylindole. d, Ex vivo immunofluorescence was performed for proliferating β-cells by EdU-incorporation. Size-matched primary islets from 5–6-week-old mice were cultured for 3 days before the EdU-incorporation assay (red, insulin; blue, DAPI; green, EdU). Scale bar, 50 µm. EdU+ proliferating β-cells were quantified and each group had at least three islets. *Two-tailed P ≤ 0.05, **two-tailed P ≤ 0.01, by Welch’s t-test. e, STZ (300 mg kg−1) was administered at 5 weeks of age when the Nnat+/-p-Heavy morphs first show signs of accelerated weight gain. An equal number of subcutaneous (s.c.) insulin implants were administered after 5 days and 1 month after the STZ injection to all STZ groups such that relative euglycemia was maintained. i.p., intraperitoneal. f, Lean and fat mass gained between 4 and 12 weeks of age for untreated and STZ-treated Nnat+/-p littermates. Each group has at least three animals. INS, insulin. g, Body weight at termination highlights how Nnat+/-p-Heavy mice fail to exhibit the overgrowth phenotype on combined STZ/insulin treatment. ***Adjusted P = 0.0001, as assessed by one-sided Tukey’s multiple comparisons test. All data are presented as mean ± s.e.m. Source data
Fig. 3
Fig. 3. HDAC mediates Nnat+/-p-driven β-cell hyperplasia.
a, Heat map showing the expression of 552 differentially expressed genes (DEGs), defined as Nnat+/-p-Heavy and Nnat+/-p-Light islets transcriptome, in the indicated animals. b, Volcano plot showing DEGs and highlighting the enriched or depleted biologically relevant genes in Nnat+/-p-Heavy morphs. P values as assessed by negative binomial generalized linear model. c, The cytoscape plot of the GSEA showed the enriched or depleted gene sets in Nnat+/-p-Heavy morphs. TFs, transcription factors. d, PCA demonstrated transcriptional similarity of Nnat+/-p-Heavy-like at early stages (3 weeks) and Nnat+/-p-Heavy morphs at late stages (6 weeks) apart from Nnat+/-p-Light-like at early stages (3 weeks) and Nnat+/-p-Light morphs at late stages (6 weeks). e, Heat map shows HDAC gene set leading-edge gene expression in Nnat+/-p-Heavy-like and Nnat+/-p-Light-like morphs (early stage) and Nnat+/-p-Heavy and Nnat+/-p-Light morphs (late stage). fh, Proliferating β-cells were counted by EdU-incorporation from Nnat+/-p-Heavy and Nnat+/-p-Light morphs and are normalized to WT littermates in untreated (control, f), HDACi-treated (g) and HATi-treated (h) conditions. At least 19 islets were quantified and plotted per condition. Source data
Fig. 4
Fig. 4. Characterization of human UPV.
a, UMAP projection of MZ co-twin couples, according to 35 morphometric discordances. b, Heat map of hierarchical clustering of morphometric discordances among MZ co-twin couples. Obesity-discordant co-twins indicate that only one co-twin is affected by obesity (BMI > 30). BMI discordant co-twins, BMI difference >5 BMI points. Dashed colored boxes highlight distinct lean mass discordances between Type-A and Type-B UPV. c, Heat map showing the hierarchical clustering of Trim28/IGN1 genes based on the correlation of their expression discordance and indicated phenotypic discordances. A dashed black box highlights NNAT expression discordance correlation with phenotypic discordances of those traits that distinguish Type-A and Type-B UPV. d, Heat map showing the hierarchical clustering of Trim28/IGN1 genes based on the average correlation of their expression discordance and all phenotypic discordances, stratified by four co-twin pairs’ clusters. e, Box-plots representing discordance of NNAT expression, among MZ co-twins, belonging to the indicated clusters. **P = 0.0082, as assessed by one-tailed t-tests. f, Box-plots representing serum insulin discordance, among MZ co-twins, belonging to the indicated groups. ***P = 0.0003 as assessed by one-sided Tukey’s multiple comparisons test, following one-way analysis of variance (ANOVA). In all box-plots, lower and upper hinges indicate 25th and 75th percentiles. The upper/lower whiskers indicate largest/smallest observation less/greater than upper/lower hinge + 1.5 ×IQR. Central median indicates 50% quantile. g, GSEA results of HDAC-responsive gene sets between the ‘light’ and ‘heavy’ co-twins, belonging to the indicated MZ co-twins groups. Solid and transparent colored dots, highlight either statistically significant or not significant enrichments, respectively (adjusted P value cutoff <0.01). h, Heat map showing association of single-nucleotide polymorphisms (SNPs) and indicated phenotypic traits, within the DMRs identified between ‘light’ and ‘heavy’ Type-B UPV co-twins. White boxes indicate no significant associations (P > 1 × 103), dark-red boxes indicate genome-wide significant associations (P < 1 × 10−8). Nearest are reported. Gray and black boxes indicate the enrichment of DMR in either the ‘light’ or ‘heavy’ co-twin. BMIadjSMK, BMI adjusted by smoking; T2D, type 2 diabetes; HR, heart rate; PDR, proliferative diabetic retinopathy; PDRvNoDR, PDR versus no PDR. Source data
Fig. 5
Fig. 5. Type-B UPV signature separates adults and children into distinct phenotypic and metabolic sub-types.
a, Heat map of k-means clustering of TwinsUK individuals. Four clusters were generated according to expression of the UPV-B signature. The UPV-B ranks annotation show the median rank of everyone according to their level of expression of UPV-B signature genes, discriminating Type-B ‘heavy-like’ and ‘light-like’ individuals. The obesity annotation is based on arbitrary cutoffs of BMI (obesity, >30 BMI; severe obesity, >35 BMI). The average expression of HDAC-signature (HDAC-sig) genes (leading-edge genes from Extended Data Fig. 6d) is reported. a′, Heat map (bottom), the expression profile of the most variable genes (top 1,000) across all samples is reported, after k-means clustering into five gene sets. Venn plot (left) shows the overlap between the most variable genes and the UPV-B. b–b′, Same as in aa′, but on the LCAT cohort. The obesity annotation is based on standardized BMI arbitrary cutoffs (BMI standard score (SDS), obesity >1.88). On the right, representative results from Gene Ontology (GO) and pathway enrichment analysis for the five gene sets from the heat map of the TwinsUK individuals (a′). GO, KEGG and Molecular Signatures Database (MSigDB) databases were assessed. Related to the extended analysis in Extended Data Fig. 8g. cf, Box-plots showing the distributions of indicated gene expression profiles (c), normalized DNA methylation on UPV-B DMRs (d), metabolic traits (e) and morphometric measurements (f), between Type-A and Type-B obesities (TwinsUK individuals affected by obesity and belonging to clusters 3 and 4 (cl.3 and 4) from the heat map in a). *P ≤ 0.05, **P ≤ 0.01, ***P ≤ 0.001, NS, not significant, as assessed by two-tailed Student’s t-tests. NNAT P = 0.00036; IGN1 P value = 0.0067; HDAC P = 2.2 × 10–16; UPV-B DMRs ‘heavy’ P = 0.028; UPV-B DMRs ‘light’ P = 0.00026; insulin P = 0.001; height P = 0.4; BMI P = 0.21; FatMI P = 0.46; LeanMI P = 0.047. In all box-plots, the lower and upper hinges indicate 25th and 75th percentiles. The upper/lower whiskers indicate largest/smallest observation less/greater than upper/lower hinge + 1.5 × IQR. Central median indicates 50% quantile. GSH, glutathione; MHC, major histocompatibility; IFN, interferon; T1D, type 1 diabetes. Source data
Extended Data Fig. 1
Extended Data Fig. 1. Paternal but not maternal Nnat deletion causes bi-stable overgrowth.
a, The body composition was shown for 16 weeks old of F1 female wild-type and Nnat+/-p animals from Nnat+/-p x FVBN/J crosses. b-c, The body composition was shown for 16 weeks old F1 male (b) and female (c) wild-type and Nnatm/+ animals from Nnat-m/+ x FVBN/J crosses. d-e, The Nnat+/-p male (d) and female (e) body composition was plotted for the Nnat+/-p colony in the vivarium, VAI, U.S.A. f, Genotyping (DNA) was confirmed in the indicated Nnat+/-p morphs and WT littermate. Nnat mRNA expression was confirmed in metabolic tissues (adipocytes, islet, pituitary gland and hypothalamus) from male Nnat+/-p mice. Nnat mRNA expression was measured from two independent sets of littermate matched animals. The experiments were repeated independently 3 times with similar results. g, Body composition was measured by EchoMRI on 16-week-old wild-type (WT), Trim28D9/+, Nnat+/p and Nnat+/p Trim28D9/+ male progeny from F1 of B6.Nnat+/-p x FVB.Trim28D9/+ crosses. Contour plots highlight main clusters identified by Gaussian finite mixture modeling. h, Trim28 and Nnat (as control) gene expression were shown from islet (left) and adipocyte (right) transcriptomes from Nnat+/-p colony. Each group had at least 3 animals. All data were plotted as mean ± SEM, ns (not significant), **** (adjusted p < 0.0001) by one-sided Tukey’s multiple comparisons test. Source data
Extended Data Fig. 2
Extended Data Fig. 2. Nnat+/-p-Heavy morphs exhibit accelerated post-weaning growth kinetics associated with hyperinsulinemia.
a, Birth weight was measured for Nnat+/-p male newborns. Each group had at least 22 animals. Data are presented as mean ± SEM. b, Fat (top) and lean (middle) mass deposition between 4 to 7 weeks were plotted for male Nnat+/-p colony. Daily food intake (button) was measured and the average daily food intake were calculated per week between 4 to 7 weeks for male Nnat+/-p colony. All data were plotted as mean ± SEM. Adjusted p-values by one-sided Tukey’s multiple comparisons test. Top panel *** p < 0.0001; middle panel * p = 0.016, *** p < 0.0001; lower panel * p = 0.0019. c, Daily food intake normalized to body weight (top) and body weight deposition normalized to average daily food intake per week (button) between 4 to 7 weeks were plotted for male Nnat+/-p colony. All data were plotted as mean ± SEM. Adjusted p-values by one-sided Tukey’s multiple comparisons test. Lower panel * p = 0.0104, ** p = 0.002, *** p < 0.0001. d, Circulating growth factors (insulin-like growth factor 1, IGF1; growth hormone, GH; and insulin, INS) were detected in plasma of Nnat+/p males and WT littermates at 4 and 6 weeks of age. Each group had at least 3 animals. All data were plotted as mean ± SEM. Adjusted p-values by one-sided Tukey’s multiple comparisons test. ** p = 0.0001, *** p < 0.0001. Source data
Extended Data Fig. 3
Extended Data Fig. 3. Nnat+/-p-Heavy morphs exhibit normal glucose tolerance and islet functionality.
a, H&E staining was performed to locate islets (light pink areas, arrows) in Nnat+/-p pancreata. Scale bar, 500 µm. The experiment was repeated independently 3 times with similar results. b, Islet area was quantified as percent of the entire pancreas area. Each group had 3 thin sections from at least 6 animals. All data were plotted as mean ± SEM, *** (adjusted p < 0.0001) by one-sided Tukey’s multiple comparisons test. c, Total insulin content was extracted from whole pancreata, normalized to total insulin in WT littermates. Each group had at least 5 animals. All data were plotted as mean ± SEM, *** (adjusted p = 0.0008) by one-sided Tukey’s multiple comparisons test. d, Glucagon and somatostatin staining was performed on Nnat+/-p pancreata. Scale bar, 100 µm. The experiment was repeated independently 3 times with similar results. e, Cell death (apoptosis) event was examined via TUNEL assay in the pancreatic section from Nnat+/-p and WT littermates at 16 weeks old. DNase treated sample as positive control from the same animals. The black circle heights the islet area. Each group had at least 3 animals. Scale bar, 100 μm f, Basal insulin secretion was measured from size-matched β-cell spheroids. Each group had 8 spheroids. All data were plotted as mean ± SEM. g, h Glucose-stimulated insulin secretion assays were performed on primary islets (g) and spheroids (h) from 16 weeks old Nnat+/-p and WT littermates. 2.8 mM glu.: 2.8 mM glucose and 16.7 mM glu.: 16.7 mM glucose. At least 6 primary islets and 4 spheroids were in each group. All data were plotted as mean ± SEM. i, Oral glucose tolerance test (OGTT) was performed in 16 weeks old Nnat+/-p and WT mice (n = 4-5) fasted for 6 hours and showed relatively normal glucose tolerance in Nnat+/-p-Heavy morphs. All data were plotted as mean ± SEM. j, Growth trajectories for untreated and STZ-treated Nnat+/-p animals and WT littermates between 4 and 12 weeks of age. All data were plotted as mean ± SEM. Source data
Extended Data Fig. 4
Extended Data Fig. 4. Dysregulated HDAC-related transcriptome precedes the Nnat+/-p-overgrowth.
a, Venn diagram of differential gene expression analyses of islets transcriptome of 6 weeks old mice comparing between Nnat+/-p-Heavy, Nnat+/-p-Light morphs and WT littermates. b, GSEA results of HDAC-responsive gene sets between the Nnat+/-p-Light and Nnat+/-p-Heavy morphs, showing a specific enrichment in the latter. Solid and transparent colored dots, highlight either statistically significant or not significant enrichments, respectively (adjusted p-value cutoff < 0.05). c, Gene expression (Z-score) comparison was performed for HDAC gene set leading-edge genes between Nnat+/-p-Heavy-like and Nnat+/-p-Light-like morphs (early stage) and Nnat+/-p-Heavy and Nnat+/-p-Light morphs (late stage). **** (p ≤ 0.001) as assessed by two-tails t-tests. In all box-plots, the lower and upper hinges = 25th and 75th percentiles. The upper/lower whiskers = largest/smallest observation less/greater than upper/lower hinge + 1.5 * IQR. Central median = 50% quantile. d, Estimate of the contribution of the HDAC-responsive genes, to the overall transcriptional variability between WT, Nnat+/-p-Heavy and Nnat+/-p-Light mice. Following PCA, the dotplot shows either the cumulative contribution of all principal components (PCs) to gene expression variation (black dots/line), or the contribution of the top four PCs (red dots/line), mostly associated with the HDAC-leading-edge genes from (b). The cumulative contribution of these four PCs is describing 58.7% of total gene expression variation. Source data
Extended Data Fig. 5
Extended Data Fig. 5. Characterization of the concordant/discordant MZ co-twin groups.
a, Boxplot showing the inter-quartile ranges (IQR) of co-twin discordance indices for all the available features in either MZ or dizygotic (DZ) co-twins. b, Boxplot showing the MZ co-twin discordance indices for the indicated morphometric features, in the concordant/discordant groups identified. A horizontal dashed line highlights zero values of the discordance index (that is, concordance). Vertical dashed lines separate fat/lean/total mass and percentage of fat from the indicated body parts. c, UMAP projection of MZ co-twin couples from TwinsUK (n = 153), according to 35 morphometric discordances. Each observation represents a twin pair, colored by the whole-body fat (above) or lean (below) mass discordance (calculated as the difference between log-transformed measurements). The different shapes of the co-twin pairs represent the identified groups, as indicated. Dotted red/green lines highlight the Type-A and Type-B UPV and show their differences with respect to lean mass discordance. d, Box-plots representing the average height, between the ‘light’ and ‘heavy’ MZ co-twins, belonging to the indicated groups. Solid horizontal lines represent medians. The p-value is calculated by ANOVA. e, Boxplot showing the MZ co-twin discordance indexes for the indicated morphometric features, after height-normalization, in the concordant/discordant groups identified. A horizontal dashed line highlights the zero value of the discordance index (that is, concordance). Box plots in (b,d,e) show the lower and upper hinges = 25th and 75th percentiles. The upper/lower whiskers = largest/smallest observation less/greater than upper/lower hinge + 1.5 * IQR. Central median = 50% quantile. Source data
Extended Data Fig. 6
Extended Data Fig. 6. UPV groups are not determined by genetic differences between MZ cotwins.
a, Violin-plots showing the distribution of missing data (as percentage of the total) among individuals’ genotypes, stratified by UPV groups. This data show that the degree of genome wide missingness is not correlated to UPV groups. b, Table summarizing the amount of genetically identical loci among MZ cotwins and genetic differences, only due to missing data. c, Barplot summarizing the data in table b. MZ cotwins were identical on > 99.9% of the analyzed loci and differences due to missing data account on average for ~ 0.06% of the total data, among all UPV groups. d, Heatmaps showing the distribution of SNPs that resulted different between MZ cotwins, only due to missing data. On the left, the cotwin pairs are ordered by the UPV sub-types. On the right, they are ordered according to hierarchical clustering. These data show that neither the degree of missingness, nor the specific genomic positions of missing data showed any correlation to UPV sub-types. e, Same as in a, on the indicated genesets. These data show no specific enrichment of missingness in any UPV group, nor any genesets, arguing against evidence for genotypic differences underlying the detected transcriptional signatures. All p-values as assessed by ANOVA.
Extended Data Fig. 7
Extended Data Fig. 7. Type-A and Type-B UPV show specific metabolic and molecular profiles.
a, UMAP projection of MZ cotwin couples form the TwinsUK (n = 153), according to 35 morphometric discordances. Each dot represents a cotwin pair, colored by their serum insulin level discordance (calculated as the difference between log-transformed measurements). The different shapes of the cotwin pairs represented the identified groups. Dotted red/green lines highlight the Type-A and Type-B UPV and show the increase insulin levels (that is, relative hyperinsulinemia) in Type-B ‘heavy’ cotwins. b,c, Scatterplots showing the correlation between BMI and insulin level (b) or the HDAC-signature expression (c), in the indicated cotwin groups. Both showing stronger correlation in the Type-B UPV cotwins (BMI/insulin: R2 = 0.51, p-value=2.4-13, BMI/insulin: R2 = 0.57, p-value=4-16). R2 and p-values as calculated by fitted linear regression models. d, Gene set enrichment analysis (GSEA) results of HDAC-related gene sets between the ‘light’ and ‘heavy’ cotwins, belonging to the Type-B UPV group. Gene sets specifically enriched in ‘heavy’ cotwins of the Type-B UPV cluster are shown. NES = normalized enrichment score; padj = adjusted p-value. e, Pie-charts, showing the distribution of insulin-concordant/discordant MZ cotwin pairs, from the Danish twin cohort, in either low- (blue chart), or high-NNAT expressing couples (yellow chart). The definition of insulin-concordant/discordant couples was obtained by Gaussian finite mixture modeling (see Methods section). f, Box- and violin-plots of BMI discordance distributions, represented as inter co-twin differences in the Danish twin cohort. Solid horizontal lines and black points represent means and medians in the box-plots, respectively. * p-value = 0.03, as assessed by the Bartlett’s test of homogeneity of variances. Blue and yellow triangles represent co-twin pairs expressing averaged low and high NNAT levels, respectively. In box-plots, the lower and upper hinges = 25th and 75th percentiles. The upper/lower whiskers = largest/smallest observation less/greater than upper/lower hinge + 1.5 * IQR. Central median = 50% quantile. Source data
Extended Data Fig. 8
Extended Data Fig. 8. Type-A and Type-B UPV are associated to distinct DNA methylation patterns.
a, heat map showing the differentially DNA methylated sites among ‘heavy’ and ‘light’ cotwins belonging to the indicated groups identified in the TwinsUK cohort. SeSAMe cutoffs: adjusted p-value < 0.05; effect size > 0.05. Dark-gray and black boxes highlight DNA methylation enrichment in either the ‘light’ or ‘heavy’ cotwin, respectively. b, Venn diagram showing the overlap between differentially DNA methylated sites from the indicated cotwin groups and highlighting the specificity of these epigenetic profiles. c, Barplots showing the amount of differentially methylated regions (DMRs) among ‘heavy’ and ‘light’ cotwins belonging to the indicated groups identified in the TwinsUK cohort. Only in Type-B UPV, DMRs were detected. Dark-gray and black bars highlight DNA methylation enrichment in either the ‘light’ or ‘heavy’ cotwin, respectively. Source data
Extended Data Fig. 9
Extended Data Fig. 9. Characterization of adults’ and childrens’ clusters.
a, Heat map of hierarchical clustering of DEGs between cotwins belonging to indicated groups. b, Boxplot showing the mean expression of HDAC-signature (above) or NNAT (below), among indicated clusters. p-values (2.2e-16; 1e-10) from ANOVA. c, Barplot showing obesity distribution among clusters. d, Boxplot showing normalized beta values for differentially methylated sites (above, p = 2.2e-16 and 2.2e-16) or regions (below, p = 0.0005 and 2.6e-8), among cotwins. ‘Heavy’- and ‘light’ enriched DNA methylated sites are reported. *** (p ≤ 0.001) from two-tails t-tests. e, UPV-B genes estimate of contribution to overall transcriptional variability in the TwinsUK cohort. Cumulative contribution of all principal components (black dots/line) and contribution of the most UPV-B-associated PCs (red dots/line) are reported. f, Boxplot showing mean expression of genes belonging to five genesets form Fig. 5b, among clusters. *** (p = 2.2e-16) from one-sided Tukey’s multiple comparisons test, following significant ANOVA. g, Complete gene ontology and pathway enrichment analysis for the 5 genesets from the heat map of TwinsUK individuals. h, Boxplot showing mean expression of HDAC-signature (above) or NNAT (below), among the clusters of the LCAT cohort. p-values from ANOVA. i, Barplot showing obesity distribution, among cluster in the LCAT cohort. j, Boxplot showing mean expression of genes belonging to the five genesets form Fig. 5b, among clusters in the LCAT cohort. * (p = 0.004), *** (p = 2.2e-16) from one-sided Tukey’s multiple comparisons test, following significant ANOVA. k, Box-plots showing distributions of serum insulin levels normalized on BMI-SDS, among children with obesity belonging to indicated clusters. ** (p = 0.0016) from two-tails t-tests. l, Barplots showing average cell-type compositions among transcriptional profiles of individuals belonging to indicated clusters. ASPC = adipose stem and progenitor cells, LEC = lymphatic endothelial cells, SMC = smooth muscle cells. m-n, Box-plots showing CDKN1C expression between ‘light’ and ‘heavy’ Type-B UPV cotwins (m) and Type-A/-B obesities (n). In all box-plots, lower and upper hinges = 25th and 75th percentiles. The upper/lower whiskers = largest/smallest observation less/greater than upper/lower hinge + 1.5 * IQR. Central median = 50% quantile. p-values from one-tail (m) or two-tails (n) t-tests. Source data

Comment in

References

    1. Fisher RA. The correlation between relatives on the supposition of Mendelian inheritance. Trans. R. Soc. Edin. 1918;52:399–433. doi: 10.1017/S0080456800012163. - DOI
    1. Fisher RA. The causes of human variability. Eugen. Rev. 1919;10:213–220. - PMC - PubMed
    1. Wright S. The relative importance of heredity and environment in determining the piebald pattern of guinea-pigs. Proc. Natl Acad. Sci. USA. 1920;6:320. doi: 10.1073/pnas.6.6.320. - DOI - PMC - PubMed
    1. Gärtner K. A third component causing random variability beside environment and genotype. A reason for the limited success of a 30 year long effort to standardize laboratory animals? Lab. Anim. 1990;24:71–77. doi: 10.1258/002367790780890347. - DOI - PubMed
    1. Jonsson H, et al. Differences between germline genomes of monozygotic twins. Nat. Genet. 2021;53:27–34. doi: 10.1038/s41588-020-00755-1. - DOI - PubMed

Publication types