. 2022 Oct;28(10):2162-2170.
doi: 10.1038/s41591-022-01976-z. Epub 2022 Sep 12.

RNF43 mutations predict response to anti-BRAF/EGFR combinatory therapies in BRAFV600E metastatic colorectal cancer

Affiliations

RNF43 mutations predict response to anti-BRAF/EGFR combinatory therapies in BRAFV600E metastatic colorectal cancer

Elena Elez et al. Nat Med. 2022 Oct.

Abstract

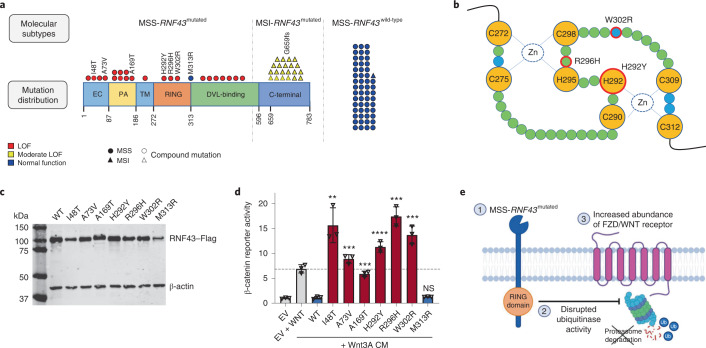
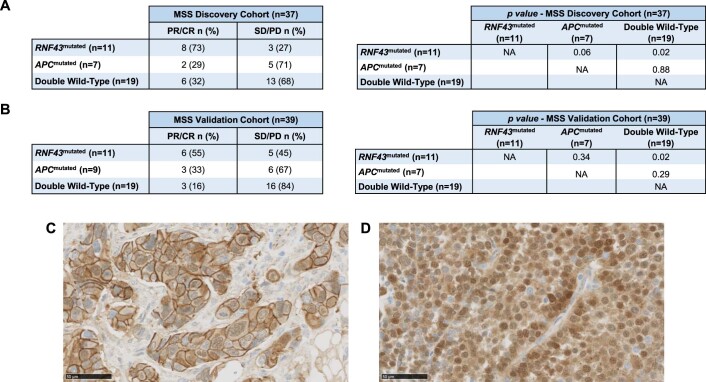
Anti-BRAF/EGFR therapy was recently approved for the treatment of metastatic BRAFV600E colorectal cancer (mCRCBRAF-V600E). However, a large fraction of patients do not respond, underscoring the need to identify molecular determinants of treatment response. Using whole-exome sequencing in a discovery cohort of patients with mCRCBRAF-V600E treated with anti-BRAF/EGFR therapy, we found that inactivating mutations in RNF43, a negative regulator of WNT, predict improved response rates and survival outcomes in patients with microsatellite-stable (MSS) tumors. Analysis of an independent validation cohort confirmed the relevance of RNF43 mutations to predicting clinical benefit (72.7% versus 30.8%; P = 0.03), as well as longer progression-free survival (hazard ratio (HR), 0.30; 95% confidence interval (CI), 0.12-0.75; P = 0.01) and overall survival (HR, 0.26; 95% CI, 0.10-0.71; P = 0.008), in patients with MSS-RNF43mutated versus MSS-RNF43wild-type tumors. Microsatellite-instable tumors invariably carried a wild-type-like RNF43 genotype encoding p.G659fs and presented an intermediate response profile. We found no association of RNF43 mutations with patient outcomes in a control cohort of patients with MSS-mCRCBRAF-V600E tumors not exposed to anti-BRAF targeted therapies. Overall, our findings suggest a cross-talk between the MAPK and WNT pathways that may modulate the antitumor activity of anti-BRAF/EGFR therapy and uncover predictive biomarkers to optimize the clinical management of these patients.


Conflict of interest statement

C.C. reports receiving honoraria and speaker’s bureau compensation from Servier, Bayer, Merck, Amgen, Pierre Fabre, MSD, Roche and Nordic Pharma and research grants from Merck, Servier and Amgen. D.G. was an employee of Novartis and was a shareholder while this work was being conducted. D.P.K. is an employee of Novartis. E.E. reports receiving honoraria for an advisory role, travel grants and research grants (past 5 years) from Hoffmann-La Roche, Bristol-Myers Squibb, Servier, Amgen, Merck Serono, Array Biopharma, Sanofi and Bayer. Her institution received honoraria due to her investigator contribution in clinical trials from Array Biopharma, MSD, Abbvie, Amgen, GlaxoSmithKline, AstraZeneca, Merck Sharp & Dohme, Bristol-Myers Squibb, Novartis, Boehringer Ingelheim, Hoffmann-La Roche, Medimmune, Pierre-Fabre and Sanofi Aventis. F.P. received honoraria from Amgen, Merck Serono, Lilly, Sanofi, Bayer, Servier, MSD, AstraZeneca and Organon and research grants from AstraZeneca and BMS. G.K. is an employee of Novartis. G.V. has received a speaker’s fee from MSD and Pierre Fabrer and has held an advisory role with AstraZeneca. J.R. declares receiving honoraria from Sanofi and travel and accommodation expenses from Amgen, Merck and Sanofi. J.T. reports having a personal financial interest in the form of a scientific consultancy role for Array Biopharma, AstraZeneca, Avvinity, Bayer, Boehringer Ingelheim, Chugai, Daiichi Sankyo, F. Hoffmann-La Roche, Genentech, HalioDX, Hutchison MediPharma International, Ikena Oncology, Inspirna, IQVIA, Lilly, Menarini, Merck Serono, Merus, MSD, Mirati, Neophore, Novartis, Ona Therapeutics, Orion Biotechnology, Peptomyc, Pfizer, Pierre Fabre, Samsung Bioepis, Sanofi, Seattle Genetics, Scandion Oncology, Servier, Sotio Biotech, Taiho, Tessa Therapeutics and TheraMyc, as well as educational collaboration with Imedex, Medscape Education, MJH Life Sciences, PeerView Institute for Medical Education and Physicians Education Resource (PER). P.N. reports receiving honoraria or consultation fees from Novartis, Bayer and MSD Oncology and had travel and accommodation paid for or reimbursed by Novartis. R.A.T. reports receiving a research grant related to this study from Novartis and research grants unrelated to this study from AstraZeneca and Beigene. R.D. declares an advisory role for Roche and Boehringer Ingelheim and received a speaker’s fee from Roche, Boehringer Ingelheim, Ipsen, Amgen, Servier, Sanofi, Libbs and Merck Sharp & Dohme and research grants from Merck and Pierre Fabre. R.P.-L. has acted in a consulting or advisory role for Roche, and she has participated in speaker bureaus sponsored by Roche and Pfizer. She is also the principal investigator in research grants to VHIO funded by AstraZeneca and Roche. S. Lonardi declares no conflict of interest inside the scope of the present work but declares interests in other projects from a consulting or advisory role (Amgen, Merck Serono, Lilly, AstraZeneca, Incyte, Daiichi-Sankyo, Bristol-Myers Squibb, Servier and MSD); speaker’s bureau compensation from Roche, Lilly, Bristol-Myers Squibb, Servier, Merck Serono, Pierre-Fabre, GSK and Amgen; and research funding from Amgen, Merck Serono, Bayer, Roche, Lilly, AstraZeneca and Bristol-Myers Squibb. The other authors declare no conflicts of interest.

Figures

Fig. 1
Fig. 1. Study design.
A total of 166 patients with mCRCBRAF-V600E were included in the study from discovery (n = 46), validation (n = 52) and control (n = 68) cohorts. WES of germline DNA, baseline tumor DNA and/or baseline plasma cfDNA from 28 patients was performed. Targeted NGS was used to assess RNF43 tumor mutation status for the 18 remaining patients from the discovery cohort and all tumors from the validation and control cohorts. Genomic profiles and MSS/MSI-RNF43 molecular subtypes were compared with clinical response data (ORR, mPFS and mOS) using dNdScv maximum-likelihood unbiased mutation enrichment analysis. In vitro assays were used to assess the functional impact of RNF43 mutations detected in patient samples (see more in Fig. 6).
Fig. 2
Fig. 2. Clinical responses to BRAF/EGFR inhibition according to MSS/MSI and RNF43 status.
a,b, Waterfall plots representing best observed response in the mCRCBRAF-V600E discovery cohort (n = 44) (a) and validation cohort (n = 42) (b), measured as percentage best change from baseline according to RECIST 1.1 criteria (Methods). Colors refer to molecular subtypes: MSS-RNF43wild-type tumors (yellow), MSS-RNF43mutated tumors (blue) and MSI-RNF43mutated tumors (gray).
Fig. 3
Fig. 3. Survival analysis of patients undergoing BRAF/EGFR inhibition according to MSS/MSI and RNF43 status.
a,b, Kaplan–Meier curves representing PFS of patients with RNF43wild-type (n = 29) and RNF43mutated (n = 23) tumors (a) and combined RNF43 and MSS/MSI status (MSS-RNF43wild-type (n = 28), MSS-RNF43mutated (n = 11) and MSI-RNF43mutated (n = 12)) (b). c,d, OS of patients with RNF43wild-type (n = 29) and RNF43mutated (n = 23) tumors (c) and combined RNF43 and MSS/MSI status (MSS-RNF43wild-type (n = 28), MSS-RNF43mutated (n = 11) and MSI-RNF43mutated (n = 12)) (d). Cox models were used to obtain HRs with 95% CIs, and the two-sided log-rank test was used for statistical comparisons without adjustment for multiplicity. Colors indicate molecular subtypes: RNF43wild-type tumors with or without MSS (yellow), RNF43mutated tumors with or without MSS (blue) and MSI-RNF43mutated tumors (gray). Significant values are shown in bold. m, months; NR, not reported; Ref., reference.
Fig. 4
Fig. 4. Univariate and multivariate Cox regression models.
a,b, Analysis performed in the validation cohort (n = 52) for PFS (a) and OS (b). Univariate HRs along with 95% CIs are represented for each prognostic factor. P values were estimated by means of the two-sided log-rank test in the univariate analysis and by means of the Cox model in the multivariate analysis (two-sided). Significant values are shown in bold. ECOG, Eastern Cooperative Oncology Group performance; ICI, immune checkpoint inhibitor.
Fig. 5
Fig. 5. Predictive value of MSS/MSI-RNF43 status.
ad, Kaplan–Meier curves representing PFS (a) and OS (b) for patients with mCRCBRAF-V600E undergoing anti-BRAF/EGFR therapy in the validation cohort (anti-BRAF/EGFR as second or third line, n = 39) and PFS (c) and OS (d) in patients in the control cohort not exposed to BRAF inhibition (n = 67 second and third treatment lines; Extended Data Fig.7). Cox models were used to obtain HRs with 95% CIs, and the two-sided log-rank test was used for statistical comparisons without adjustment for multiplicity. Colors refer to molecular subtypes: MSS-RNF43wild-type (yellow) and MSS-RNF43mutated (blue). Significant values are shown in bold.
Fig. 6
Fig. 6. Functional analysis of RNF43 mutations.
a, Distinct localization and functional impact of RNF43 mutations among patients with mCRCBRAF-V600E treated with anti-BRAF/EGFR therapy according to MSS/MSI and RNF43 molecular status (n = 98). MSI CRCs (n = 21) carried a mutation encoding G659fs, while MSS CRCs were divided into MSS-RNF43mutated (n = 22) and MSS-RNF43wild-type (n = 54) tumors. Numbers indicate the amino acid residue in the RNF43 protein sequence. The MSS-RNF43mutated subtype harbored mutations mainly in the RNF43 N-terminal domain. Colors indicate the effect of the mutation on protein function: loss of function (LOF) (red), moderate loss of function (yellow) and normal function (blue); symbols reflect MSS/MSI status (circle and triangle, respectively) and the presence of a compound mutation (discontinuous border). b, Illustration of the ‘cross-brace’ topology of the RING domain containing a highly conserved sequence of cysteine–histidine residues that coordinates two atoms of zinc and four hydrophobic residues that are involved in binding to E2 (canonical sequence, CX2CX(9–39)CX(1–3)HX(2–3)CX2CX(4–48)CX2C). Figure adapted from ref. , Frontiers Media (CC BY 4.0 license). Mutations encoding H292Y, R296H and W302R in the RING domain of RNF43 are circled in red, while the mutation encoding M313R is located right outside the RING protein domain and likely for this reason did not affect RNF43’s ubiquitinase function. The four conserved residues are shown in blue. c, Western blot quantification of Flag-tagged RNF43 protein ectopically expressed in the HEK293T cell line; β-actin, loading control. This experiment was repeated twice obtaining the same protein expression levels. d, In vitro luciferase reporter assays representing levels of β-catenin activation (y axis) upon ectopic expression of RNF43 mutants (x axis) in HEK293T cells, following stimulation with Wnt3A conditioned medium (CM). One representative experiment is shown. The assay was performed three times with basically identical results. The statistical significance of all mutants relative to wild-type protein was obtained using a two-sided Student’s t-test (**P < 0.01, ***P < 0.001, ****P < 0.0001; NS, not significant). Empty vector (EV) and EV + WNT (control conditions) are shown in gray, RNF43 alterations that behaved as loss-of-function variants are shown in red and wild-type protein and the M313R variant are shown in blue. e, Graphical representation of the impact of RNF43 mutations (1) in impairing the ubiquitinase activity of the protein (2), resulting in the accumulation of FZD/WNT receptors in the cell membrane (3). Ub, ubiquitin. Source data
Extended Data Fig. 1
Extended Data Fig. 1. Patients’ characteristics.
A) Patient and therapy flowchart. Specific clinical and genetic characteristics of mCRCBRAF-V600E compared to mCRCBRAF-wild-type tumors. Schematic description of the anti-BRAF/EGFR combinatorial therapies (doublet vs triplet) for patients with mCRCBRAF-V600E. B) Clinical characteristics of patients in the discovery (n = 46) and validation (n = 52) cohorts. Abbreviations: ECOG PS, Eastern Cooperative Oncology Group Performance Status; ICIs, immune checkpoint inhibitors; MSI-high, microsatellite instability high; MSS, microsatellite stable.
Extended Data Fig. 2
Extended Data Fig. 2. Bioinformatics pipeline for genomic data analysis.
A) Description of the Sarek bioinformatics pipeline, a Nextflow-based pipeline that integrates all the processing, mapping, variant calling, and QC steps, used for the WES analysis. B) WES based on responders vs non-responders from the discovery cohort (n = 28) followed by dNdScv maximum-likelihood unbiased mutation enrichment analysis was used as the genomic biomarker discovery strategy on 55 biological samples from mCRCBRAF-V600E patients collected at baseline to anti-BRAF/EGFR ± MEKi therapies. The FastQ files have been deposited in the European Genome-phenome Archive (EGA, https://ega-archive.org) biorepository. The code of the bioinformatics pipelines can be found at https://github.com/nf-core/sarek and at https://github.com/jfnavarro/scitron. Abbreviations: cfDNA, cell-free DNA; CNA, copy number alteration; QC, quality control; PDX, patient-derived xenograft.
Extended Data Fig. 3
Extended Data Fig. 3. The utility of liquid biopsy to assess BRAF and RNF43 mutational status in patiets with mCRCBRAF-V600E treated with anti-BRAF/EGFR combinatorial therapies.
A) WES was performed in 55 baseline biological samples from 19 gDNA, 22 tDNA, 9 cfDNA, and 5 pdxDNA from 28 patients with mCRCBRAF-V600E from the discovery cohort treated with anti-BRAF/EGFR combinatorial therapies. The presence of the BRAFV600E and RNF43 mutations was interrogated in tumor-derived and plasma-derived samples. B) Mutation allele frequencies (MAF) of the BRAF and RNF43 specific mutations are shown to gDNA, tDNA, and pdxDNA from patients with multiple samples which are available. C) BRAFV600E and RNF43 mutations were detected not only in tDNA and/or pdxDNA but also in available cfDNA samples, suggesting the utility of liquid biopsy for the assessment of these biomarkers. Abbreviations: gDNA, germline DNA; tDNA, tumor DNA; cfDNA, cell-free DNA; MSI, microsatellite instability high; MSS, microsatellite stable; pdxDNA, patient-derived xenograft DNA.
Extended Data Fig. 4
Extended Data Fig. 4. Overall response rate (ORR) (%) of the discovery (n = 45, A–C) and validation (n = 50, D–F) cohorts and diagnostic performance analyses (G) defined by MSS/MSI and RNF43 mutation statuses.
A) Patients with RNF43mutated tumors exhibited an increased ORR (63%) compared to patients with RNF43wild-type (31%). B) There were no significant differences between ORRs according to MSI/MSS status (50% and 43%, respectively). C) Interestingly, patients with mCRCBRAF-V600E with MSS-RNF43mutated tumors demonstrated increased ORR (73%) compared to the other groups, as MSI-RNF43mutated and MSS-RNF43wild-type (50% and 31%, respectively) (P = 0.03). Chi-square test was used for the statistical analysis. D–F) ORR of the validation cohort including 50 patients with mCRCBRAF-V600E tumors treated with anti-BRAF/EGFR combinatorial therapies in 2nd or 3rd line. D) RNF43mutated group exhibited an increased ORR (36%) compared to RNF43wild-type group (21%). E) There were no significant differences between MSI/MSS status (31% and 17%, respectively). F) Interestingly, MSS-RNF43mutated group showed increased ORR (54%) compared to the other groups, MSI-RNF43mutated and MSS-RNF43wild-type (18% and 21%), respectively (P = 0.02). Chi-square test was used for the statistical analysis (*P < 0.05). G) Table showing results of the accuracy, sensitivity, specificity, and positive (PPV) and negative predictive value (NPV) calculated to quantify the diagnostic performance of statuses of each potential biomarker (MSS/MSI and RNF43 separated, and MSS/MSI-RNF43 combined, in the discovery and validation cohorts). Abbreviations: MSI, microsatellite instability high; MSS, microsatellite stable.
Extended Data Fig. 5
Extended Data Fig. 5. Waterfall plots depicting different molecular subtypes.
A) Integrated waterfall plot showing best change in the total diameter of target lesions from baseline in 86 patients with mCRCBRAF-V600E tumors treated with anti-BRAF/EGFR combinatory therapies (discovery cohort, n = 44, plus validation cohort, n = 42). As a common in real-world clinical practice for aggressive tumors like mCRCBRAF-V600E, images from a proportion of patients (n = 12) were not available, mostly due to rapid clinical deterioration. B–D) Waterfall plots including patients with the different molecular subtypes: B) MSI-RNF43mutated tumors are shown in gray, C) MSS-RNF43wild-type tumors are shown in yellow, and D) MSS-RNF43mutated tumors are shown in blue. E) The post-contrast CT scan at baseline shows multiple liver metastases (yellow arrows) in a patient with mCRCBRAF-V600E with a MSS-RNF43mutated tumor. F) The post-contrast CT scan after 3 months of treatment shows marked reduction in size of the liver metastases (yellow arrows); some of the lesions are no longer seen in the follow-up CT-scan (yellow circles). Abbreviations: MSI, microsatellite instability high; MSS, microsatellite stable.
Extended Data Fig. 6
Extended Data Fig. 6. Kaplan-Meier curves of PFS and OS from patients with mCRCBRAF-V600E tumors (discovery cohort, n = 45) treated with anti-BRAF/EGFR combinatory therapies with regard to RNF43 mutations (left) and RNF43 mutations combined with MSS/MSI status (right).
A) PFS of patients with RNF43mutated (n = 19) and RNF43wildtype (n = 26) tumors and B) combined RNF43 and MSS/MSI statuses (MSS-RNF43wild-type [n = 26], MSS-RNF43mutated [n = 11], MSI-RNF43mutated [n = 8]). C) Event-free survival of patients with RNF43mutated (n = 19) and RNF43wild-type (n = 26) tumors and D) combined RNF43 and MSS/MSI statuses (MSS-RNF43wild-type [n = 26], MSS-RNF43mutated [n = 11], MSI-RNF43mutated [n = 8]). Cox models were used to obtain hazard ratios with 95% CIs, and the two-sided log-rank test was used for statistical comparisons without adjustment for multiplicity. Colors indicate molecular subtypes: RNF43wild-type tumors with or without MSS (yellow), RNF43mutated tumors with or without MSS (blue) and MSI-RNF43mutated tumors (gray). Significant values are shown in bold. Abbreviations: CI, confidence interval; HR, hazard ratio.
Extended Data Fig. 7
Extended Data Fig. 7. Clinical characteristics and mutational profile of patients with mCRCBRAF-V600E treated with no anti-BRAF/EGFR combinatorial therapies.
A) Clinical and therapeutic characteristics of patients from the control cohort, patients receiving standard chemotherapy ± antiangiogenic agents (total N = 68). These patients received in total 135 chemotherapy regimens with/without anti-angiogenic drugs during first, second, or third lines. A total of 67 treatment lines (second and third line) in MSS patients were analyzed. BE) Comparison of RNF43 mutation frequencies and protein location between discovery/validation (B,D) and control (C,E) cohorts. RNF43 mutation frequencies of the mCRCBRAF-V600E MSS subgroup from discovery/validation (29%, 22/76) and control (22%, 15/68) cohorts were similar (B, C), respectively. Also, the MSS discovery/validation and control cohorts showed a similar RNF43 mutational profile regarding localization and predictive functional status (D, E). Abbreviations: MSS, microsatellite stable.
Extended Data Fig. 8
Extended Data Fig. 8. Analysis of the prognostic/predictive value of RNF43 mutations in the control cohort of patients with mCRCBRAF-V600E with MSS tumors treated with standard-of-care regimens only, with no exposure to anti-BRAF therapies.
A, B) Kaplan-Meier curves of PFS and OS from the control cohort treated in second or third line (n = 67) C, D) and in first line (n = 68) with standard-of-care regimens only, with no exposure to anti-BRAF therapies. Colors refer to molecular subtypes: RNF43wild-type (yellow), RNF43mutated tumors (blue)wild-type. Cox models were used to obtain hazard ratios with 95% CI, and the two-sided log-rank test was used for statistical comparisons without adjustment for multiplicity. Abbreviations: CI, confidence interval; HR, hazard ratio.
Extended Data Fig. 9
Extended Data Fig. 9. Mutation frequencies of RNF43 and APC genes in MSS status and immunohistochemical analysis against human β-catenin of mCRCBRAF-V600E tumor samples.
A, B) Mutation frequencies of RNF43 and APC genes, and response status from patients with mCRCBRAF-V600E with MSS tumors from the discovery (A) and validation (B) cohorts. Chi-square test was used for the statistical analysis. Abbreviations: CR, complete response; MSS, microsatellite stable; PD, progressive disease; PR, partial response; SD, stable disease. C–D) Immunohistochemical analysis against human β-catenin was performed in MSS-RNF43wild-type, MSS-RNF43mutated, and MSI-RNF43mutated mCRCBRAF-V600E tumor samples (n = 33) to search for potential differential pattern in total expression or cellular localization of β-catenin protein. No correlation was found between β-catenin protein expression levels (0, no staining; 1, weak; 2, moderate; and 3, strong) and cellular localization (cytoplasm, membrane, nucleus) with response to anti-BRAF/EGFR ± combinatorial therapies. Representative immunohistochemistry for β-catenin with strong membrane positivity, weak-moderate cytoplasmic positivity, and few weak nucleus positivity (magnification 40x) (C) and strong-moderate nuclear and cytoplasmic positivity (D) (magnification 40x).

References

    1. Di Nicolantonio F, et al. Precision oncology in metastatic colorectal cancer—from biology to medicine. Nat. Rev. Clin. Oncol. 2021;18:506–525. doi: 10.1038/s41571-021-00495-z. - DOI - PubMed
    1. Morris V, et al. Progression-free survival remains poor over sequential lines of systemic therapy in patients with BRAF-mutated colorectal cancer. Clin. Colorectal Cancer. 2014;13:164–171. doi: 10.1016/j.clcc.2014.06.001. - DOI - PMC - PubMed
    1. Cremolini C, et al. FOLFOXIRI plus bevacizumab versus FOLFIRI plus bevacizumab as first-line treatment of patients with metastatic colorectal cancer: updated overall survival and molecular subgroup analyses of the open-label, phase 3 TRIBE study. Lancet Oncol. 2015;16:1306–1315. doi: 10.1016/S1470-2045(15)00122-9. - DOI - PubMed
    1. Yaeger R, et al. Clinical sequencing defines the genomic landscape of metastatic colorectal cancer. Cancer Cell. 2018;33:125–136. doi: 10.1016/j.ccell.2017.12.004. - DOI - PMC - PubMed
    1. Hoadley KA, et al. Cell-of-origin patterns dominate the molecular classification of 10,000 tumors from 33 types of cancer. Cell. 2018;173:291–304. doi: 10.1016/j.cell.2018.03.022. - DOI - PMC - PubMed

Publication types

MeSH terms