. 2022 Sep;28(9):1848-1859.
doi: 10.1038/s41591-022-01959-0. Epub 2022 Sep 12.

Distinct cellular dynamics associated with response to CAR-T therapy for refractory B cell lymphoma

Affiliations

Distinct cellular dynamics associated with response to CAR-T therapy for refractory B cell lymphoma

Nicholas J Haradhvala et al. Nat Med. 2022 Sep.

Abstract

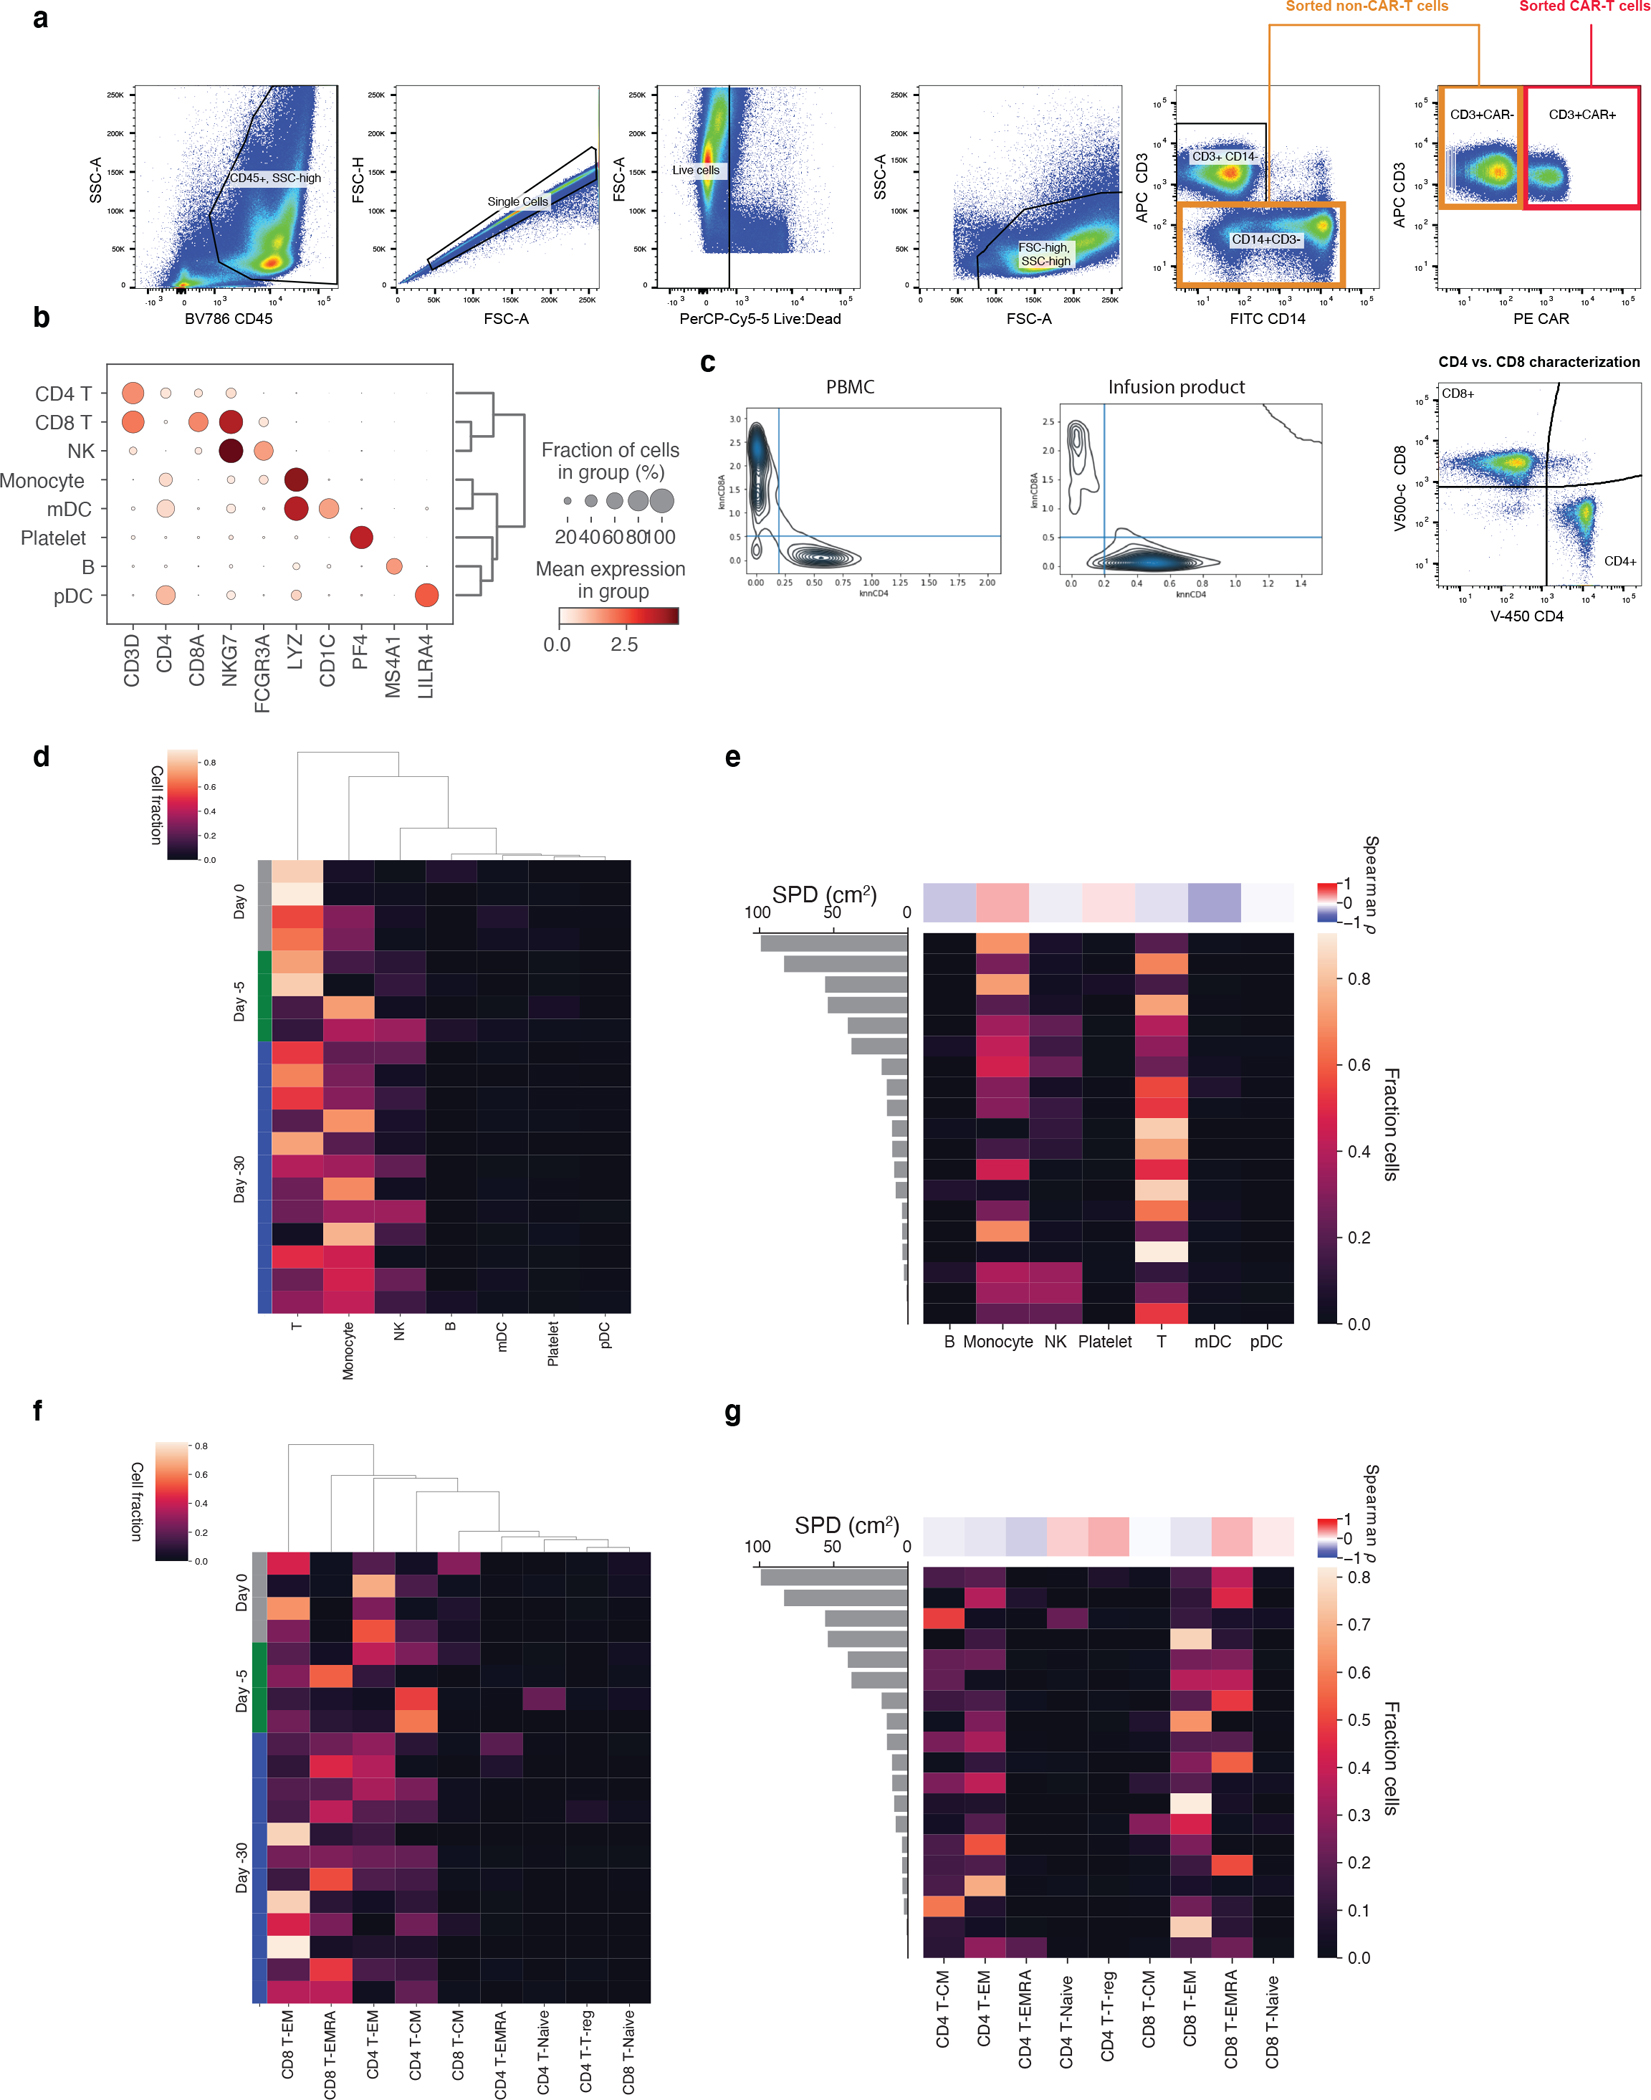
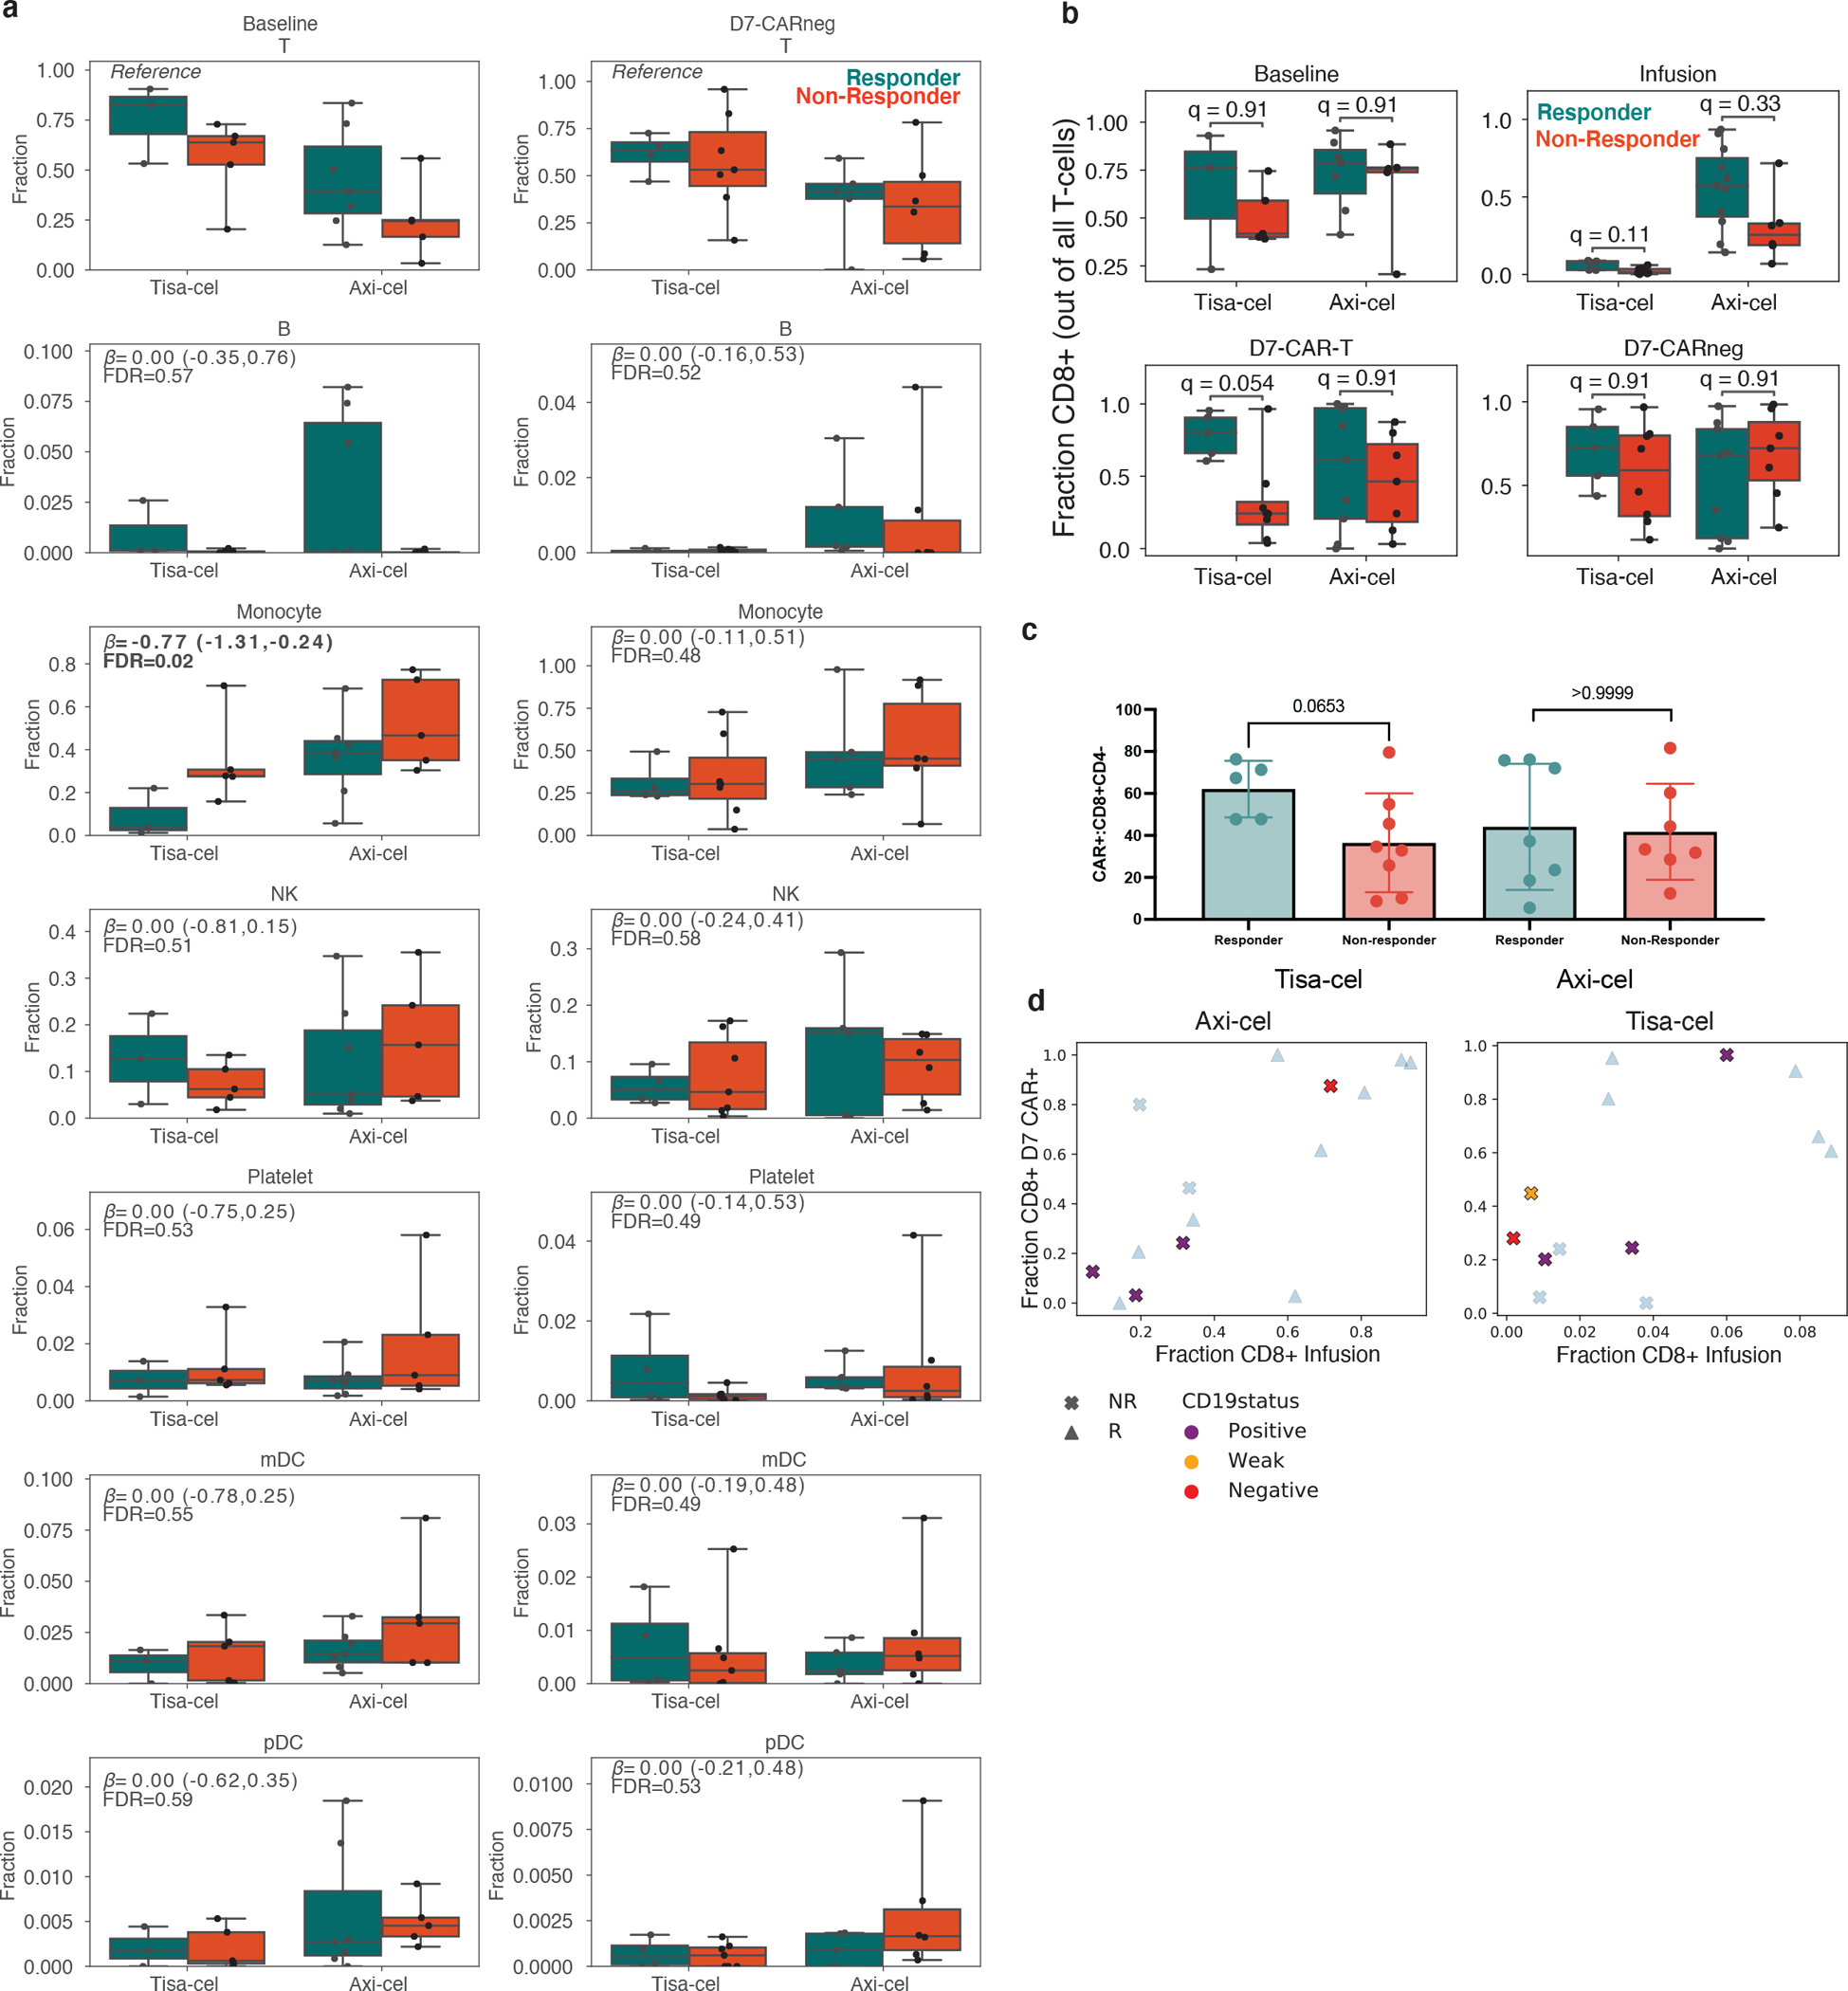
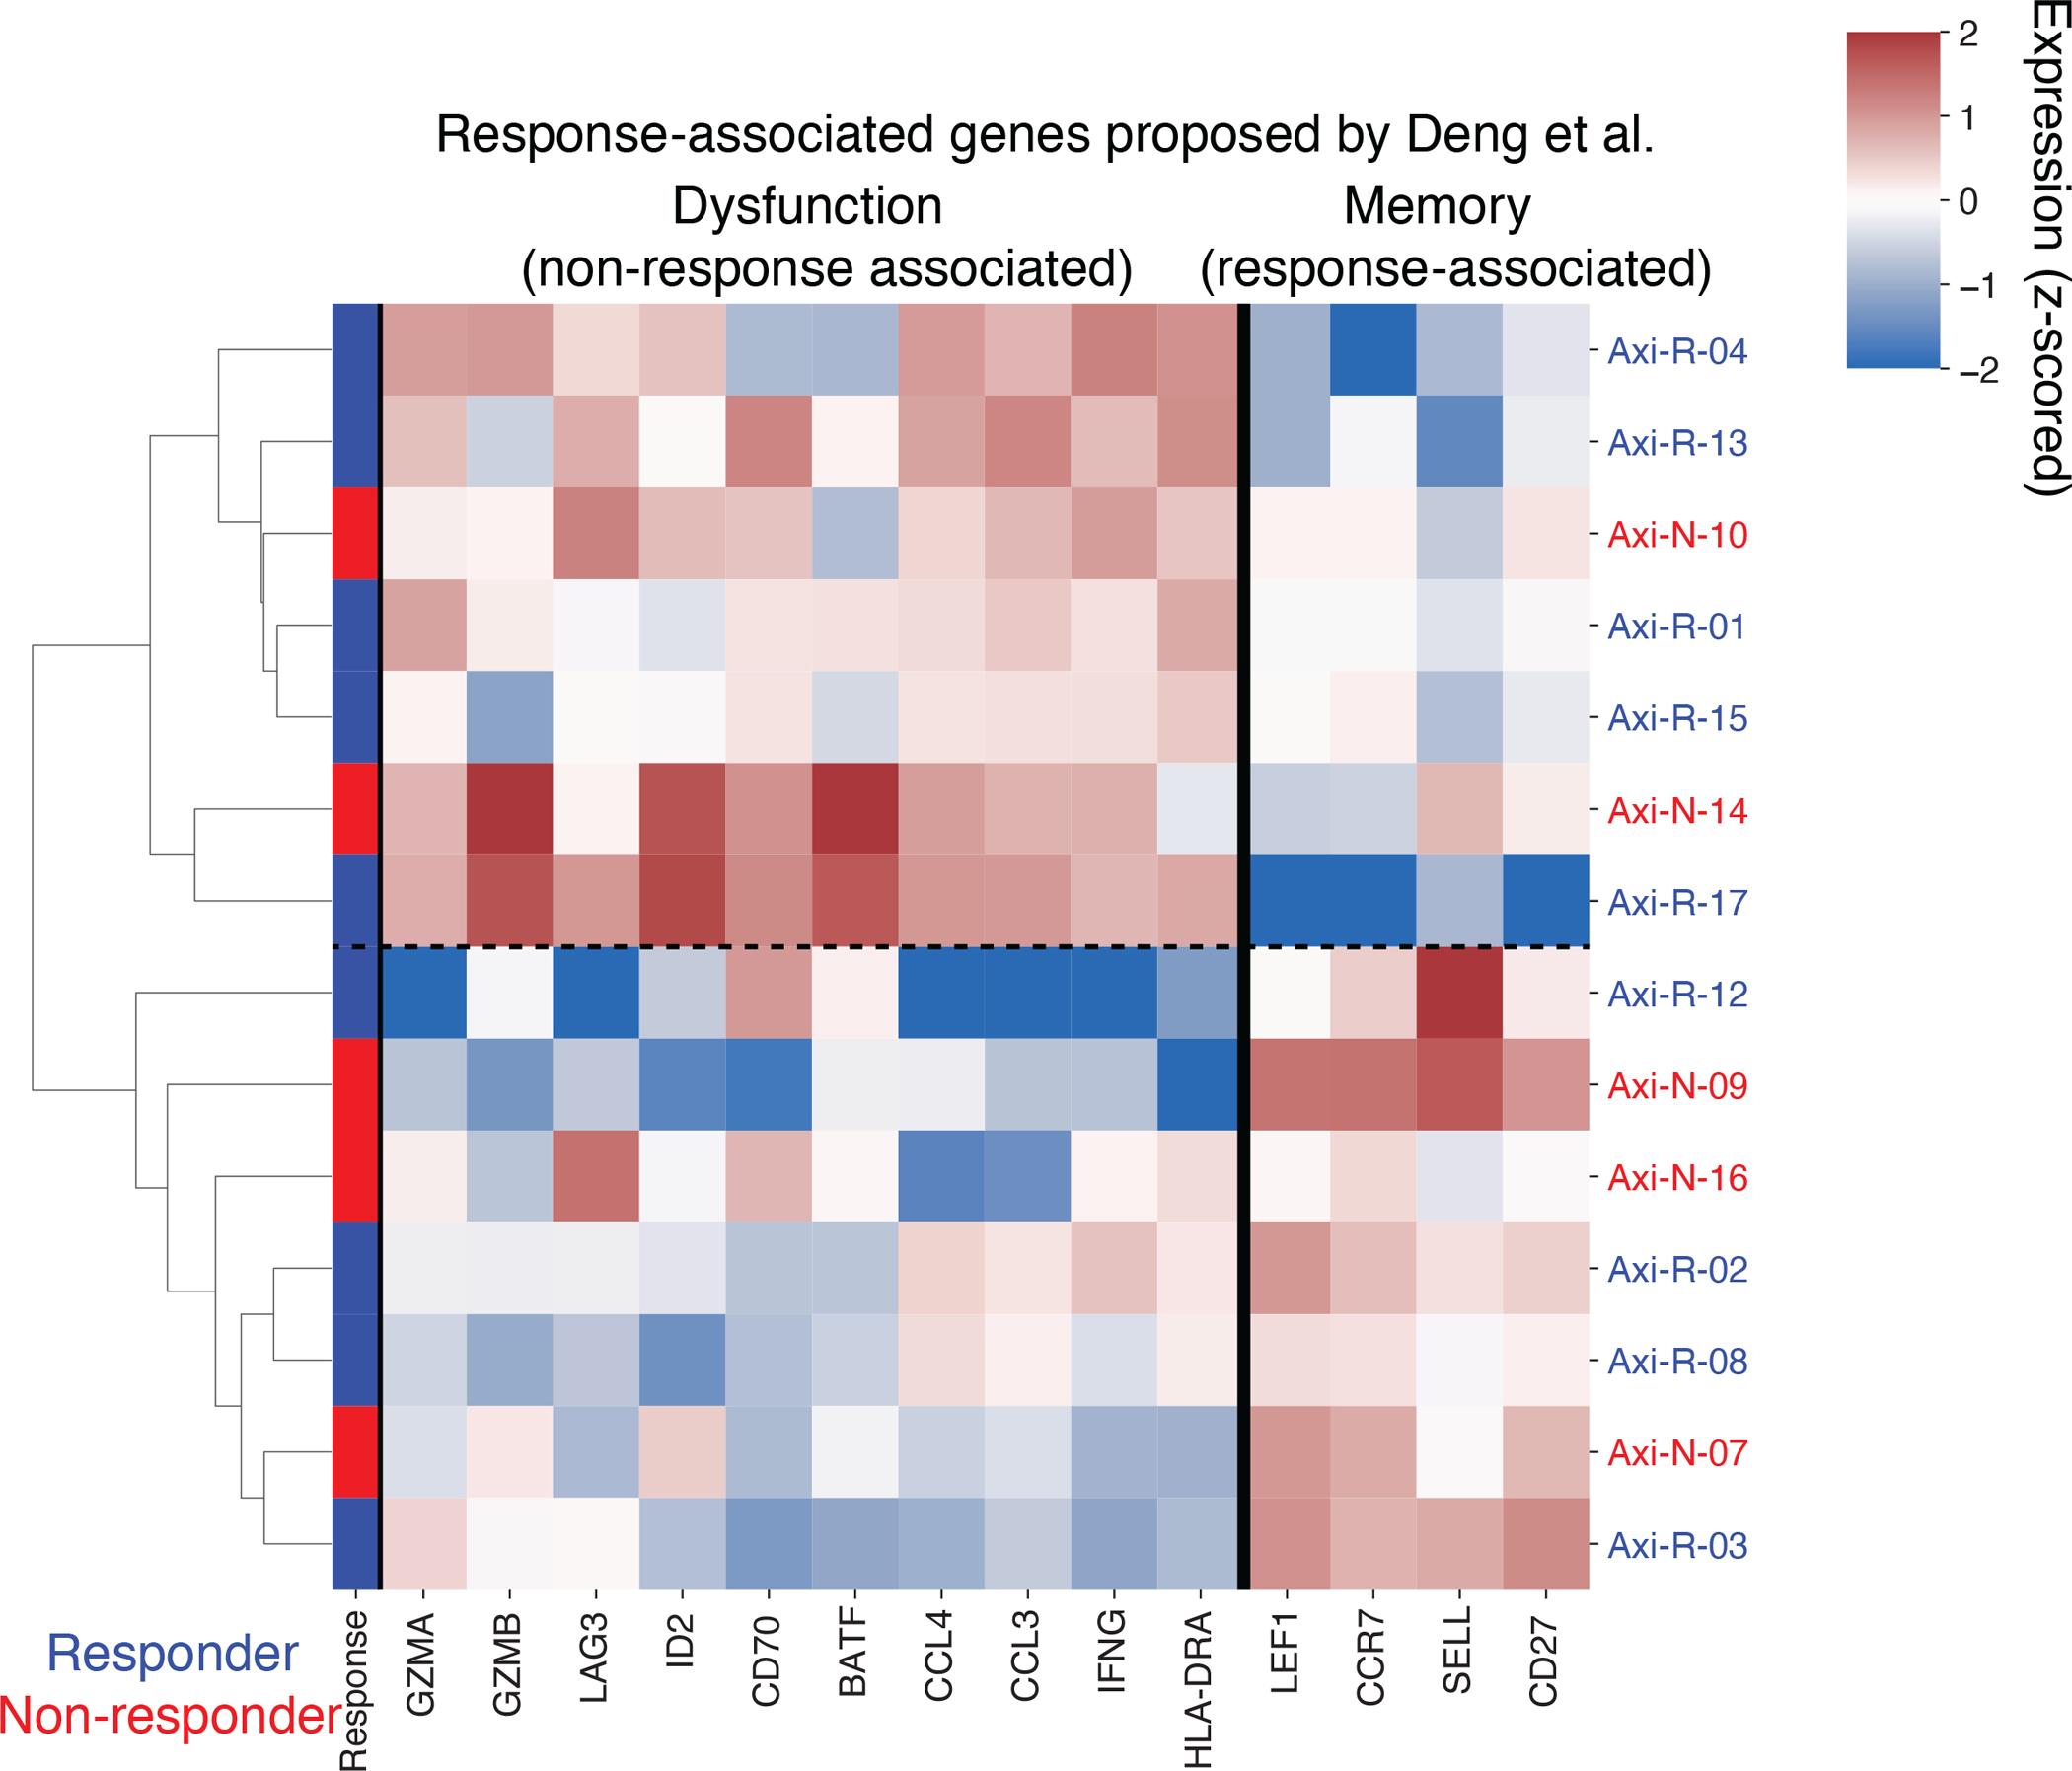
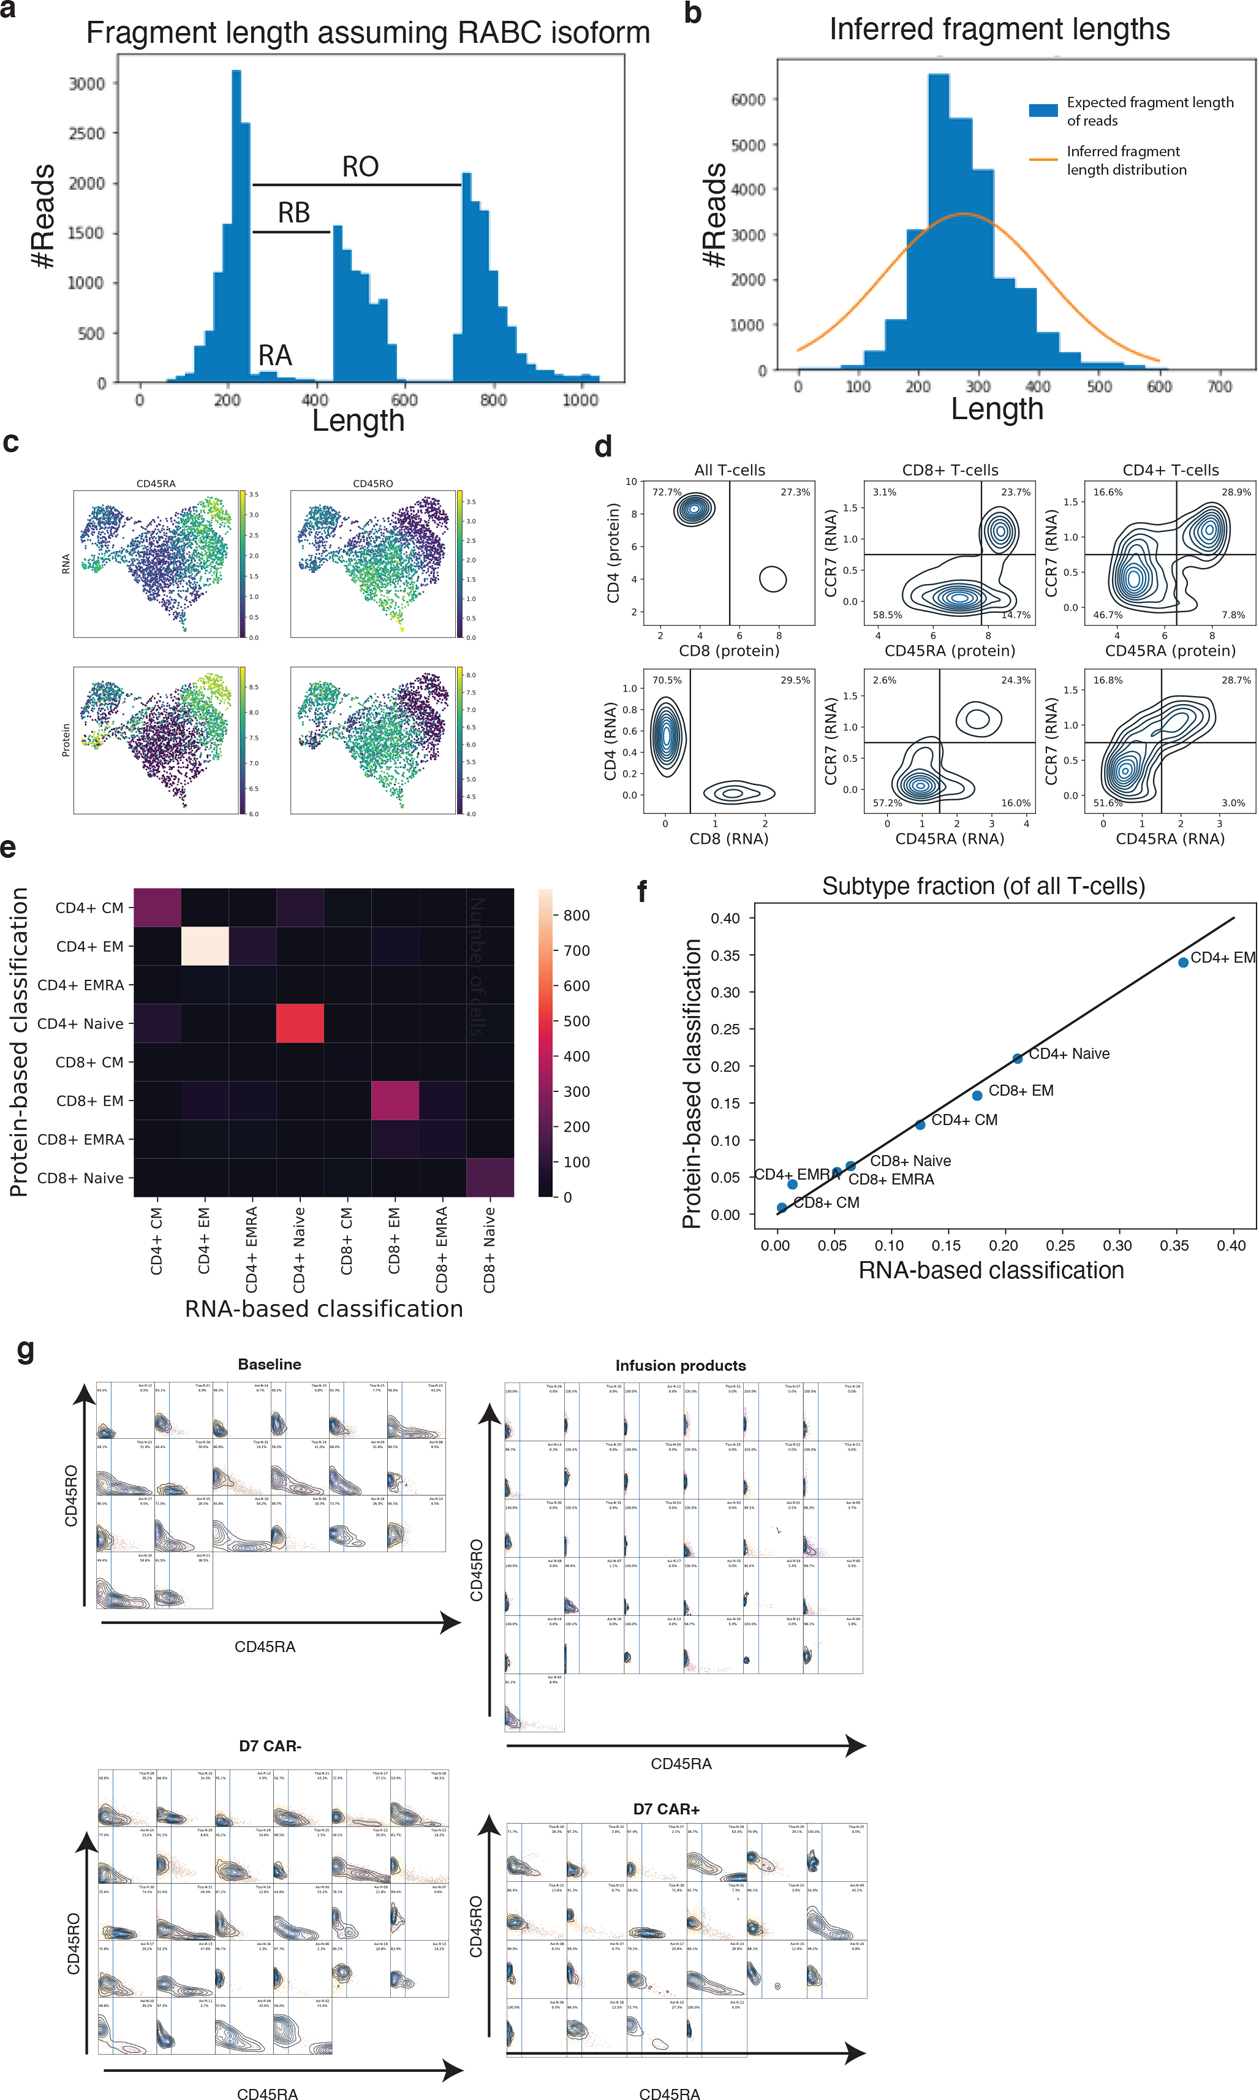
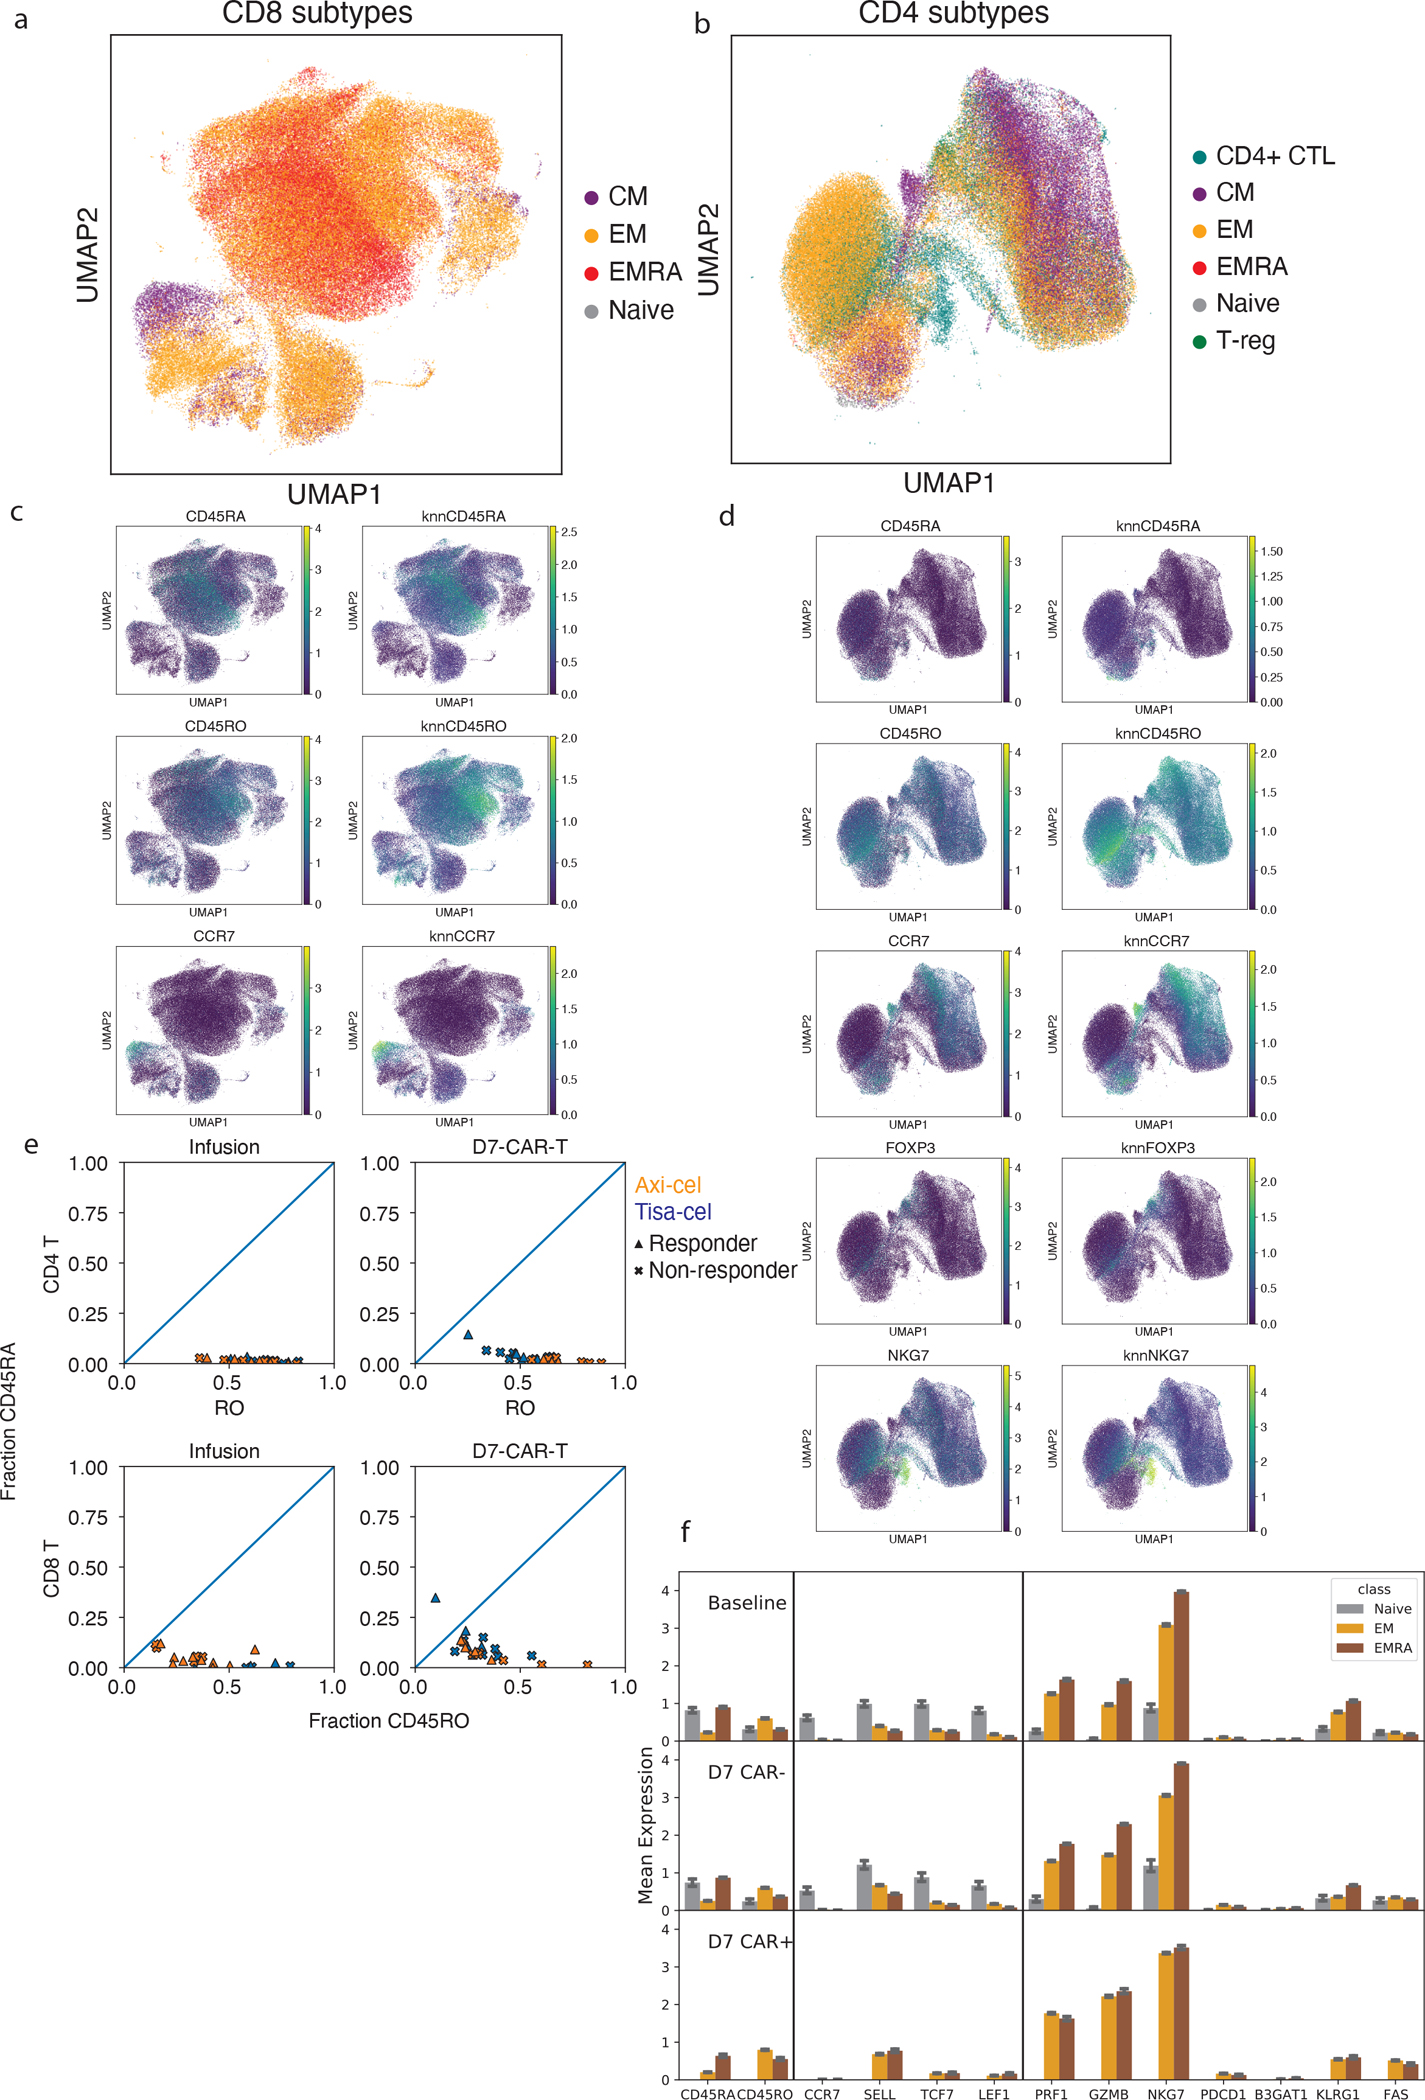
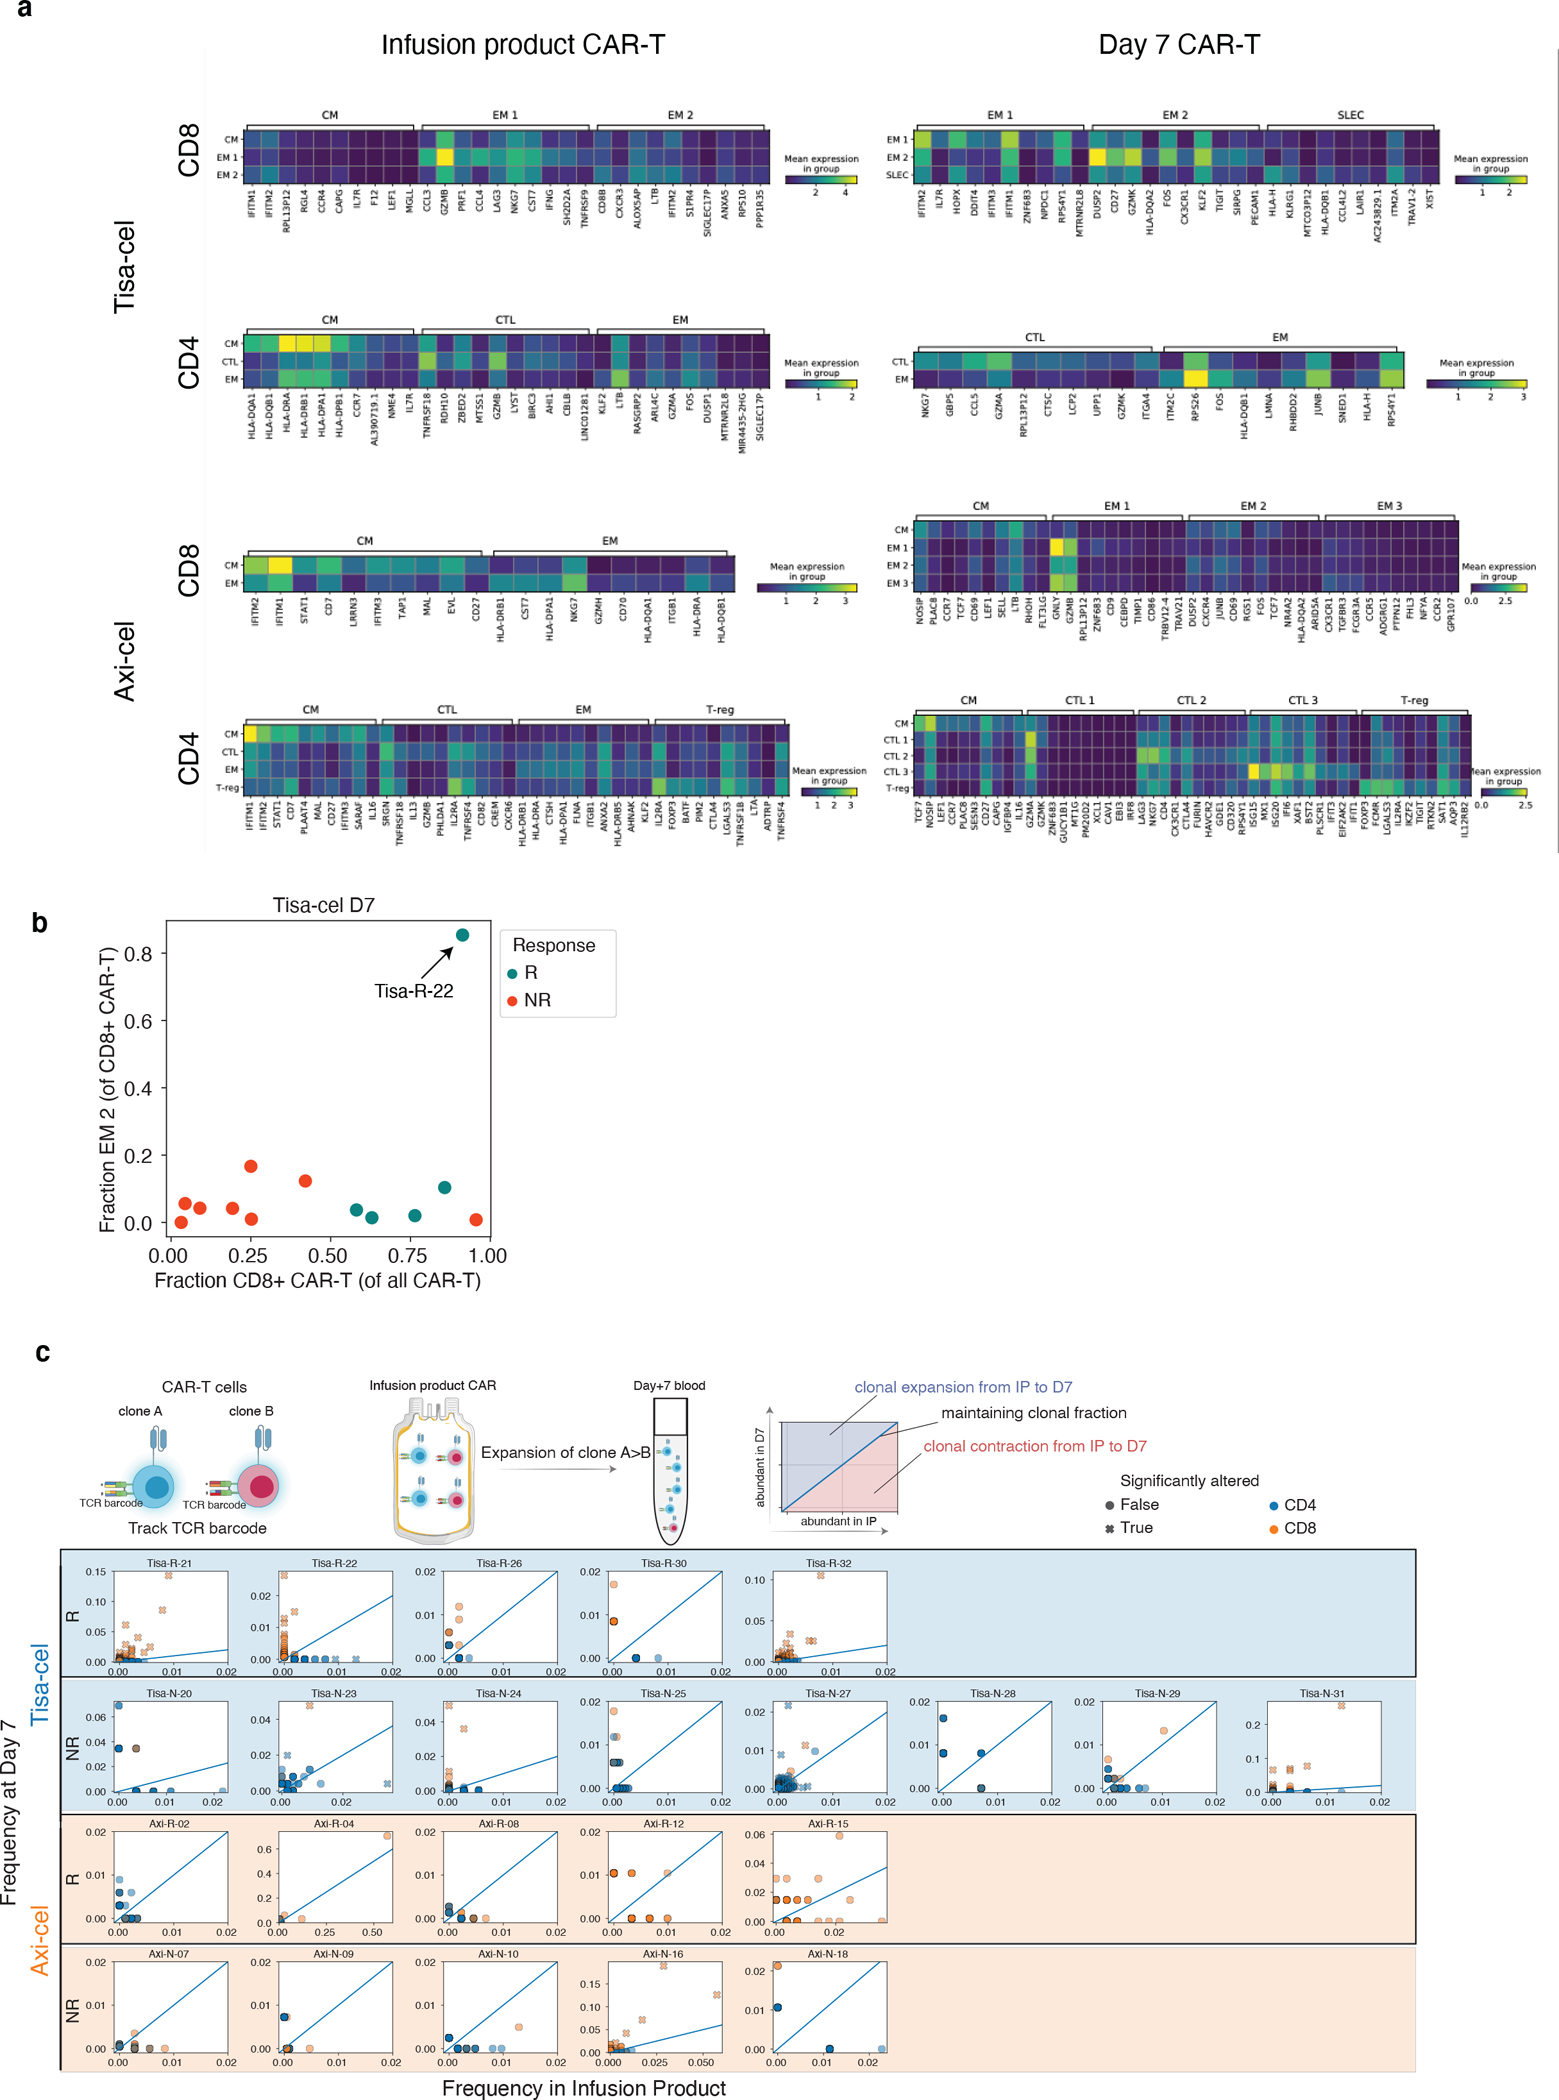
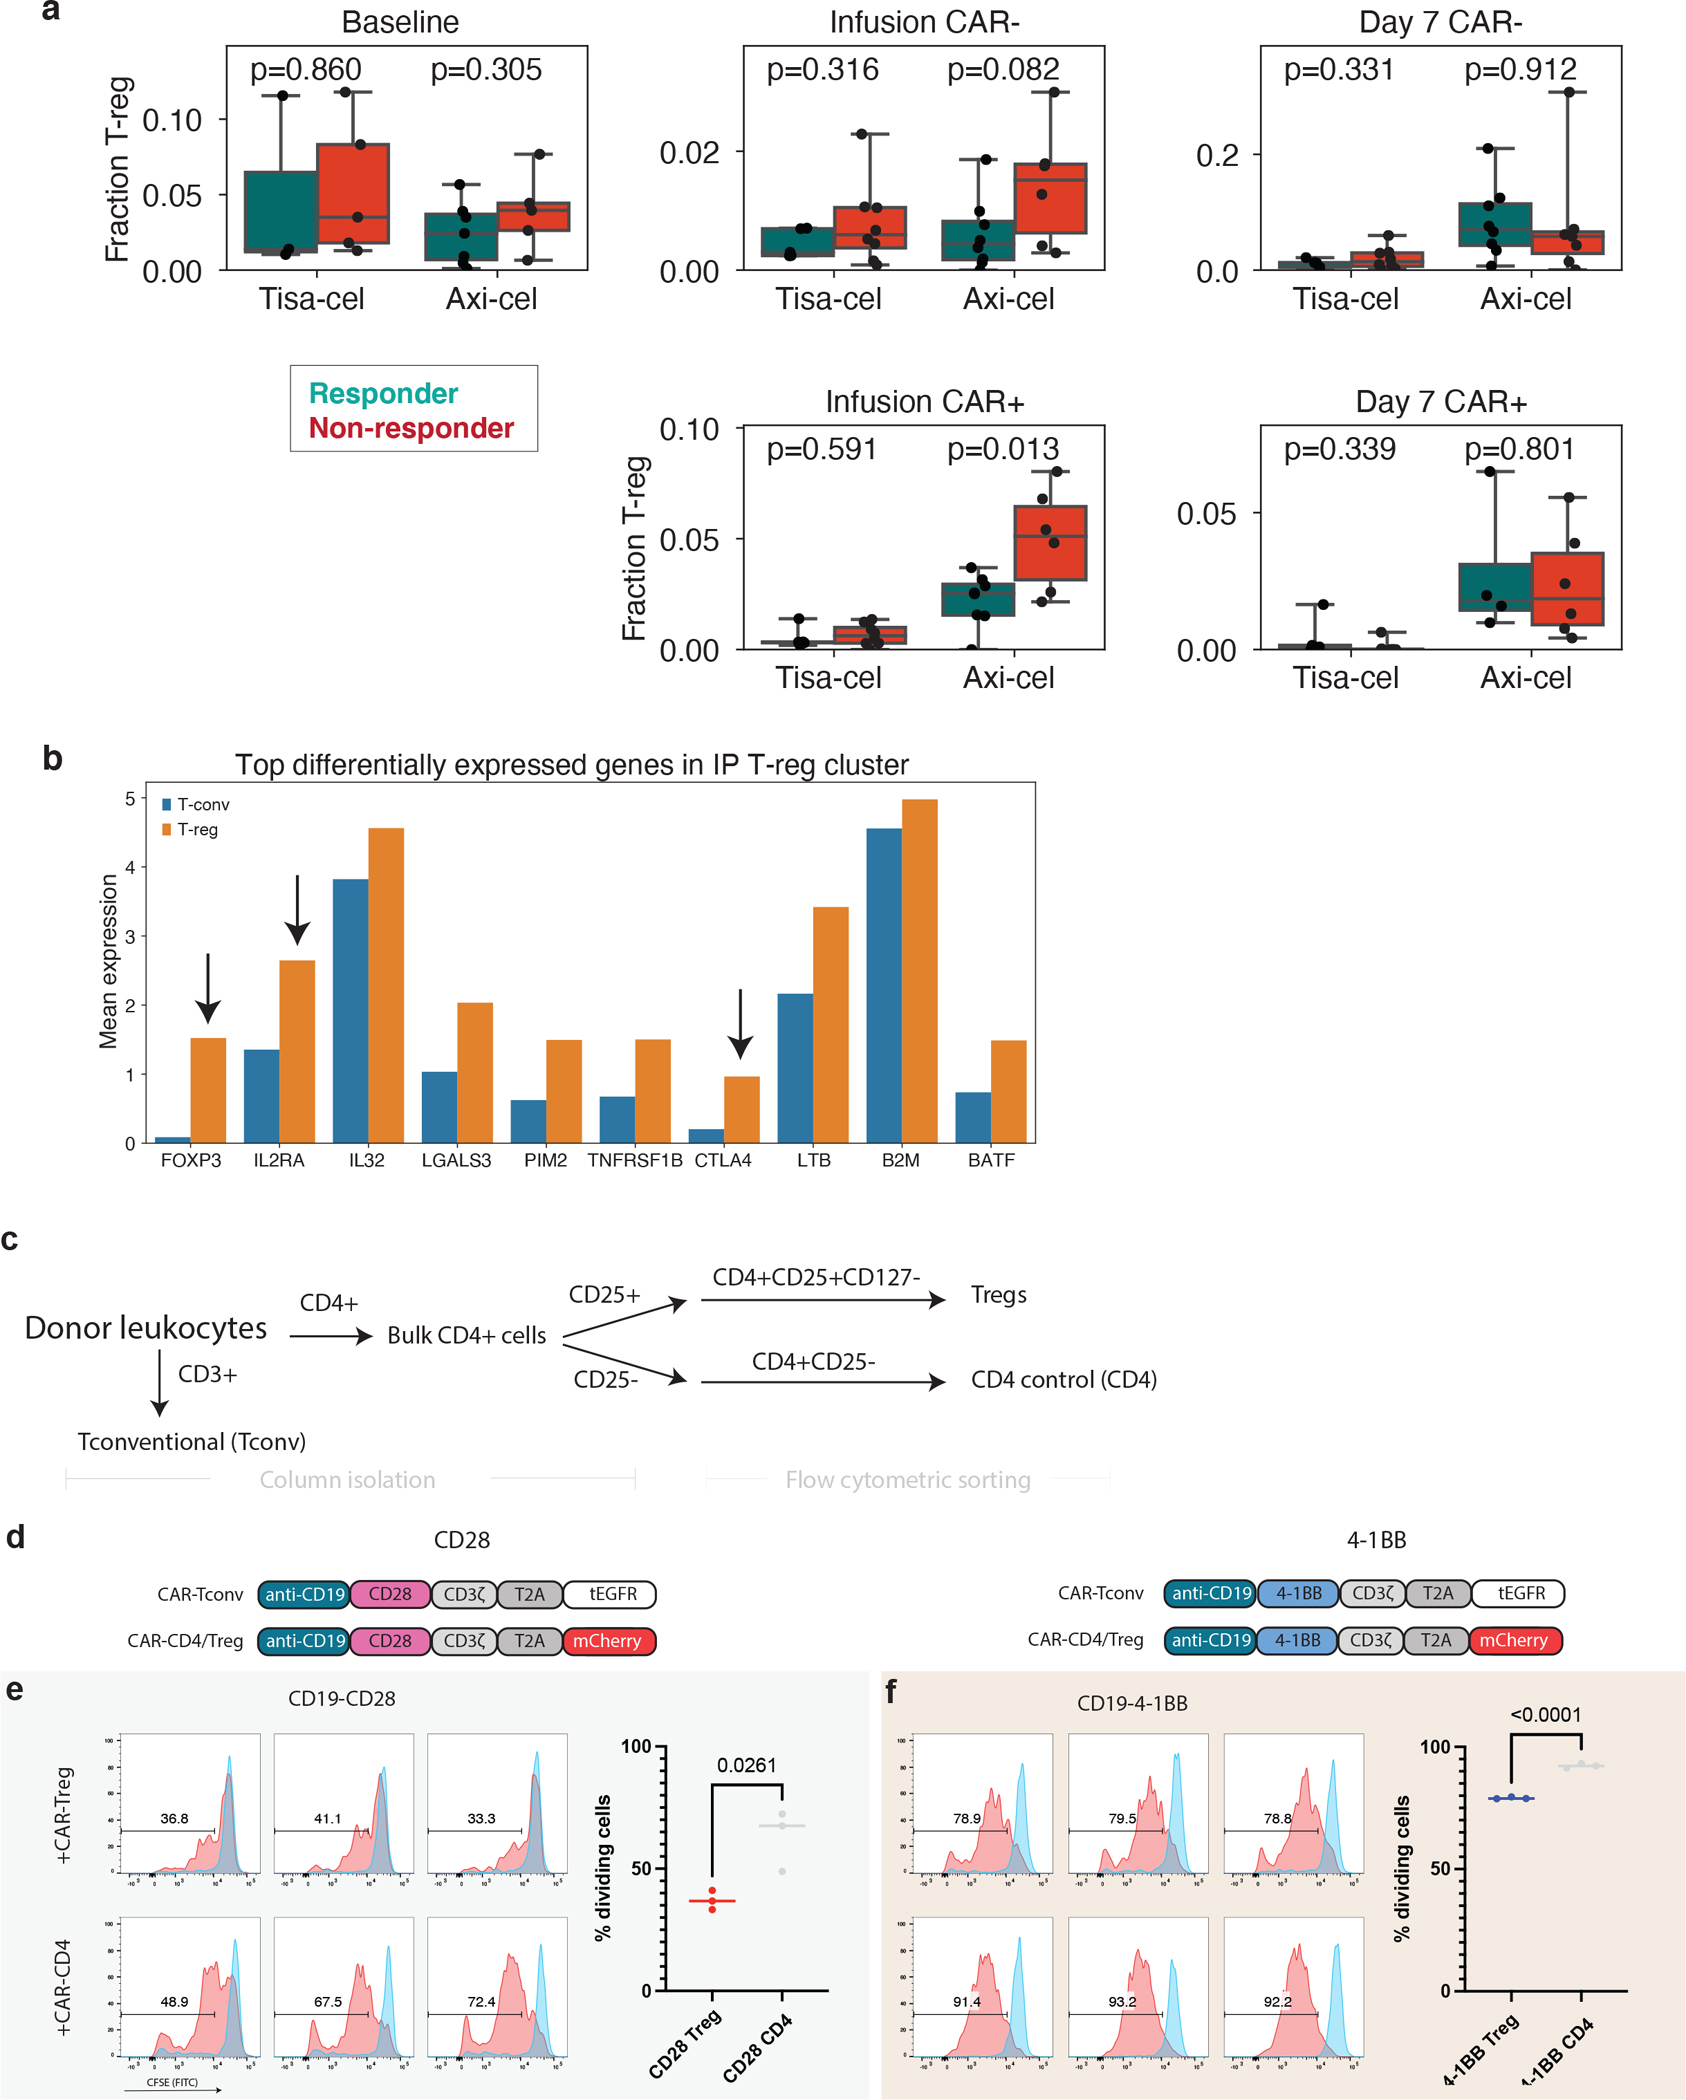
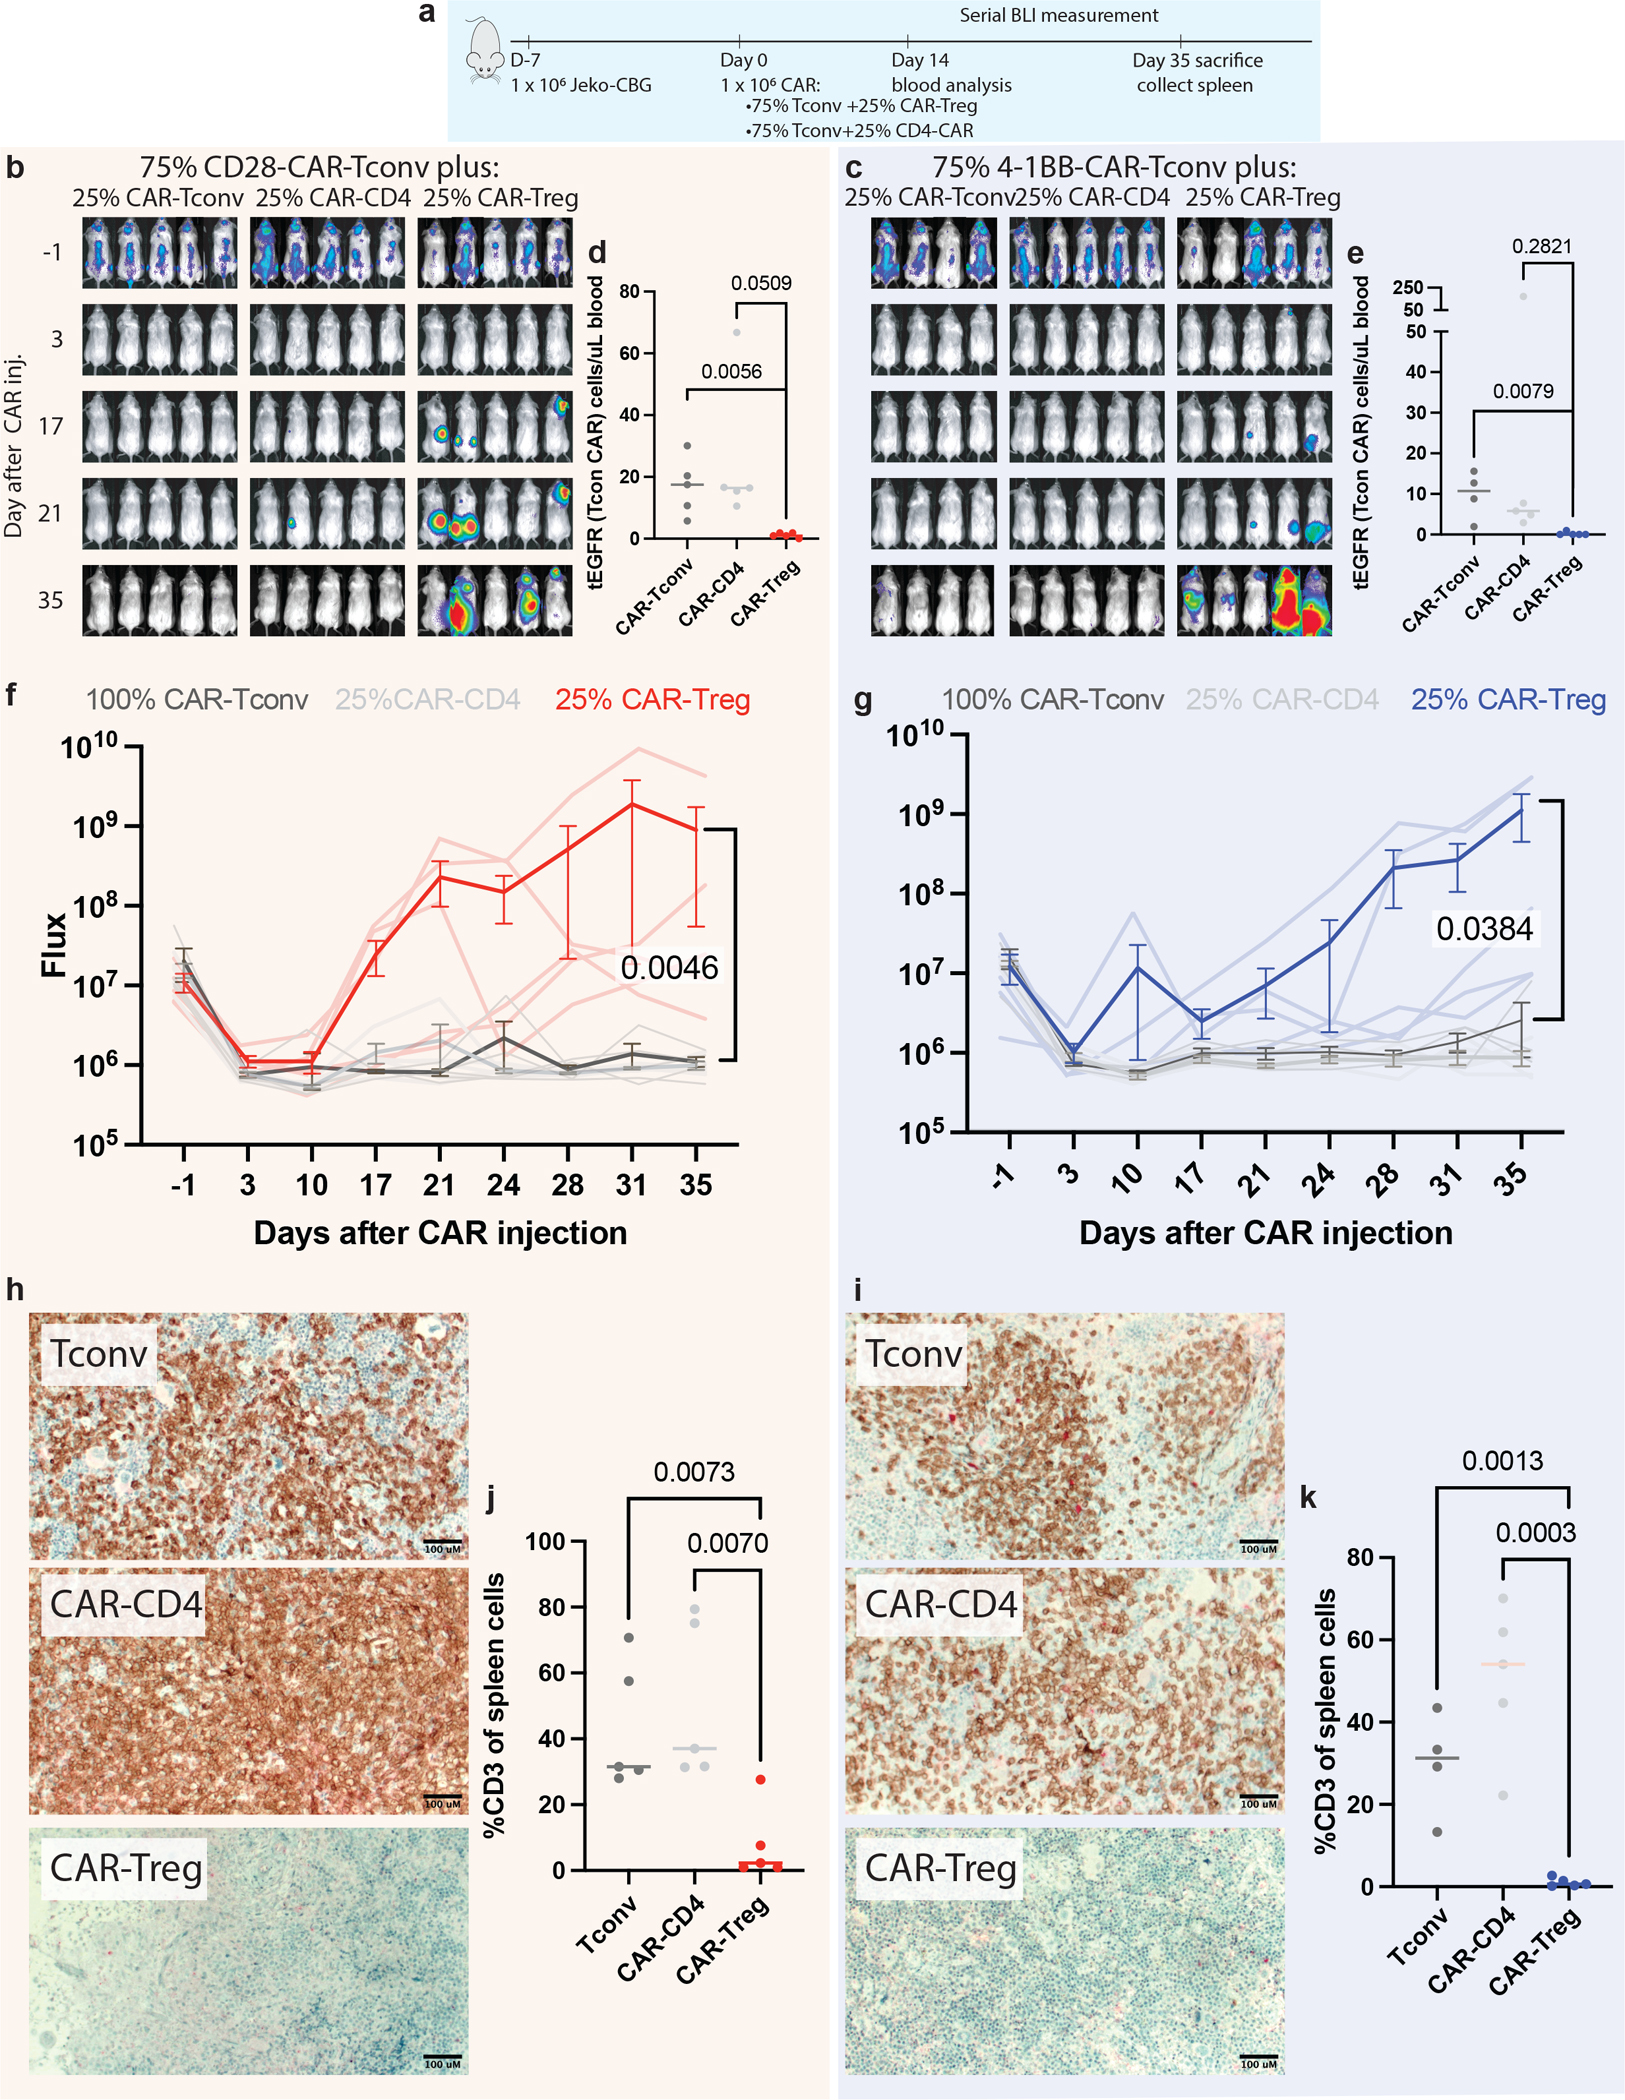
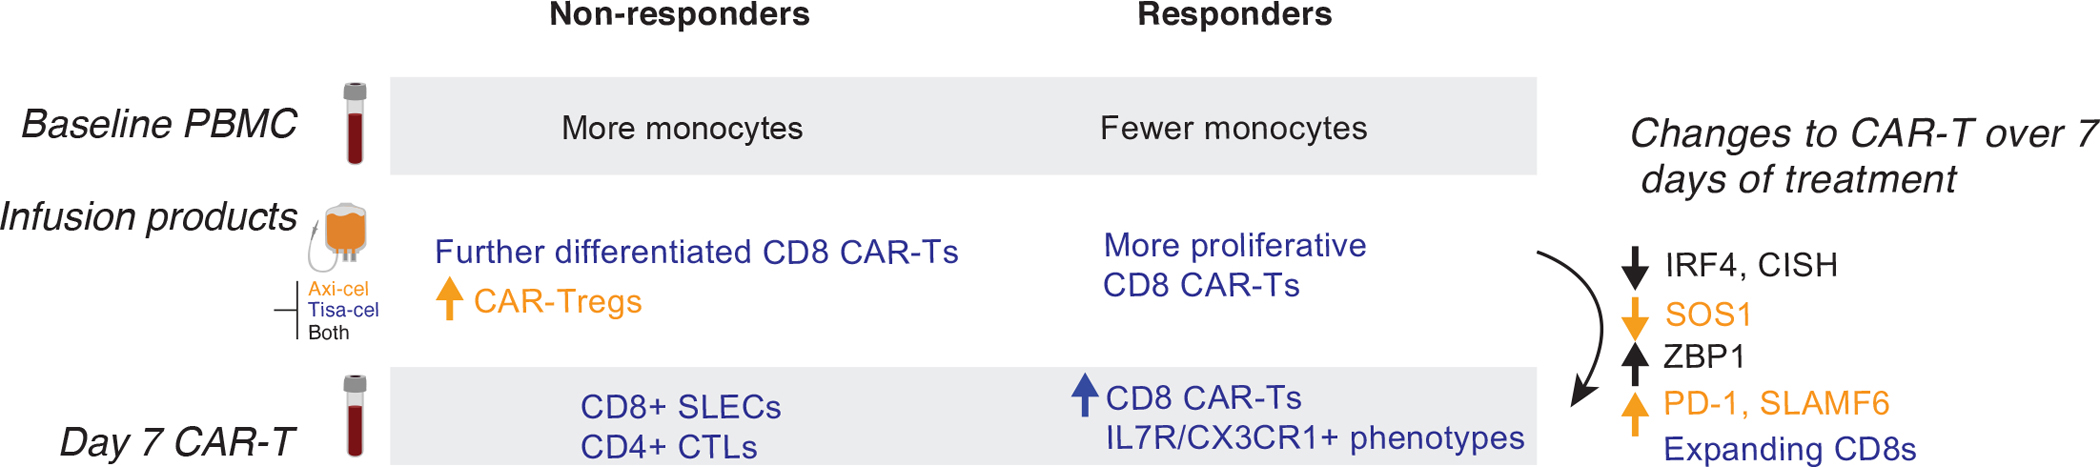
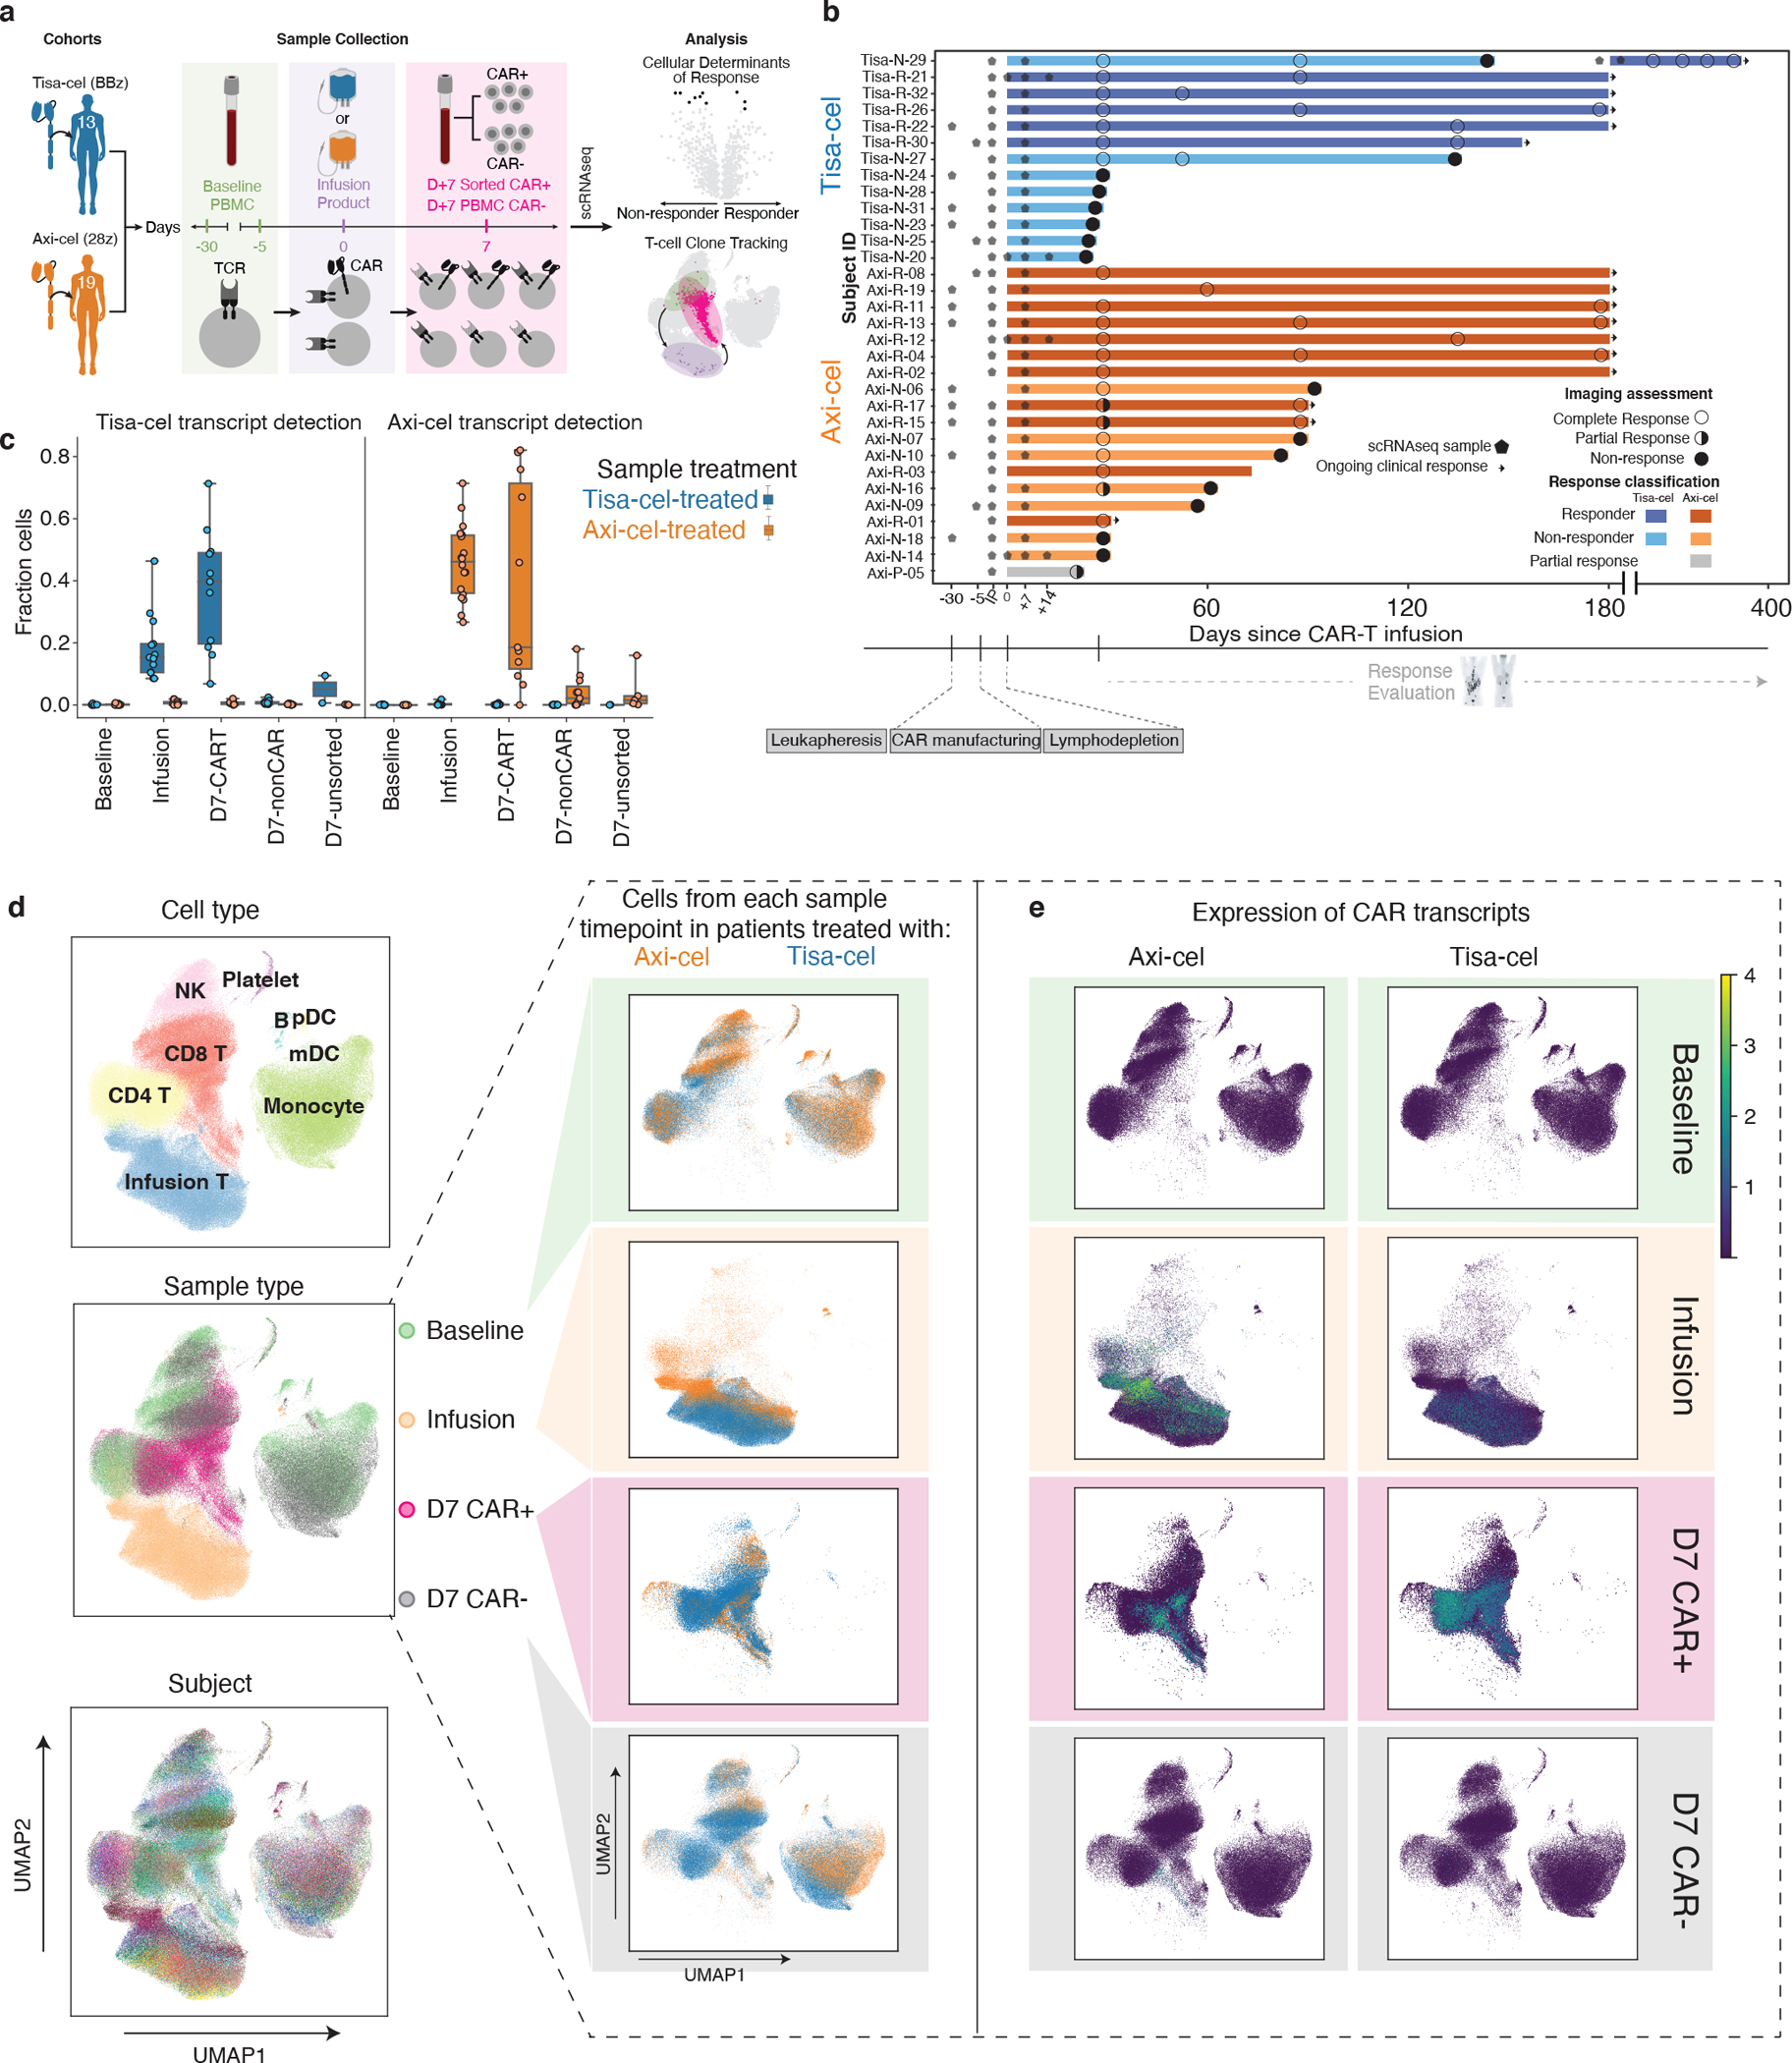
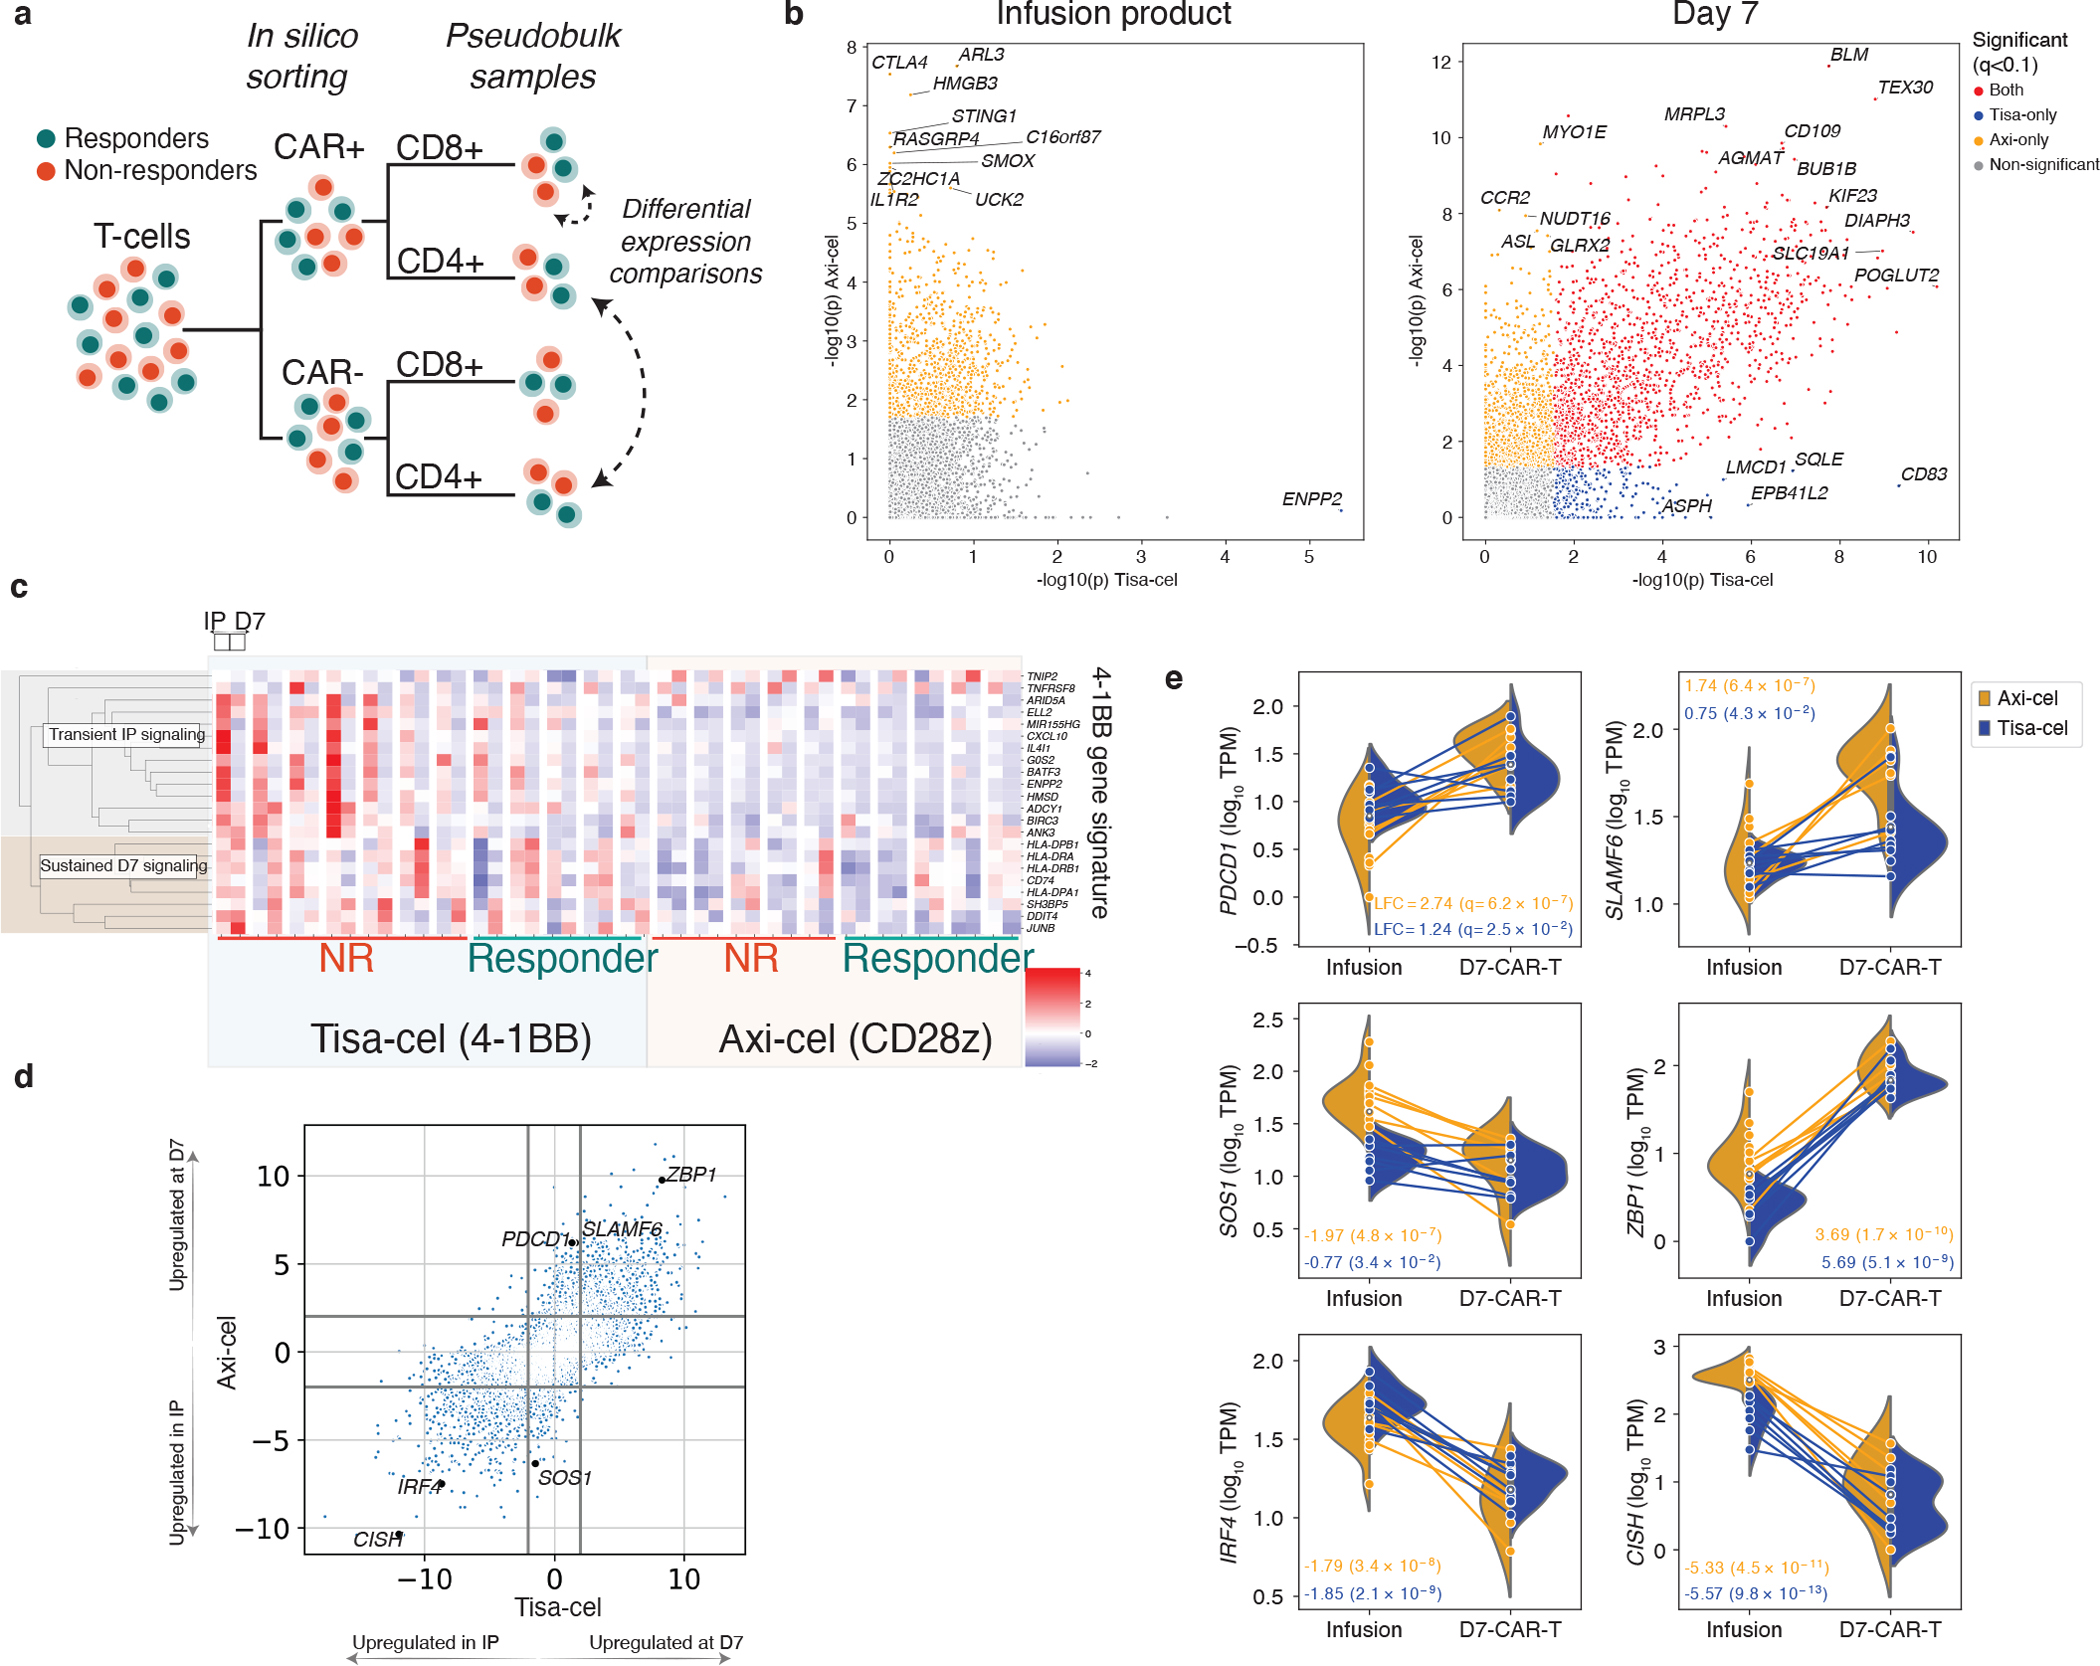
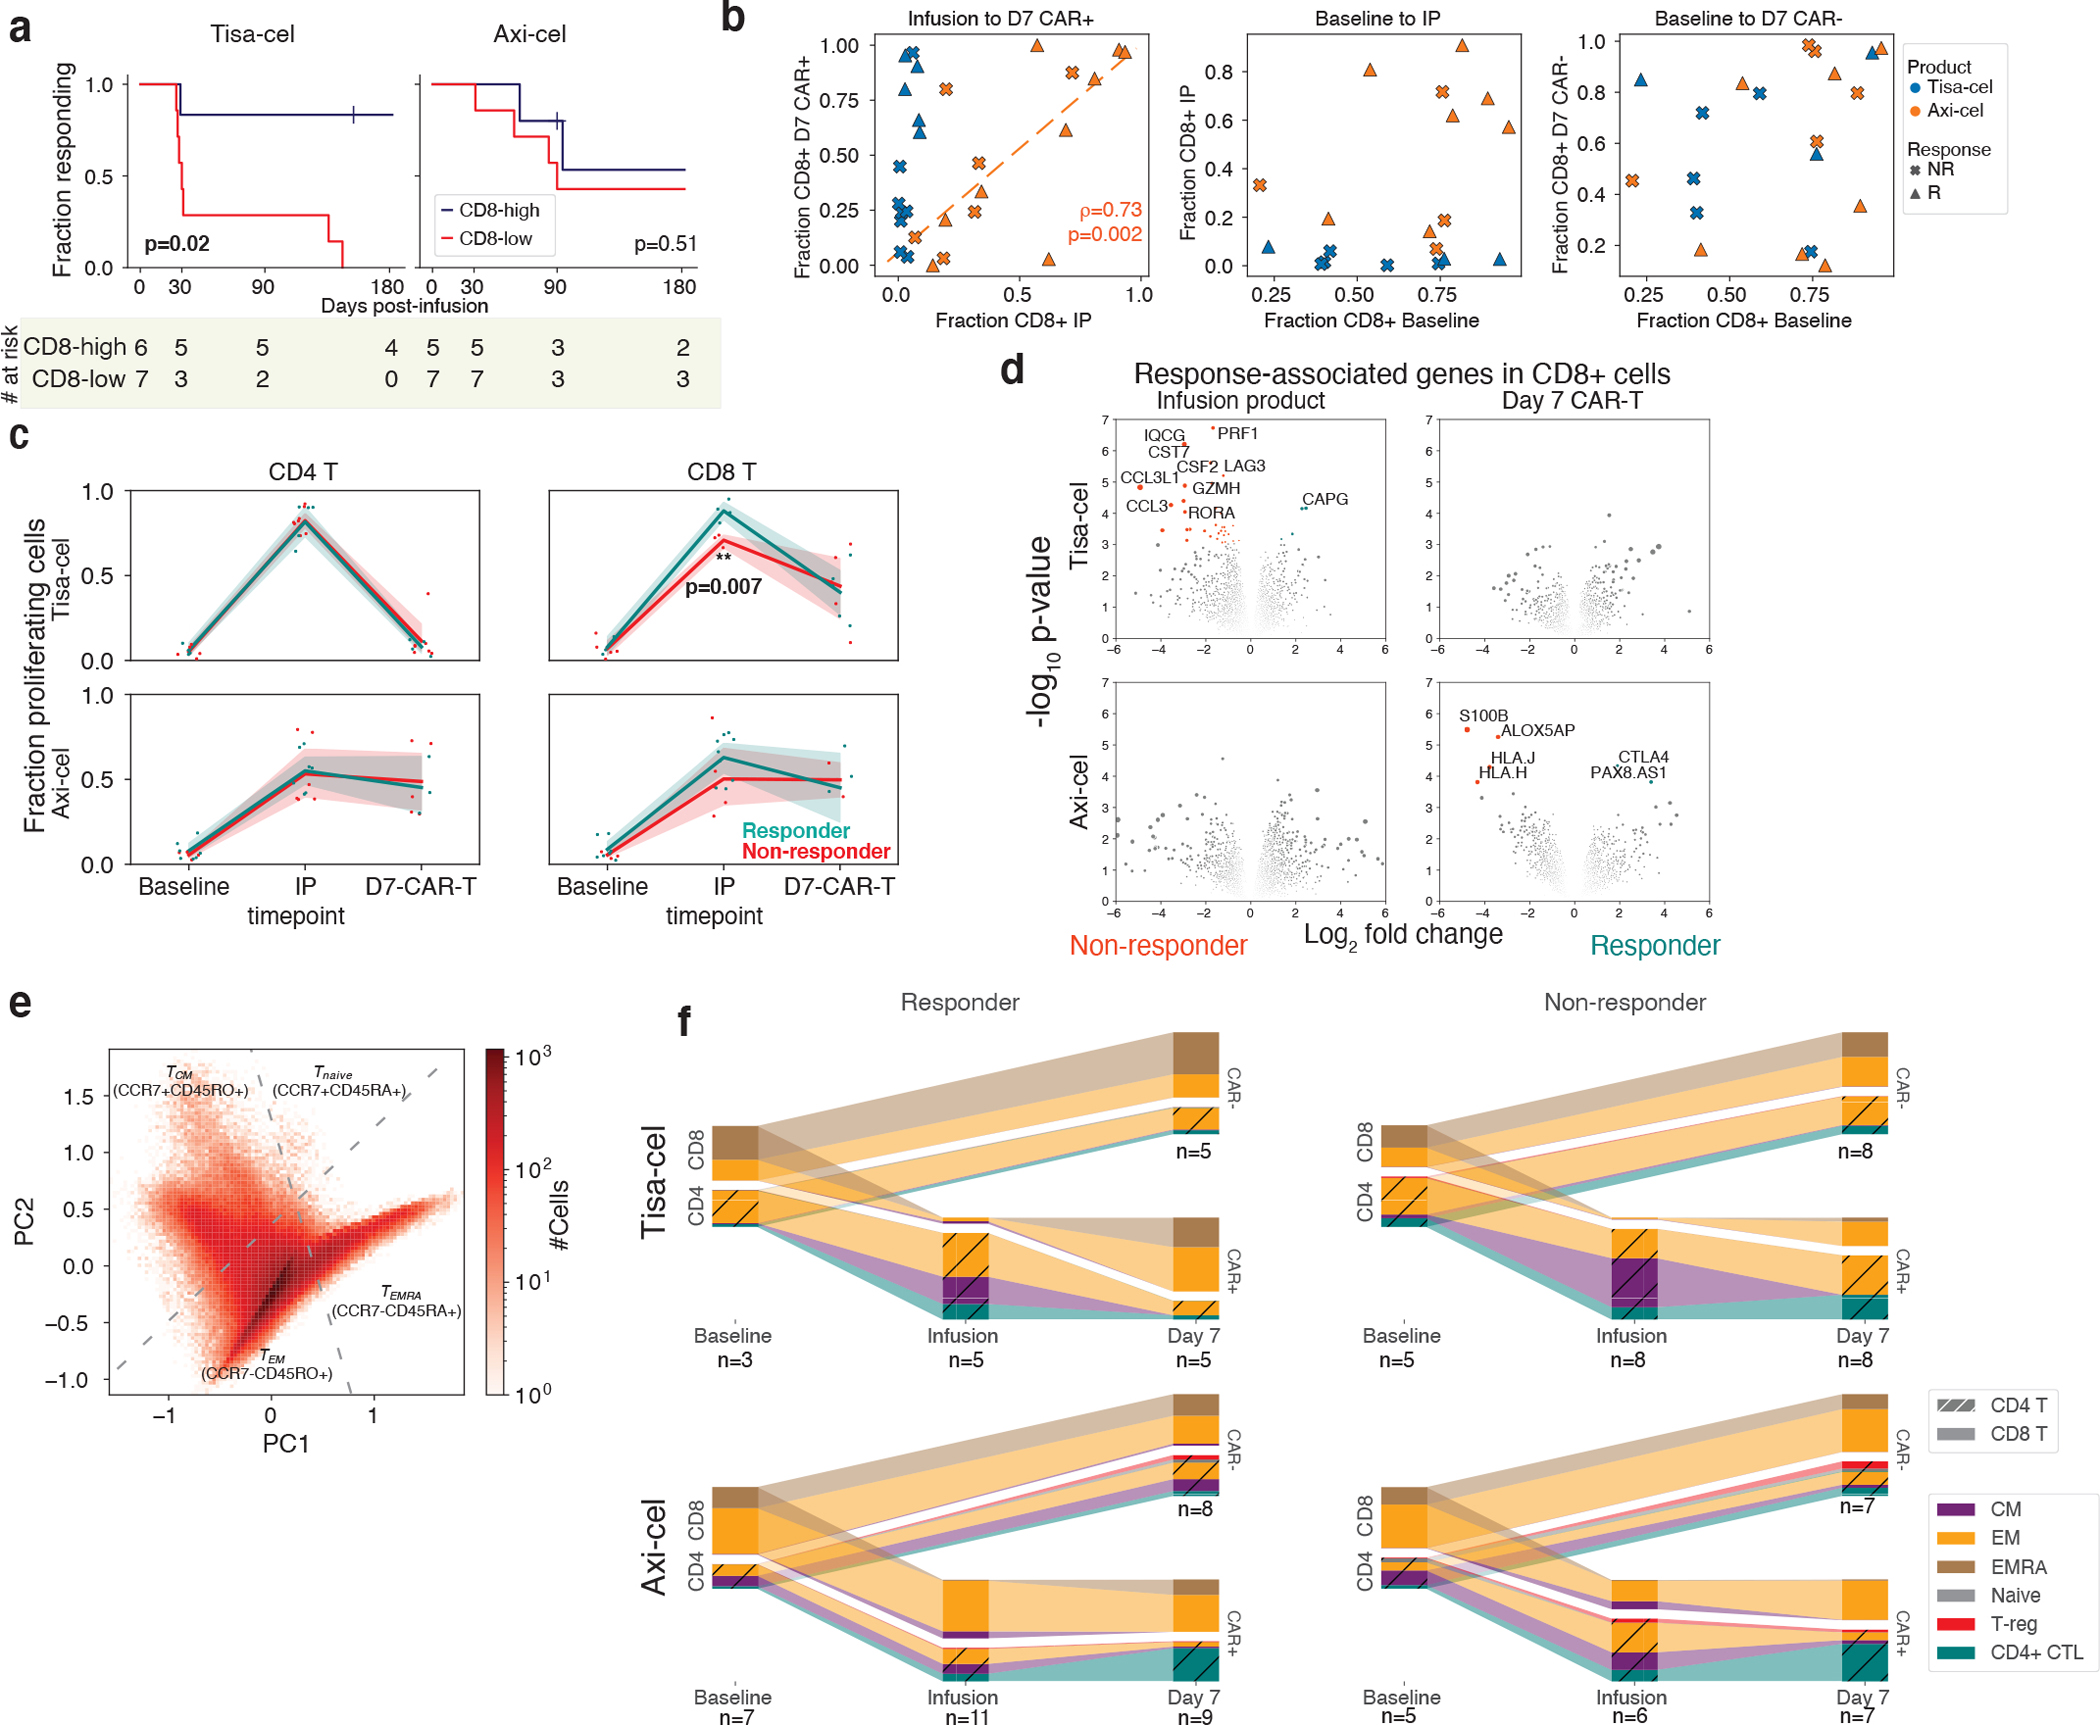
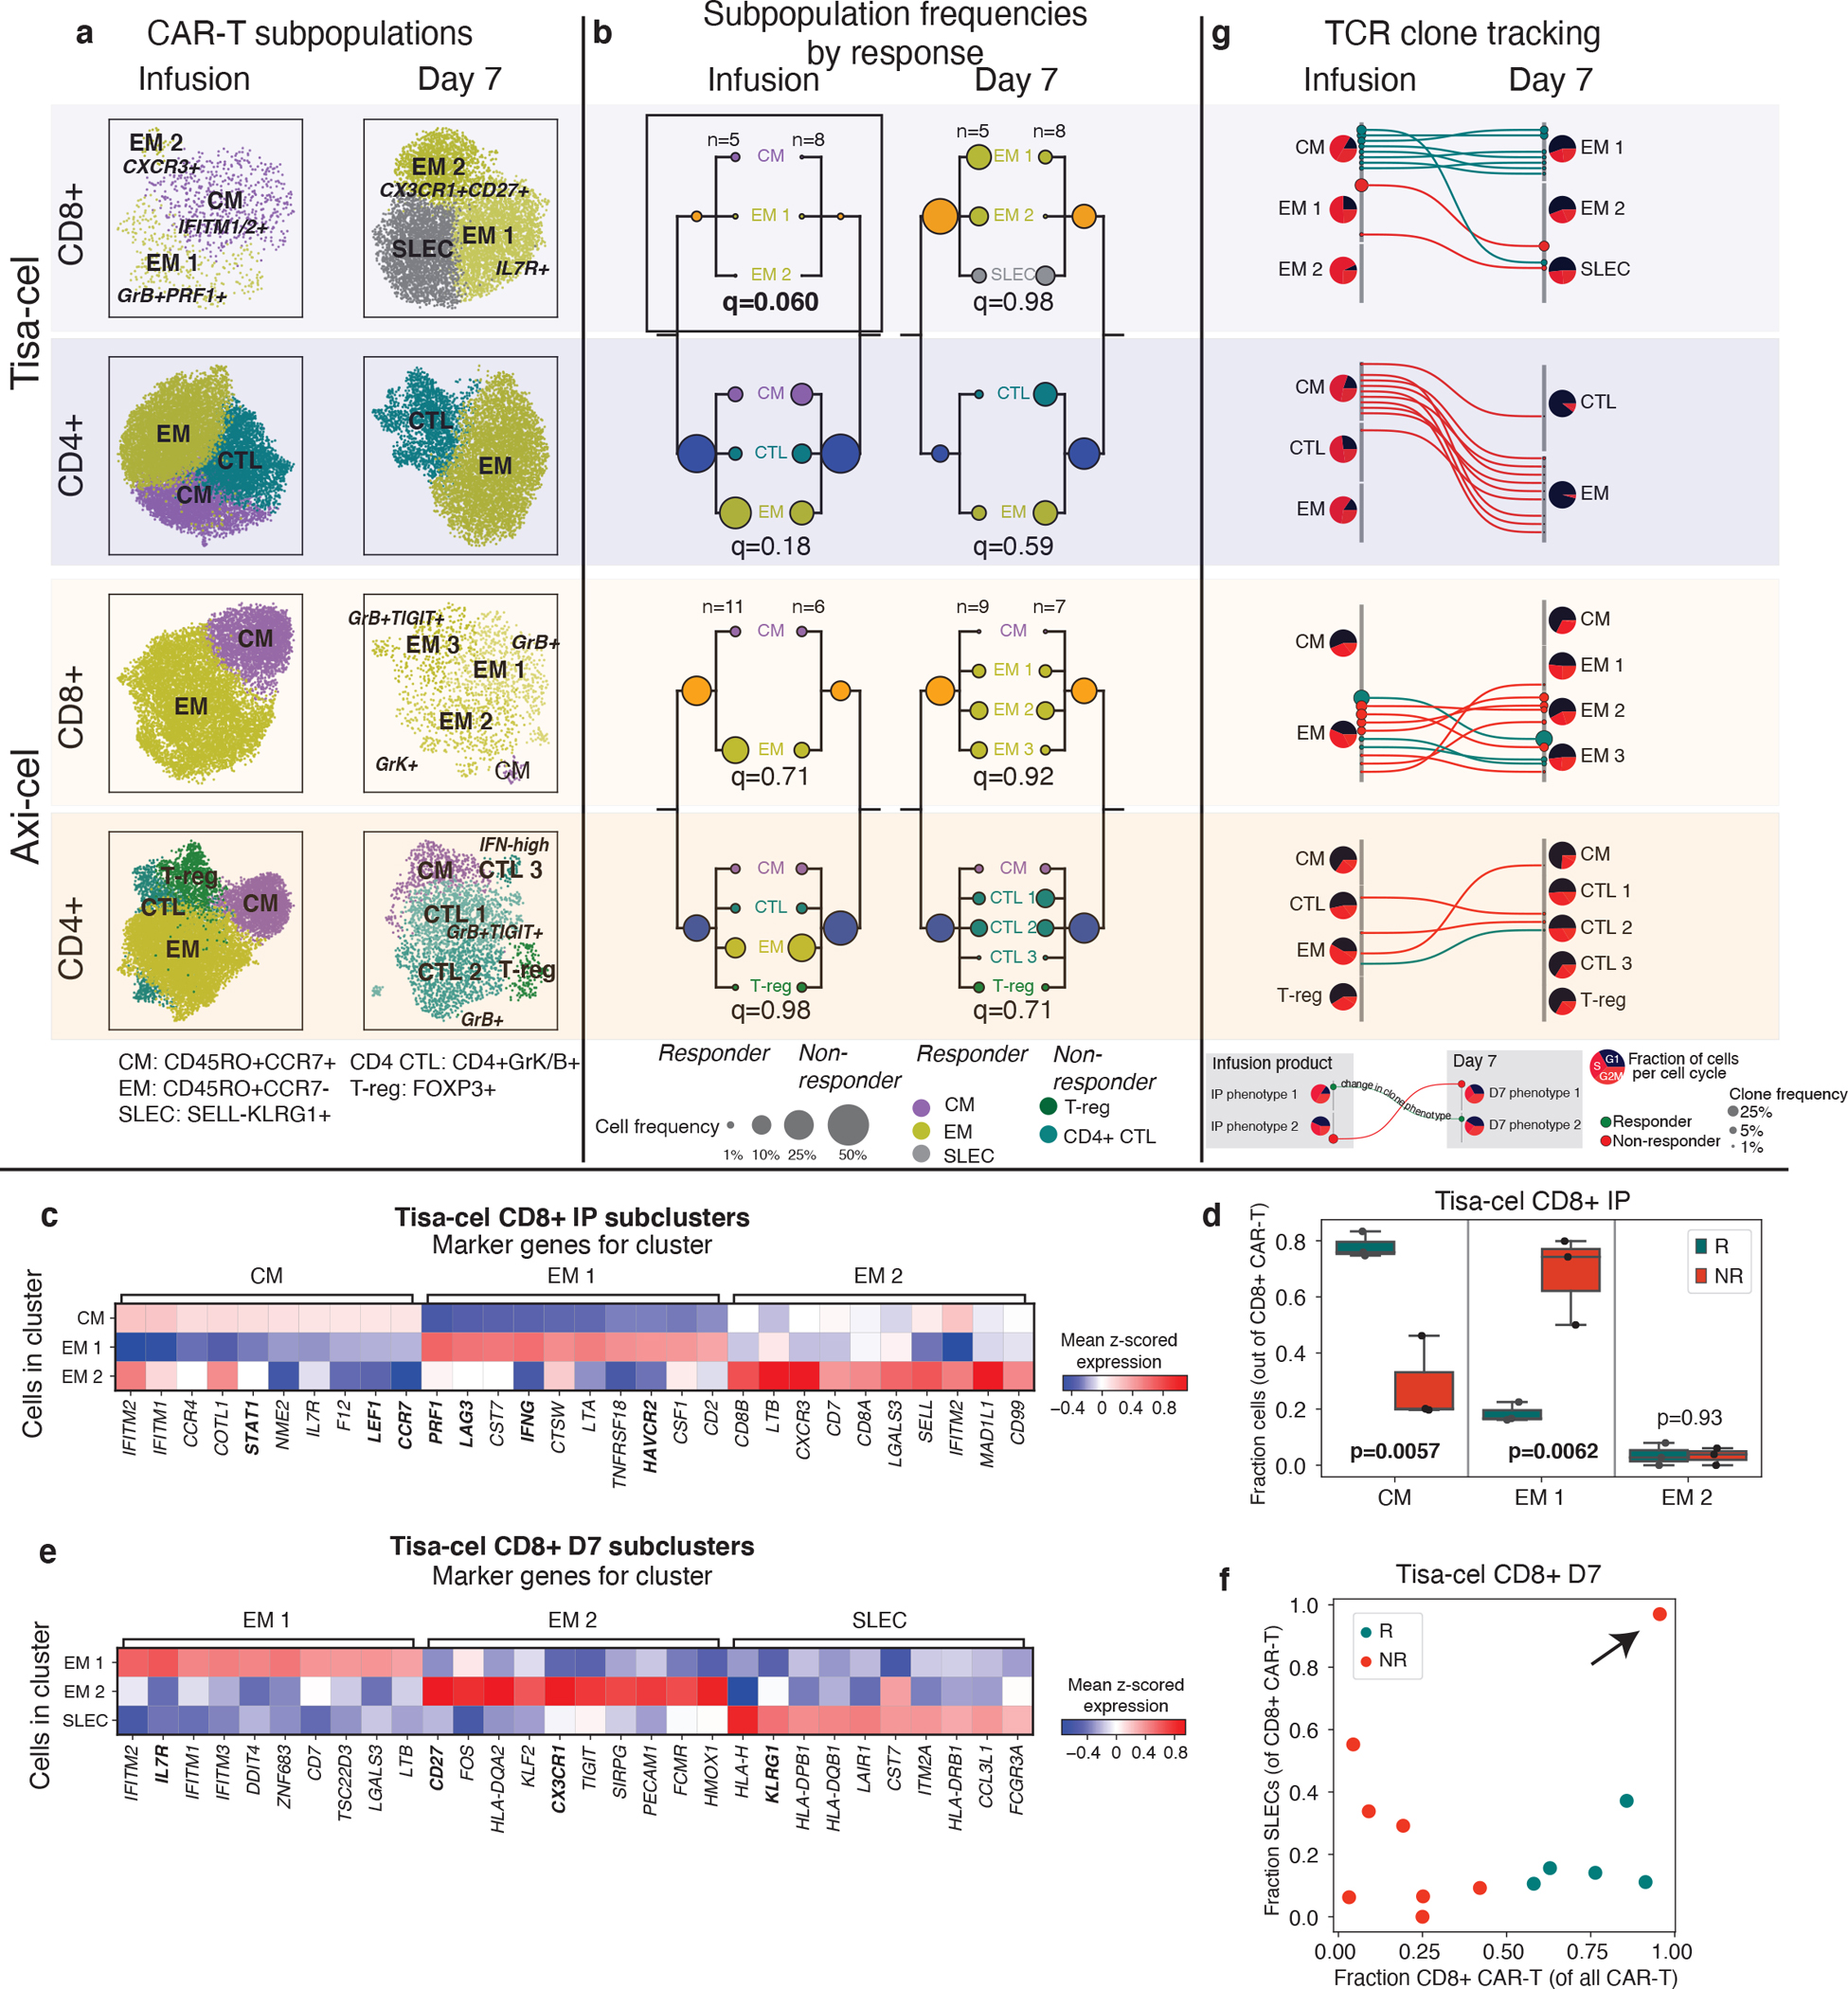
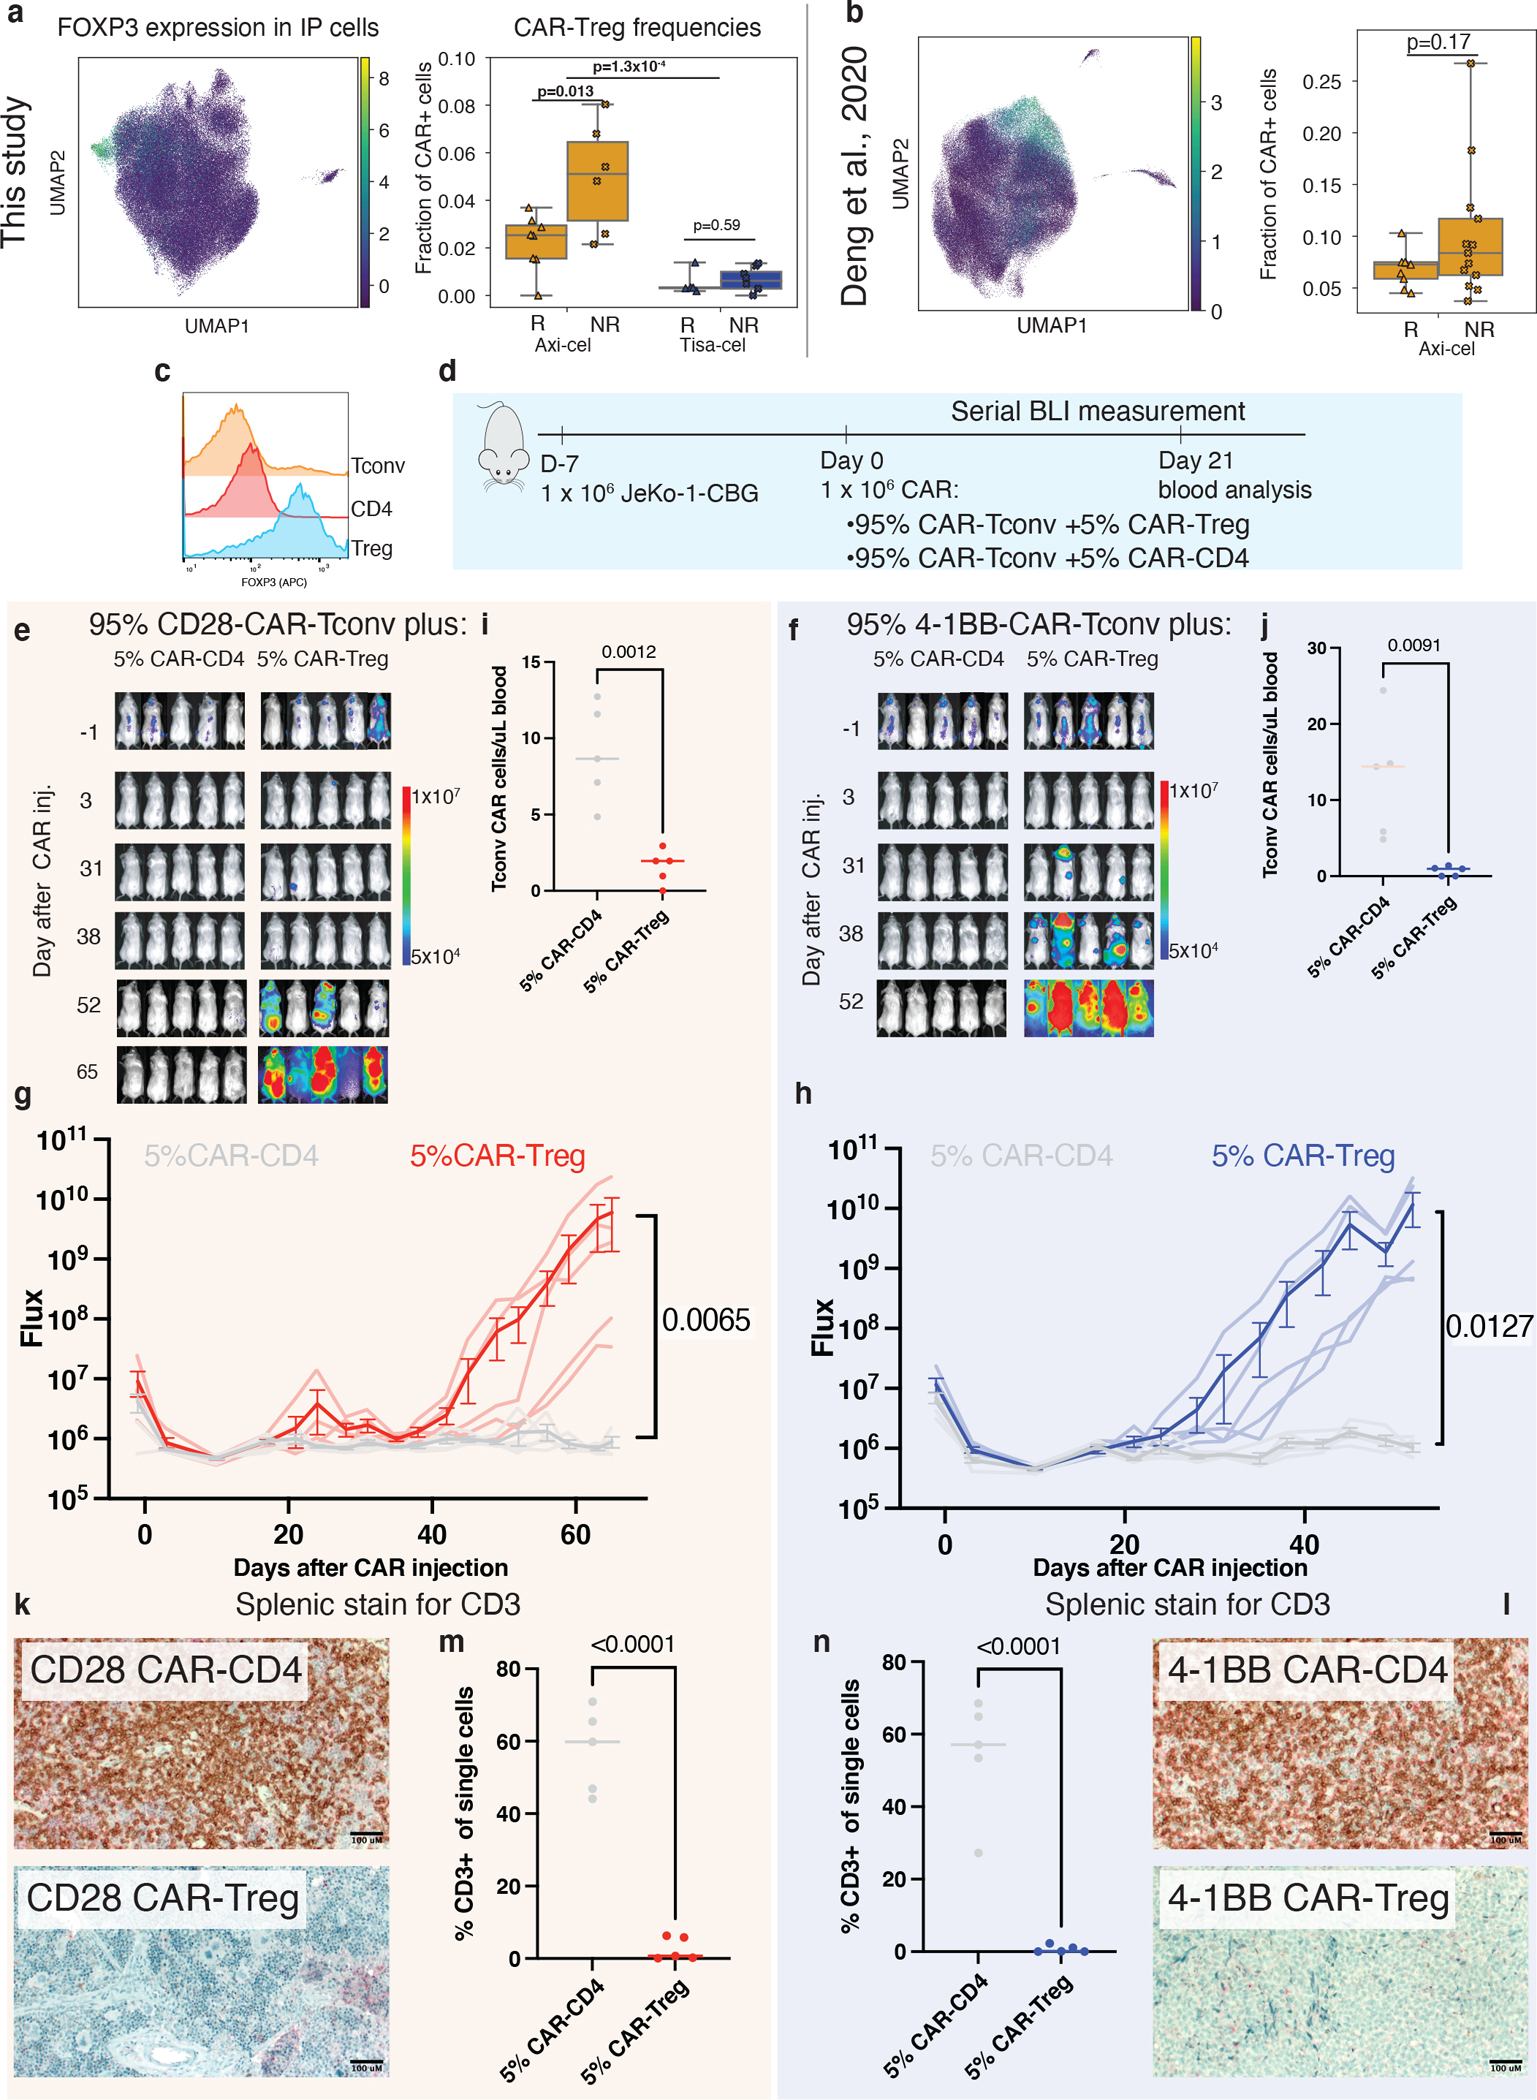
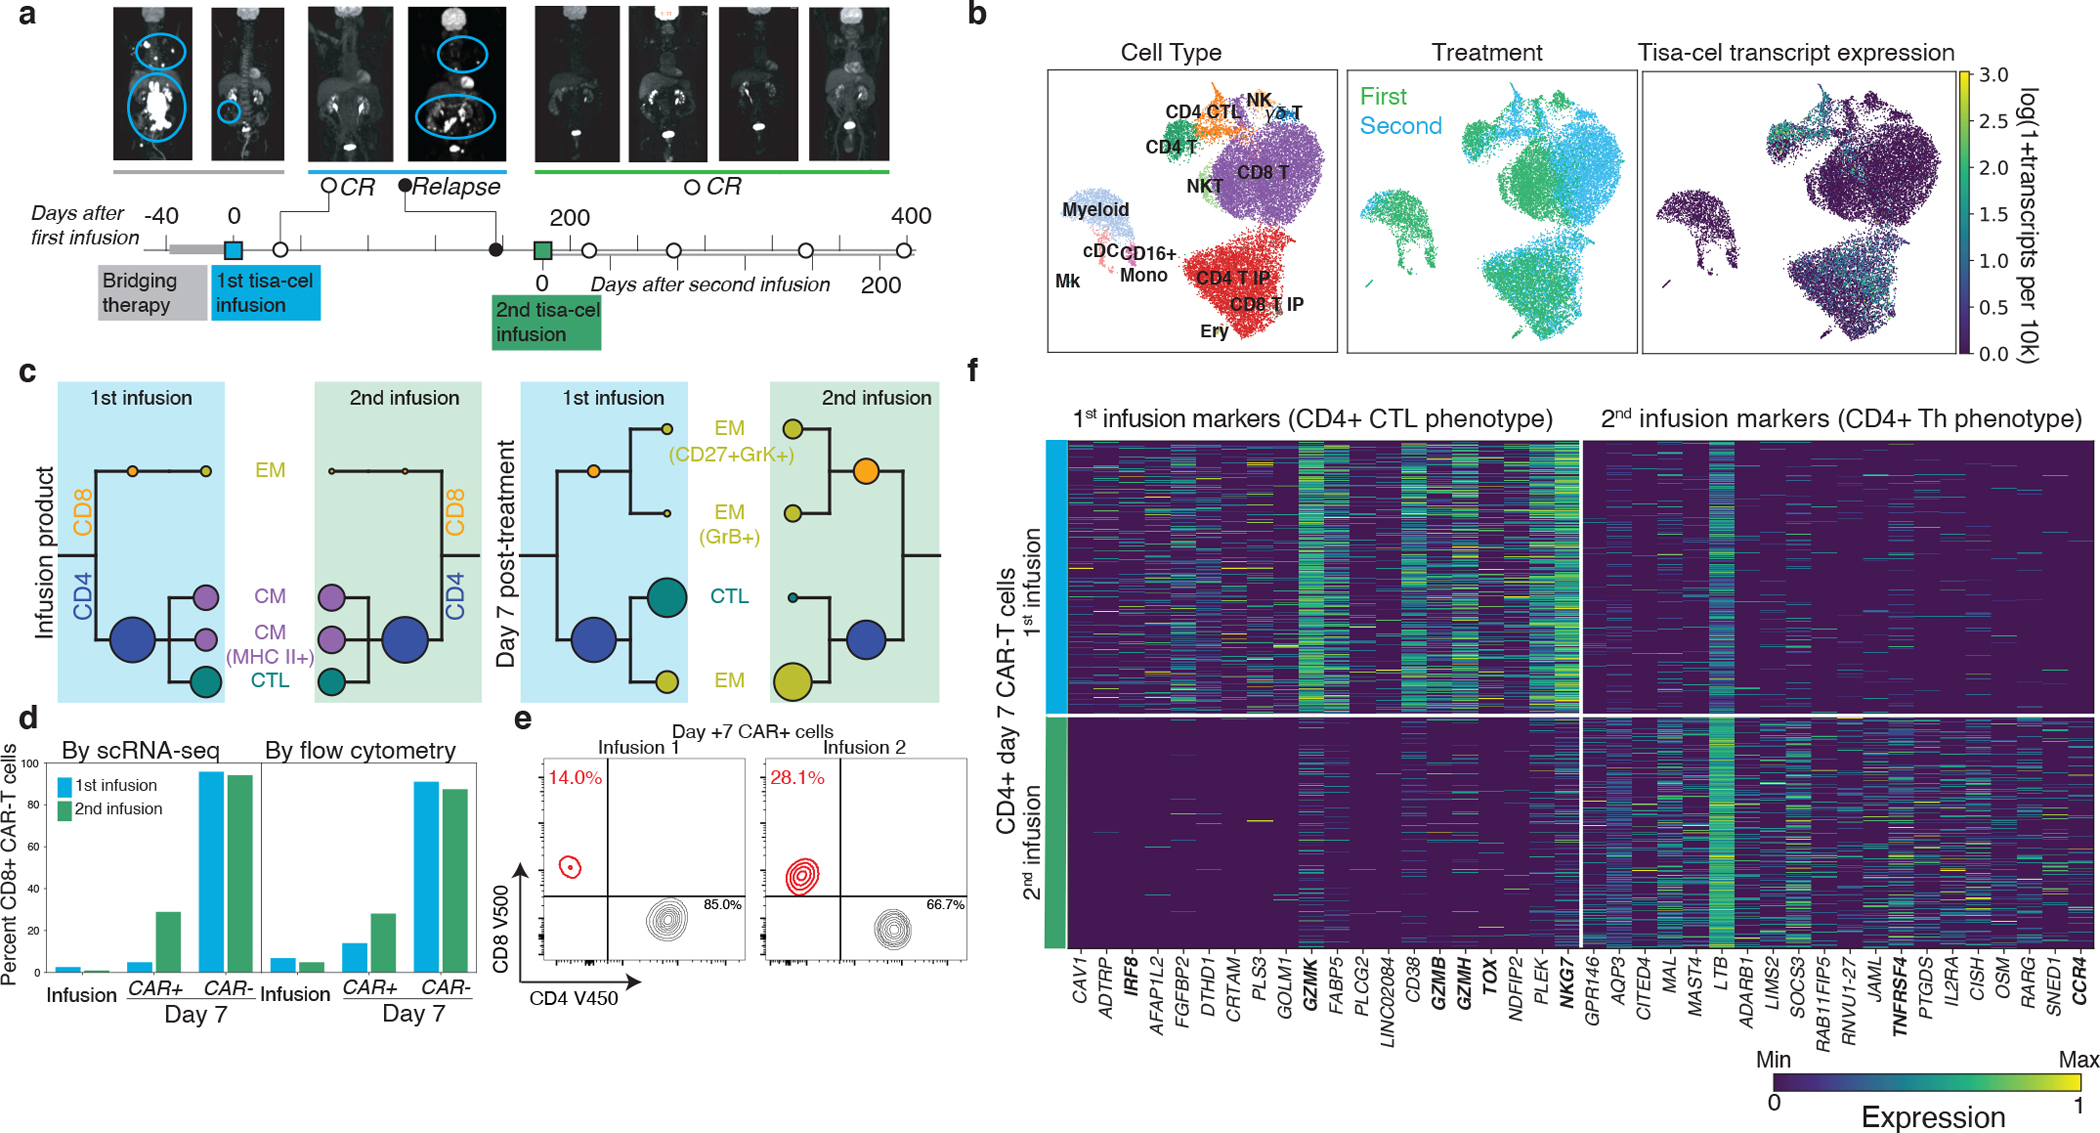
Chimeric antigen receptor (CAR)-T cell therapy has revolutionized the treatment of hematologic malignancies. Approximately half of patients with refractory large B cell lymphomas achieve durable responses from CD19-targeting CAR-T treatment; however, failure mechanisms are identified in only a fraction of cases. To gain new insights into the basis of clinical response, we performed single-cell transcriptome sequencing of 105 pretreatment and post-treatment peripheral blood mononuclear cell samples, and infusion products collected from 32 individuals with large B cell lymphoma treated with either of two CD19 CAR-T products: axicabtagene ciloleucel (axi-cel) or tisagenlecleucel (tisa-cel). Expansion of proliferative memory-like CD8 clones was a hallmark of tisa-cel response, whereas axi-cel responders displayed more heterogeneous populations. Elevations in CAR-T regulatory cells among nonresponders to axi-cel were detected, and these populations were capable of suppressing conventional CAR-T cell expansion and driving late relapses in an in vivo model. Our analyses reveal the temporal dynamics of effective responses to CAR-T therapy, the distinct molecular phenotypes of CAR-T cells with differing designs, and the capacity for even small increases in CAR-T regulatory cells to drive relapse.


Conflict of interest statement

Competing Interests Statement

N.J.H. is a consultant for MorphoSys. C.J.W. holds equity in BioNTech Inc and receives research funding from Pharmacyclics. S.H.G. holds patents related to adoptive cell therapies, held by University College London and Novalgen Limited. S.H.G. provides consultancy to Novalgen Ltd. G.G. receives research funds from IBM and Pharmacyclics, and is an inventor on patent applications related to MSMuTect, MSMutSig, MSIDetect, POLYSOLVER and SignatureAnalyzer-GPU. G.G. is a founder, consultant and holds privately held equity in Scorpion Therapeutics. M.V.M., M.B.L., and R.C.L. are inventors on patents related to adoptive cell therapies, held by Massachusetts General Hospital. M.V.M. is also an inventor on patents related to CAR-T cell therapies held by the University of Pennsylvania (some licensed to Novartis). M.V.M. is on the Board of Directors of 2SeventyBio, and holds equity in TCR2, Century Therapeutics, Oncternal, and Neximmune, and has served as a consultant for multiple companies involved in cell therapies. The remaining authors declare no competing interests.

Figures

Extended Data Fig. 1
Extended Data Fig. 1. Single-cell isolation and classification
a, Live CD14-CD3+CAR+ cells were isolated as CAR-T cells while CD3+CAR- cells were combined with CD14+CD3- cells as non-CAR-T cells for subsequent scRNAseq workflows. b, Selected marker genes for PBMC cell population identification in scRNA-seq data. c, Kernel density estimate plots of knn-smoothed (k=100) CD4 and CD8A expression across cells at day 7 and in the IP. Lines are drawn for thresholds used for classification. d, Fractions of cells of each coarse cell type for every baseline sample sorted by timepoint of sampling, as well as e, baseline tumor volume, measured by SPD (cm2). The same shown for f,g fine-grained T-cell subsets.
Extended Data Fig. 2
Extended Data Fig. 2. PBMC cell composition differences between responders and non-responders pre- and post-infusion.
a, Boxplots of the cell type frequencies for each cell type stratified by product and response. The final cell type coefficient (with its posterior 95% high density interval) and FDR value (one minus the inclusion probability) estimated by scCODA are shown. Boxes show the median, interquartile range, and maximum/minimum values. n=20 and n=22 biologically independent samples are shown for baseline and D7-CAR-negative samples, respectively. b, Fraction of cells which were CD8+CD4- at baseline, in IPs, and at day 7 in CAR+ and CAR- populations. Boxes show the median, interquartile range, and maximum/minimum values. n=20 baseline, n=30 infusion, n=29 day 7 CAR-negative, and n=29 day 7 CAR-positive independent samples are shown from 31 patients. c, Flow-cytometric measurements for the mean fraction of CAR positive cells which were CD8+CD4- at day 7 for n=27 biologically independent samples. Error bars represent standard deviation. P-values represent two-tailed Mann -Whitney U tests. d, Changes in CD8+ frequencies between IP and day 7 CAR-T cells as shown in Fig. 3b, colored by CD19 status of relapse. Samples with no relapse, or relapse without a biopsy, are grayed out.
Extended Data Fig. 3
Extended Data Fig. 3. Expression of previously proposed axi-cel response genes.
Pseudobulk expression (z-scored log transcripts per million) of CD8+ CAR-T axi-cel IP cells for genes proposed to be response-associated by Deng et al. Fisher Exact test for association between response and denoted two clusters driven by putative memory- and dysfunction-associated genes is p=1.
Extended Data Fig. 4
Extended Data Fig. 4. Detection of CD45 isoforms and T-cell subset classification in 5’ RNA-sequencing data.
a, Illustration of signal used by CD45 isoform detection model. For each read in an illustrative sample, a histogram of the fragment length assuming no splicing (RABC isoform) is shown. The distribution of reads beyond exon 3 become shifted if they come from an isoform lacking an upstream exon. b, A histogram of the expected fragment length after inference of each read is shown for the same sample in blue. The gaussian distribution modeling fragment lengths inferred by EM is plotted in orange. c, U-MAP representation of T-cells in 10x healthy PBMC demonstration dataset with both RNA-sequencing and feature-barcoding measurements. Dataset is colored by CD45RA and CD45RO expression measured by RNA (top, with k=20 knn smoothing as applied in the paper) and feature barcoding (bottom). d, Kernel density estimate plots sorting plots of cells into different memory subsets. Black lines represent cutoff used for gating. e, Confusion matrix showing concordance of cell classification by protein-based and RNA-based approaches. f, Scatterplot showing similarity of cell fraction measurements using either the RNA-based (x-axis) or protein-based (y-axis) measurements. g, Kernel density estimate distributions of knn-smoothed (k=20) CD45RA (x-axis) and CD45RO (y-axis) expression measurements in our dataset for Baseline T-cells, Infusion products, day 7 CAR− cells and day 7 CAR+ cells. A plot is shown for each sample, and the CD45RA cutoff used for classification is drawn with a blue line. All plots share x and y axis scales.
Extended Data Fig. 5
Extended Data Fig. 5. Classification of T cell subtypes.
UMAP representations of all a, CD8 and b, CD4 T cells colored by their subtype assignment. Expression of marker genes used for subtype assignment for c, CD8 and d, CD4 cells. For each a knn-smoothed (k=25) estimate is shown (right) alongside the raw measurements (left). e, Estimated fractions of CD45 isoforms that are RO (x-axis) or RA (y-axis) in CAR-T cells from infusion products and at day 7. f, Mean expression of genes related to differentiation state averaged across Naive, EM and TEMRA cells for Baseline T-cells, day 7 CAR-T cells. Naive cells for day 7 CAR+ were omitted as they were not seen in quantities that could be analyzed. Error bars represent 95% confidence intervals derived from bootstrapping cells for 1000 iterations. Shown are n=20,361 baseline (12,799 EM, 7,108 TEMRA, and 454 Naive) cells from 20 individuals, as well as n=46,750 day 7 CAR-negative (24,436 EM, 22,064 TEMRA, and 250 Naive), and n=10,010 day 7 CAR-positive (8,712 EM and 1,298 TEMRA) T-cells from 29 individuals.
Extended Data Fig. 6
Extended Data Fig. 6. CAR-T subclusters and clonal dynamics.
a, Top differentially expressed genes in each CAR-T subcluster, as determined by a t-test. The expression is shown for the top 10 marker genes of each cluster displayed in Figure 4a. b, Demonstration of unique tisa-cel responder with CD8+ cells in cluster EM 2. Shown is a scatter plot of the fraction of CD8+ cells in cluster EM 2 (y-axis) vs the fraction of all CAR-T cells that are CD8+ (x-axis). c, For each patient with at least 25 T cells in both the IP and at day 7, individual TCR clones are plotted by their frequency in the IP (x-axis) and at day 7 (y-axis). Clones are colored by whether they are CD8+ or CD4+, and denoted with an “x” if the two timepoint frequencies are significantly different by a two-tailed fisher exact test p<0.05.
Extended Data Fig. 7
Extended Data Fig. 7. Regulatory T-cells characteristics and in vitro suppression.
a, The fraction of T-cells that are T-regs in samples of each timepoint, separated by CAR+ and CAR- cells. Only samples with at least 100 T-cells of the relevant type are included in the analysis. A total of n=20 baseline, n=27 Infusion CAR-negative, n=27 Infusion CAR-positive, n=28 day 7 CAR-negative and n=22 day 7 CAR-positive biologically independent samples are shown. P-values denote a two-tailed t-test without correction for multiple hypotheses. Boxes show the median, interquartile range, and maximum/minimum values. b, Average expression in IP T-regs (orange) and all other T-cells (T-conv, blue) of the top 10 differentially expressed genes comparing T-regs and T-convs in IP cells. Genes classically associated with T-reg function are highlighted with arrows. c. Schematic for T-reg and CD4 control population isolation from healthy donor PBMC. d, CAR constructs used to identify CAR-Treg/CD4-CAR cells from CAR-Tconv. e,f, CFSE staining of CAR-Tconv cells co-cultured with either 25% CAR-Tregs or CD4-CAR control cells and stimulated at a 1:1 ratio with Jeko tumor targets at 72 hours. Dividing cells (red) are identified relative to unstimulated condition (blue). Each histogram represents an individual replicate, summarized in the plot on the right for all n=3 technical replicates per construct over 1 independent experiment. P-value represents two-tailed unpaired t-test.
Extended Data Fig. 8
Extended Data Fig. 8. Mediation of relapse by CAR-Tregs at 25%via in vivo validation experiments.
a, NSG mice were injected with 1 × 10⁶ Jeko-CBG lymphoma cells on day −7. On day 0 mice were injected with 1 × 10⁶ CAR-T cells representing 100% CAR-T convs or 75% CAR-Tconvs with either 25% CAR-Tregs or 25% CD4-CAR-T control cells. Experiment performed with CD19-CD28 (left) or CD19–4-1BB (right) constructs. b,c Time course tumor radiance (photons/sec/cm2/sr). d,e Flow cytometric quantification of CAR-Tconv day 14 after CAR injection for n =15 biologically independent animals per construct examined over 1 independent experiment. P-value represents two-tailed unpaired t-test. f,g Time course flux (photons/s). Mean ± SEM overlayed on individual subject curves for n =14 biologically independent animals per construct examined over 1 independent experiment. P-value represents the result of two-way ANOVA.. h,i Representative immunohistochemical staining for human CD3 in the spleen. j,k Flow cytometric quantification of CD3 cells from the spleens of the indicated conditions for n=15 (CD28) and n=14 (4–1BB) biologically independent animals examined over 1 independent experiment. P-value represents two-tailed unpaired t-test.
Extended Data Fig. 9
Extended Data Fig. 9. Changes in PBMC populations in patient treated with second infusion of tisa-cel.
a, Expression of marker genes for PBMC cell type classification. b, Fractions of day 7 CAR-negative cells falling into each cell type cluster, stratified by first and second infusion. c, Top 20 genes differentially increased and decreased (by Mann-Whitney U test) comparing CD8+ CAR-negative T cells between the first and second treatments at day 7.
Extended Data Fig. 10
Extended Data Fig. 10. Summary of cellular and transcriptomic changes associated with clinical outcome and timepoint.
Graphic depicting the cellular associations of response and temporal changes identified in this study.
Figure 1.
Figure 1.. The landscape of CAR-T and host immune populations in CAR-T treated patients.
a, Illustration of study design. b, Swimmer plot of patient outcomes. Bars represent follow-up window (either by PET scan or physician report), circles represent outcome of PET scans, and arrows represent ongoing response. Stars designate timepoints at which samples were collected for scRNA-sequencing. n=32 patients are shown. c, Fraction of cells per sample with at least one detected tisa-cel or axi-cel transcript. Each circle represents a sample, and samples from patients with tisa-cel or axi-cel are stratified. n=20 baseline, n=31 infusion product, n=22 day 7 CAR-positive, n=22 day 7 CAR-negative, and n=7 day 7 unsorted biologically independent samples are shown. The timepoint and sorting strategy is denoted on the x-axis. Boxes show the median, interquartile range, and maximum/minimum values. d, UMAP representation of full dataset. On the left, colored by cell type, timepoint, and subject. On the right, cells from the same UMAP subset for each timepoint are colored by the CAR treatment (axi-cel orange, tisa-cel blue), and e, colored by the expression of each CAR construct detected in each cell.
Figure 2.
Figure 2.. Pseudobulk analysis of genes related to treatment, timepoint, and response.
a, Schematic of pseudobulk approach. T-cells from IP and day 7 samples are in-silico sorted for CAR+ and CAR- cells, and when stated CD4 and CD8. Transcript counts are then combined across these cells into one pseudobulk observation. Different conditions are then compared using limma. b, Scatterplot of two-tailed -log10 p-values derived from moderated t-statistics calculated by the limma package testing differential expression between CAR+ and CAR- (not separating CD4 and CD8) pseudobulk samples from the IP (left, n=13 and n=18 for tisa-cel and axi-cel, respectively) and day 7 PBMCs (right, n=13 and n=15) for each product. Genes with Benjamini-Hochberg corrected p-values of q<.1 are colored (plotted values are uncorrected). c, Expression of previously identified signature of 4–1BB CAR activation across timepoints and patients. d, Comparison of genes differentially expressed between CD8+ cells in the infusion products (n=7 and n=15 for tisa-cel and axi-cel, respectively) and at day 7 (n=10 and n=7 for tisa-cel and axi-cel). The scatter plot shows the signed log10 p-values obtained from limma testing differences between IP and day 7 samples for tisa-cel (x-axis) and axi-cel (y-axis). Positive values indicate higher expression at day 7, and negative values higher in the IP. e, Illustration of several highlighted genes in panel d. Lines represent the changes in expression of the gene between infusion product and day 7 in CD8+ CAR-T cells of a single sample. Samples are colored by treatment, and split violins represent the distribution of expression across patients of each treatment at a given timepoint. Only samples with ≥25 cells are shown, including n=22 infusion product and n=17 day 7 CAR-positive biologically independent samples. Boxes show the interquartile range.
Figure 3.
Figure 3.. Temporal evolution of T cells in responders and non-responders of different products.
a, Kaplan-meier response curves stratified by whether patients had >50% CD8 CAR-T cells (out of all CAR-T cells) at day 7. P-values testing the significance of this stratification using a cox proportional-hazards model are shown. b, Changes in CD8 frequency between different timepoints for CAR- and CAR+ cells. c, Fraction of cycling cells at different timepoints for different CD4/8 designations, treatments, and response outcomes. A two-tailed t-test is shown for tisa-cel CD8+ IPs comparing responders and non-responders (p=0.007, t-statistic=−4.3, n=4 and n=3 for R and NR). Individual samples are shown as dots, and a line is drawn showing the mean of each timepoint, with an error band showing a 95% confidence interval derived from bootstrapping 1000 iterations. d, Volcano plots of differentially expressed genes in CD8+ CAR-T cells between responders and non-responders for each product and timepoint. P-values are calculated with the limma package two-tailed test of moderated t-statistics. All genes with Benjamini-Hochberg FDR-corrected p-values q<0.25 are colored and labeled (plotted values are uncorrected). The area of each dot is the absolute value of the log2 fold change times the negative log10 p-value. e, PCA dimensionality reduction using knn-smoothed expression of T differentiation markers (CD45RO, CD45RA, and CCR7) visualizing the classification of T cell subtypes. Dotted lines represent where the cutoffs used to define CCR7+ and CD45RA+ (smoothed expression values >0.5) fall in the projection. f, Depiction of T subset frequencies at each timepoint for each product and response. Bar widths at each timepoint are proportional to the fraction of cells (out of all calls) being classified as a particular subset. CD4 and CD8 cells are stratified, and distinguished with cross-hatching for CD4 subsets.
Figure 4.
Figure 4.. Tracking temporal evolution of CAR-T clones by TCR sequencing.
a, u-map plots of CAR-T cells of different treatments and at different timepoints colored by subcluster. b, Frequencies of CAR-T subclusters. Circle area represents the estimated median percentage of cells belonging to the cluster (out of all CAR-T cells) in patients treated with each product and with each response outcome. c, Top 10 differentially expressed genes in each tisa-cel CD8+ IP subcluster, as identified by a t-test. d, Relative frequencies of each tisa-cel CD8+ IP cluster stratified by response. Only samples with at least 25 CD8+ CAR-T cells are shown. e, Top differentially expressed genes in each tisa-cel CD8+ day 7 subcluster, as identified by a two-tailed t-test. Biologically independent samples from n=3 responders and n=3 non-responders are shown. Boxes show the median, interquartile range, and maximum/minimum values. f, Scatter plot of the fraction of CD8+ tisa-cel day 7 cells in each patient that fell into the SLEC cluster (y-axis) vs the overall fraction of CAR-T cells that were CD8+ (x-axis). Arrow highlights the sole non-responder to have predominantly CD8+ cells are day 7. g, Up to 15 of the most prevalent TCR clones identified at both time points are shown for each CAR-T subset. For each, circles show the cluster in Figure 3D to which the clone belongs at each timepoint, with sizes corresponding to the clone frequency in its sample. Pie charts show the distribution of cells in each phase of the cell cycle.
Figure 5.
Figure 5.. Mediation of relapse by CAR-Tregs in patients and in vivo validation experiments.
a, Summary of CAR-Treg representation in infusion product cells of this dataset (n=28 biologically independent samples with ≥100 cells) as well as b, an independent set of axi-cel infusion products (n=24 biologically independent samples). Shown are a u-map representation of cells colored by FOXP3 expression (left) and the fraction of identified CAR-Tregs (out of all CAR-T cells) stratified by product and response (right). Boxes show the median, interquartile range, and maximum/minimum values. c, Intracellular flow cytometry staining of FOXP3 staining of donor T-regs, CD4 control T-cells, and Tconv T-cells. d, Schematic of in vivo CAR-Treg validation. NSG mice were injected with 1 × 10⁶ Jeko-CBG lymphoma cells on day −7. On day 0 mice were injected with 1 × 10⁶ CAR-T cells representing 95% CAR-Tconvs with either 5% CAR-Tregs or 5% CD4-CAR-T control cells. Experiment performed with CD19-CD28 (left) or CD19–4-1BB (right) constructs. e,f, Time course tumor radiance (photons/sec/cm2/sr) and g,h, flux (photons/s) for CD28 and 4–1BB experiments respectively. Mean ± SEM overlayed on individual subject curves for n=10 biologically independent animals treated with each construct. P-value represents the result of two-way ANOVA. i,j, Flow cytometric quantification of CAR-Tconv day 14 after CAR injection for n=10 biologically independent animals. P-value represents two-tailed unpaired t-test. A line denoting the median value is shown. k,l, Representative immunohistochemical staining for human CD3 in the spleen. m,n, Flow cytometric quantification of CD3 cells from the spleens of the indicated conditions for n=10 biologically independent animals. P-value represents two-tailed unpaired t-test. A line denoting the median value is drawn.
Figure 6.
Figure 6.. Differential characteristics of tisa-cel expansion in patient with relapse and subsequent retreatment.
a, PET scans and illustration of treatment timeline for patient with relapse and subsequent re-treatment. b, U-map representation of cells from patient with second treatment colored by cell type, CAR (tisa-cel) expression, and first or second infusion. c, CAR-T subpopulation frequencies using the same visualization described in Fig. 4b. d, Fraction of CD8+ cells found by scRNA and flow-cytometry in different T cell subsets for each treatment. e, Flow cytometric measurements of CD8+ cell fractions in day 7 CAR-T cells. f, Top differentially expressed genes between the two treatments for CD4+ CAR-T cells, as determined by a t-test.

Comment in

References

    1. Maude SL et al. Chimeric Antigen Receptor T Cells for Sustained Remissions in Leukemia. N. Engl. J. Med. 371, 1507–1517 (2014). - PMC - PubMed
    1. Schuster SJ et al. Chimeric Antigen Receptor T Cells in Refractory B-Cell Lymphomas. N. Engl. J. Med. 377, 2545–2554 (2017). - PMC - PubMed
    1. Singh N et al. Impaired Death Receptor Signaling in Leukemia Causes Antigen-Independent Resistance by Inducing CAR T-cell Dysfunction. Cancer Discov. 10, 552–567 (2020). - PMC - PubMed
    1. Dufva O et al. Integrated drug profiling and CRISPR screening identify essential pathways for CAR T-cell cytotoxicity. Blood 135, 597–609 (2020). - PMC - PubMed
    1. Orlando EJ et al. Genetic mechanisms of target antigen loss in CAR19 therapy of acute lymphoblastic leukemia. Nat. Med. 24, 1504–1506 (2018). - PubMed

Publication types

MeSH terms