. 2022 Sep;28(9):1860-1871.
doi: 10.1038/s41591-022-01960-7. Epub 2022 Sep 12.

Post-infusion CAR TReg cells identify patients resistant to CD19-CAR therapy

Affiliations

Post-infusion CAR TReg cells identify patients resistant to CD19-CAR therapy

Zinaida Good et al. Nat Med. 2022 Sep.

Abstract

Approximately 60% of patients with large B cell lymphoma treated with chimeric antigen receptor (CAR) T cell therapies targeting CD19 experience disease progression, and neurotoxicity remains a challenge. Biomarkers associated with resistance and toxicity are limited. In this study, single-cell proteomic profiling of circulating CAR T cells in 32 patients treated with CD19-CAR identified that CD4+Helios+ CAR T cells on day 7 after infusion are associated with progressive disease and less severe neurotoxicity. Deep profiling demonstrated that this population is non-clonal and manifests hallmark features of T regulatory (TReg) cells. Validation cohort analysis upheld the link between higher CAR TReg cells with clinical progression and less severe neurotoxicity. A model combining expansion of this subset with lactate dehydrogenase levels, as a surrogate for tumor burden, was superior for predicting durable clinical response compared to models relying on each feature alone. These data credential CAR TReg cell expansion as a novel biomarker of response and toxicity after CAR T cell therapy and raise the prospect that this subset may regulate CAR T cell responses in humans.


Conflict of interest statement

Competing interests

All other authors declare no competing interests.

Figures

Extended Data Fig. 1.
Extended Data Fig. 1.. Peripheral CAR T cell expansion is associated with toxicity and not with clinical response at 6 months.
a, Absolute counts of CD4+ (left) and CD8+ (right) CAR T cells in blood on days 7, 14, 21, and 28 following axi-cel infusion (n = 32 patients, 128 observations). LOD, limit of detection. b, CAR T cell AUMC0–28 for patients in CR or PD at 6 months (n = 29; patients 042 and 058 had PR and SD at 6 months, respectively; patient 032 died from a non-progression related cause prior to 6 months). c, CAR T cell AUC0–28 (left) and AUMC0–28 (right) stratified by the best response as CR or other (PR, n = 9; SD, n = 1; PD, n = 2; no data for patient 058) (n = 31). d, Absolute CAR T cell counts in blood on days 7, 14, 21, and 28 for patients in CR or PD at 6 months (n = 28 on day 7, n = 28 on day 14, n = 26 on day 21, n = 26 on day 28). e, Absolute counts of circulating CAR T cells at peak expansion for patients in CR or PD at 6 months (n = 29). f, Quantitative PCR (qPCR) measuring CAR copies per 50 ng DNA in blood over 28 days as CAR T AUC0–28 (left) and AUMC0–28 (right) stratified for patients in CR or PD at 6 months (n = 28). g, qPCR CAR T AUC0–28 (left) and AUMC0–28 (right) stratified by the best response at 6 months as CR or other (PR, SD, PD) (n = 30). h, qPCR CAR copies per 50 ng DNA in blood at peak expansion for patients in CR or PD at 6 months (n = 28). i, CAR T cell AUC0–28 (left) and AUMC0–28 (right) stratified by maximum CRS grade (n = 31). j, Absolute CAR T cell counts in blood at peak expansion (n = 32) and on days 7 (n = 31), 14 (n = 30), 21 (n = 28), and 28 (n = 28) stratified by maximum CRS grade. k, CAR T cell AUMC0–28 stratified by maximum ICANS grade (n = 31). l, Absolute CAR T cell counts in blood at peak expansion (n = 32) and on days 7 (n = 31), 14 (n = 30), 21 (n = 28), and 28 (n = 28) stratified by maximum ICANS grade. Boxplots in (b-l) show quartiles with a band at median, whiskers indicating 1.5 IQR, and all observations overlaid as dots. P-values are from two-sided Mann-Whitney U test.
Extended Data Fig. 2.
Extended Data Fig. 2.. Protein expression in CyTOF metaclusters of circulating CAR T cells on day 7.
a, Expression of 24 proteins overlaid onto the minimum spanning tree from Fig. 2c, which shows hierarchical consensus clustering of circulating CAR+ T cells on day 7 following axi-cel infusion (n = 31 patients), with 25 clusters grouped into 10 metaclusters. No CyTOF data were obtained for patient 038. Expressions of CD45 and CAR are not shown, as these proteins were used for gating and were not used for clustering. See Fig. 2g for the expression of the remaining proteins. b, Contour plots showing expression of exhaustion markers CD39 and CD279 (PD1) against senescence marker CD57 in CAR and CAR+ T cells, as well as in CAR T cell metaclusters 3, 4, and 6, for patient 004. Geometric mean for each marker on the X-axis is indicated in the top right corner of each plot.
Extended Data Fig. 3.
Extended Data Fig. 3.. CAR T cell hyperspheres associated with clinical response at 6 months.
a, Schematic for differential abundance analysis comparing circulating CAR T cells on day 7 between patients in CR or PD at 6 months following axi-cel infusion (n = 28). CAR T cells falling into the same region of space in all dimensions (hypersphere) were quantified to generate comparison metrics for patients in CR vs. PD at 6 months. b, Volcano plot showing hyperspheres generated as described in (a) that are significantly differentially abundant between patients in CR or PD at 6 months. c, Log2 fold change overlaid onto hyperspheres from (a) that were embedded into UMAP coordinates. Groups of hyperspheres that correspond to the 3 CAR T cell populations identified by the lasso model in Fig. 2d are highlighted. d, FDR-corrected P-values overlaid onto hyperspheres from (c) and stratified by the statistical significance threshold of P < 0.05. e, Individual marker expression overlaid onto hyperspheres from (c).
Extended Data Fig. 4.
Extended Data Fig. 4.. CAR T cell hyperspheres associated with severe neurotoxicity.
a, Schematic for differential abundance analysis comparing circulating CAR T cells on day 7 between patients with low (max ICANS grade 0–1) or severe (max ICANS grade 2–4) neurotoxicity (n = 31). CAR T cells falling into the same region of space in all dimensions (hypersphere) were quantified to generate comparison metrics for patients with low or severe neurotoxicity. b, Volcano plot showing hyperspheres generated as described in (a) that are significantly differentially abundant between patients with low (max ICANS grade 0–1) or severe (max ICANS grade 2–4) neurotoxicity. c, Log2 fold change overlaid onto hyperspheres from (b) that were embedded into UMAP coordinates. Groups of hyperspheres that correspond to the 2 CAR T cell populations identified by the lasso model in Fig. 2h are highlighted. d, FDR-corrected P-values overlaid onto hyperspheres from (c) and stratified by the statistical significance threshold of P < 0.05. e, Individual marker expression overlaid onto hyperspheres from (c).
Extended Data Fig. 5.
Extended Data Fig. 5.. Dynamics of CAR T cell populations associated with clinical response or neurotoxicity.
a, Percentage of circulating T cells in 3 gates based on CyTOF data, as defined in Fig. 3a, prior to axi-cel infusion for patients in CR or PD at 6 months (n = 27; no pre-infusion sample for patient 005). b, Percentage of circulating CAR T cells on day 21 in 3 gates for patients in CR or PD at 6 months (n = 28; n = 27 for CD4+ populations: n.d. for patient 040). c-d, Percentage of circulating CAR-negative T cells in 3 gates on day 7 (c) or day 21 (d) for patients in CR or PD at 6 months (n = 28). e, Gate defined based on metacluster 8 from the lasso model for predicting maximum ICANS grade as 0–1 vs. 2–4 based on metacluster abundance of circulating CAR T cells on day 7 (Fig. 2j). Contour plots show CyTOF data for CAR+ T cells on day 7 from patients 042 (max ICANS grade 0) and 050 (max ICANS grade 3). f, Percentage of circulating CD57+ CD101+ cells among CD8+ CAR T cells on day 7 in gate from (e) for patients with maximum ICANS grade 0–1 or 2–4 (n = 31). g, Percentage of CD57 Helios+ cells among CD4+ T cells in blood prior to axi-cel infusion (left; n = 30) or among CD4+ CAR T cells on day 21 post-infusion (right; n = 30) for patients with maximum ICANS grade 0–1 or 2–4. Boxplots in (a-d,f,g) show quartiles with a band at median, whiskers indicating 1.5 IQR, and all observations overlaid as dots. P-values are from two-sided Mann-Whitney U test.
Extended Data Fig. 6.
Extended Data Fig. 6.. CMV status is not associated with prevalence of CD57-expressing CAR T cell populations or patient outcome.
a, Percentage of circulating CD57+, CD4+ CD57+, CD4+ CD57+ T-bet+, and CD8+ CD57+ T-bet+ T cells based on CyTOF data prior to axi-cel infusion stratified by patient cytomegalovirus (CMV) infection status (n = 30). b-e, Percentage of circulating CD57+ populations of CAR-negative (b-c) or CAR-positive (d-e) T cells on day 7 (b,d) or day 21 (c,e) stratified by patient CMV status (n = 31; n = 30 for CD4+ CAR+ T cells on day 21). f, Kaplan-Meier analysis of time to progression (TTP; left) and overall survival (OS; right) stratified by patient CMV status. Boxplots in (a-e) show quartiles with a band at median, whiskers indicating 1.5 IQR, and all observations overlaid as dots. P-values are from two-sided Mann-Whitney U test.
Extended Data Fig. 7.
Extended Data Fig. 7.. Identified populations in healthy donors and CD19-CD28ζ CAR-transduced T cells.
a-b, Contour plots show three identified populations among T cells from a healthy donor (a) and among CD19-CD28ζ CAR-transduced T cells generated in the lab (b). Population statistics for two donors are shown as mean ± SEM on each plot. c, Percentage of FOXP3+ CD25High and FOXP3+ Helios+ cells among CD4+ T cells are shown for a healthy donor (top) and for CD19-CD28ζ CAR-transduced T cells generated in the lab (bottom). Population statistics for two donors are shown as mean ± SEM on each plot. d, Cryopreserved T cells from a healthy donor were incubated with PMA and ionomycin for 6 hours and analyzed by flow cytometry. Contour plots show gating strategy that was applied to patient samples in Fig. 4.
Extended Data Fig. 8.
Extended Data Fig. 8.. Selected gene and surface protein expression in three identified CAR T cell populations.
a, CAR+ T cells were sorted from 9 LBCL patients on day 7 following axi-cel infusion and analyzed by scRNA-seq, scTCR-seq, and CITE-seq on the 10X Genomics platform. Patient IDs overlaid onto the wnnUMAP coordinates that integrate scRNA-seq and CITE-seq data (n = 6,316 cells). Numbers of filtered cells analyzed for each patient are indicated in parentheses. b, Cell subsets, which were defined by projecting data onto the public reference dataset containing leukocytes from healthy donors using Azimuth, overlaid onto the wnnUMAP coordinates from (a). c, Heatmap showing distribution of selected mRNA and surface epitope markers of TReg and TEFF subsets across patients in 120 cells sampled from each CAR T cell populations defined in Fig. 5b (n = 480 cells). d, Expression of selected genes overlaid onto the wnnUMAP coordinates from (a). Protein encoded by each gene is shown in parentheses. e, Surface expression of selected proteins overlaid onto the wnnUMAP coordinates from (a). f, Violin plots showing selected gene and surface protein expression across CAR T cell populations defined in Fig. 5b (n = 6,316 cells). Stars denote significant (P < 0.05) upregulation in the indicated population relative to all populations without stars. Other significant relationships are not denoted. P-values were calculated using Kruskal-Wallis H test, followed by unpaired two-sided Wilcoxon-Mann Whitney U test applied to each treatment pair, with Bonferroni correction for multiple hypothesis testing. #CD152 surface expression was predicted using Azimuth. g, Cell cycle phases overlaid onto the wnnUMAP coordinates from (a) (top) and shown as a bar plot in each CAR T cell population (bottom).
Extended Data Fig. 9.
Extended Data Fig. 9.. Helios-expressing CD57+ T-bet+ CAR T cells display an NK-like transition program.
a, Pearson correlation between percentage of CD57 Helios+ cells among CD4+ CAR T cells and expansion of CAR T cells, quantified as log10 AUC0–28 for all study patients with available data (n = 49). P-value is from the correlation test. b, Percentage of CD57 Helios+ cells among CD4+ CAR T cells separated by maximum ICANS grade and day of maximum ICANS (n = 54). c, Percentage of CD57+ T-bet+ cells among CD4+ CAR T cells (left, n = 23) or CD8+ CAR T cells (right, n = 27) in blood on day 7 post-infusion separated by response at 6 months in patients from the validation cohort with ≥100 CD4+ or CD8+ CAR T cells detected, respectively. d, Scatter plot showing percentage of CD57 Helios+ vs. CD57+ T-bet+ cells among CD4+ CAR T cells in both discovery and validation cohorts (n = 54). e, Percentage of Helios+ cells among CD4+ CD57+ T-bet+ cells separated by response at 6 months in patients from the discovery (left, n = 21) or validation (right, n = 19) cohorts with ≥10 CD4+ CD57+ T-bet+ CAR T cells detected. f, Volcano plot showing differentially expressed genes comparing Helios+ to Helios cells within CD57+ T-bet+ CAR T cells (n = 774 cells) using scRNA-seq data from 9 LBCL patients on day 7 following axi-cel infusion. Differentially upregulated genes are in red; genes used to define each population are in black. g-h, Violin plots showing selected T cell (b) or NK-related (h) gene and surface protein expression in Helios and Helios+ cells within CD57+ T-bet+ CAR T cells (n = 774 cells). Stars denote significant (P < 0.05) upregulation in the indicated population relative to the population without a star. Boxplots in (b,c,e) show quartiles with a band at median, whiskers indicating 1.5 IQR, and all observations overlaid as dots. P-values were calculated using two-sided Wilcoxon-Mann Whitney U test.
Extended Data Fig. 10.
Extended Data Fig. 10.. Risk of clinical progression based on either high LDH or CAR TReg fraction alone.
a, Pearson correlation between pre-LD LDH levels and percentage of CD57 Helios+ (TReg-like) cells among CD4+ CAR T cells in blood on day 7 post-infusion colored by response at 6 months (n = 53). P-value is from the correlation test. b, Percentage of CAR TReg cells separated by normal or high pre-LD LDH levels (n = 53). c, Percentage of CAR TReg cells in patients with CR or PD at 6 months with normal pre-LD LDH (left, n = 25) or high pre-LD LDH (right, n = 26). Boxplots in (b,c) show quartiles with a band at median, whiskers indicating 1.5 IQR, and all observations overlaid as dots. P-values are from two-sided Mann-Whitney U test. d, Logistic regression models for predicting response at 6 months based on either percent of CAR TReg cells (top, n = 28), or whether pre-LD LDH levels were above normal (bottom, n = 29). Models were fit using all available data from the discovery cohort, with parameters shown below the formula. e, Performance of each model from (d) on discovery (top, n = 28; bottom, n = 29) and validation (top, n = 23; bottom, n = 33) cohorts. All available data not in the discovery cohort were used to test each model (Supplementary Table S5). AUROC, area under the receiver operating characteristic. f-g, Kaplan-Meier analysis of TTP (f) and OS (g) stratified by high vs. low risk using the models from (d) on cohorts from (e).
Fig. 1.
Fig. 1.. Clinical response in LBCL patients treated with axi-cel is not associated with peripheral CAR T cell expansion.
a, Summary of clinical parameters for the study cohort of LBCL patients treated with axi-cel (n = 32). b, PFS (left) and OS (right) for the patient cohort following axi-cel infusion (n = 32). Patient 032 died in remission at 4.5 months post-infusion. Grey boxes show 6 and 12-month follow-up visit windows. Dashed lines indicate the end of each visit period, where survival estimates were calculated. SE, standard error. c, Flow cytometry assay for monitoring absolute counts of circulating CD4+ and CD8+ CAR T cells in axi-cel patients, gated as CD3ε+ CD4+ CD8α CAR+ or CD3ε+ CD4 CD8α+ CAR+ events among single viable CD45+ lymphocytes. An example partial gating scheme for patient 040 is shown. d, CAR T cell absolute blood counts on days 7, 14, 21, and 28 following axi-cel infusion (n = 32 patients, 128 observations). LOD, limit of detection. e, Spearman correlation in peripheral CAR T cell expansion between flow cytometry and qPCR assays (n = 31 patients, 109 observations). f, CAR T cell AUC0–28 for patients in CR or PD at 6 months (n = 29; patients 042 and 058 had PR and SD at 6 months, patient 032 died from a non-progression related cause prior to 6 months). g, CAR T AUC0–28 stratified by the maximum ICANS grade: 0–1 vs. 2–4 (n = 31; no AUC0–28 data collected for patient 058). Boxplots in (f,g) show quartiles with a band at median, whiskers indicating 1.5 interquartile range (IQR), and all observations overlaid as dots. P-values are from two-sided Mann-Whitney U test.
Fig. 2.
Fig. 2.. CyTOF identifies metaclusters of circulating CAR T cells associated with long-term clinical response or neurotoxicity.
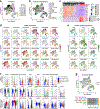
a, CyTOF panel covering 34 proteins. Quality control channels are not shown. b, Minimum spanning tree (MST) showing hierarchical consensus clustering of circulating CAR+ T cells on day 7 following axi-cel infusion (n = 31 patients), with 25 clusters grouped automatically into 10 metaclusters. No CyTOF data were obtained for patient 038. c, Star plot showing MST from (b), with each cluster size scaled to represent its average abundance and colors indicating expression of each marker used for clustering. d, Schematic for building a lasso model to predict clinical response as CR or PD at 6 months based on metacluster abundance from (c). e, Cross-validation results for model from (d), with red lines showing optimal model parameters. f, Relative abundance and b coefficients of 3 metaclusters selected by the lasso model for patients in CR or PD at 6 months (n = 28). g, Expression of 8 proteins overlaid onto MST from (c). h, Schematic for building a lasso model to predict maximum ICANS grade as 0–1 vs. 2–4 based on metaclusters from (c). i, Lasso cross-validation results for the model in (h), with red lines showing optimal model parameters. j, Relative abundance and β coefficients of 2 metaclusters selected by the lasso model in (h) (n = 31 patients). Boxplots in (f,j) show quartiles with a band at median, whiskers indicating 1.5 IQR, and all observations overlaid as dots.
Fig. 3.
Fig. 3.. Helios-expressing population of circulating CD4+ CAR T cells on day 7 is associated with clinical progression and reduced neurotoxicity.
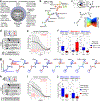
a, Gates defined based on 3 metaclusters identified by the lasso model for predicting clinical response (Fig. 2f). Contour plots show CyTOF data for CAR+ T cells on day 7 from patients 008 (CR at 6 months) and 017 (PD at 6 months). b, Summary statistics for 3 populations as defined in (a) for patients in CR or PD at 6 months (n = 28). Dotted lines indicate separation between high and low percentages of CAR T cells in each population, with the thresholds selected based on the optimal response separation between the groups. c, Kaplan-Meier analysis of time to progression (TTP) stratified by high vs. low percentage of CAR T cells in each population, as shown in (b) (n = 28). Since clinical outcome was known during patient stratification, P-values need to be interpreted with caution. d, Gate from (a) defined based on metacluster 4 identified by the lasso model for predicting severe neurotoxicity (Fig. 2j). Contour plots show CyTOF data for CAR+ T cells on day 7 from patients 042 (max ICANS grade 0) and 050 (max ICANS grade 3). e, Percentage of circulating CD57 Helios+ cells among CD4+ CAR T cells on day 7 stratified by maximum ICANS grade (n = 31). f, Percentage of CD57+ T-bet+ cells among CD4+ (left) and CD8+ (right) CAR T cells on day 7 for patients with maximum ICANS grade 0–1 or 2–4 (n = 31). Boxplots in (b,e,f) show quartiles with a band at median, whiskers indicating 1.5 IQR, and all observations overlaid as dots. P-values are from two-sided Mann-Whitney U test.
Fig. 4.
Fig. 4.. CD4+ CD57 Helios+ CAR T cells express FOXP3 and are not cytotoxic.
Cryopreserved PMBCs from the patient cohort (day 7 after axi-cel infusion; n = 27) were incubated with either PMA and ionomycin, or plate-bound anti-idiotype antibody for 6 hours and analyzed by flow cytometry. a, Top: Contour plots show three identified populations among CAR+ T cells from patients 017 and 050. Bottom: Percent of cells from each population falling into the FOXP3+ CD25High TReg gate. b-c, Summary statistics for CAR+ T cells falling into TReg, GZMB+, or IL-2+ gates and surface CD107a MFI following stimulation with PMA and ionomycin (b) or plate-bound anti-idiotype antibody (c). Boxplots show quartiles with a band at median, whiskers indicating 1.5 IQR, and all observations overlaid as dots. P-values are from the Friedman test, followed by pairwise two-sided Wilcoxon signed-rank tests with Bonferroni correction to adjust for multiple hypothesis testing.
Fig. 5.
Fig. 5.. Deep phenotyping with single-cell sequencing upholds TReg identity of CD4+ CD57 Helios+ CAR T cells.
a, CAR+ T cells were sorted from 9 LBCL patients on day 7 following axi-cel infusion and analyzed by scRNA-seq, scTCR-seq, and CITE-seq. b Left: Contour plot and schematic show definitions of the 3 identified CAR T cell populations. Right: Identities of CAR T cell populations projected onto the weighted nearest neighbor UMAP (wnnUMAP) coordinates based on scRNA-seq and CITE-seq data (n = 6,316 cells). c, Expression of selected genes overlaid onto the wnnUMAP coordinates from (b). Protein encoded by each gene is shown in parentheses. d, Surface expression of selected proteins and CD57 (carbohydrate epitope) overlaid onto the wnnUMAP coordinates from (b). e, Indicated CAR T cell subsets highlighted in red on the wnnUMAP coordinates from (b). f, Volcano plot showing differentially expressed genes (left) and dot plot showing the top 10 differentially regulated pathways (right) comparing CD4+ CD57 Helios+ to CD4+ CD57+ T-bet+ and CD8+ CD57+ T-bet+ CAR T cell populations (n = 952 cells). Differentially upregulated genes and pathways are in red; downregulated genes and pathways are in blue; genes used to define each population and pathways with genes both up and downregulated are in black. g, Violin plots showing selected gene and surface protein expression in populations defined in (b) (n = 6,316 cells). Stars denote significant (P < 0.05) upregulation in the indicated population relative to all populations without stars. Other significant relationships are not denoted. h, TCR clonal expansion overlaid onto the wnnUMAP coordinates from (b) (left) and shown as a boxplot for each CAR T cell population (right). P-values in (g,h) were calculated using Kruskal-Wallis H test, followed by unpaired two-sided Wilcoxon-Mann Whitney U test applied to each treatment pair, with Bonferroni correction for multiple hypothesis testing.
Fig. 6.
Fig. 6.. CAR TReg cells and tumor burden surrogate identify patients with clinical progression.
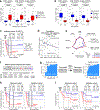
a-b, Percentage of indicated populations among CD4+ CAR T cells in blood on day 7 post-infusion in patients from the validation cohort (n = 23), separated by response at 6 month (a) or maximum ICANS grade (b). Boxplots show quartiles with a band at median, whiskers indicating 1.5 IQR, and all observations overlaid as dots. P-values are from two-sided Mann-Whitney U test. (c) Kaplan-Meier analysis of TTP stratified by high vs. low percentage of CD57 Helios+ population among CD4+ (TReg-like) CAR T cells using the threshold from the discovery cohort (Fig. 3c) (n = 23). d, Pearson correlation between percentage of CAR TReg cells and log10 AUC0–28 expansion of CD8+ CAR T cells (n = 54). P-value is from the correlation test. e, Radar plot showing mean values for all patients in CR or PD at 6 months (n = 64). Each axis starts at 0 and ends at the maximum value observed. f, Logistic regression model for predicting response at 6 months based on two parameters: percent of CAR TReg cells and whether pre-LD LDH levels were above normal. Model was fit using the discovery cohort (n = 28), with parameters shown below the formula. Variance inflation factor (VIF) ≥5 indicates severe multicollinearity. g, Performance of the model from (f) on discovery (n = 28) and validation (n = 23) cohorts. AUROC, area under the receiver operating characteristic. h-I, Kaplan-Meier analysis of TTP (h) and OS (i) stratified by high vs. low risk using the model from (f) in cohorts from (g).

Comment in

References

    1. Abramson JS, et al. Lisocabtagene maraleucel for patients with relapsed or refractory large B cell lymphomas (TRANSCEND NHL 001): a multicentre seamless design study. Lancet 396, 839–852 (2020). - PubMed
    1. Schuster SJ, et al. Tisagenlecleucel in Adult Relapsed or Refractory Diffuse Large B cell Lymphoma. N Engl J Med 380, 45–56 (2019). - PubMed
    1. Neelapu SS, et al. Axicabtagene Ciloleucel CAR T cell Therapy in Refractory Large B cell Lymphoma. N Engl J Med 377, 2531–2544 (2017). - PMC - PubMed
    1. Maude SL, et al. Tisagenlecleucel in Children and Young Adults with B cell Lymphoblastic Leukemia. N Engl J Med 378, 439–448 (2018). - PMC - PubMed
    1. Nastoupil LJ, et al. Standard-of-Care Axicabtagene Ciloleucel for Relapsed or Refractory Large B cell Lymphoma: Results From the US Lymphoma CAR T Consortium. J Clin Oncol 38, 3119–3128 (2020). - PMC - PubMed

References (Methods only)

    1. Cheson BD, et al. Recommendations for initial evaluation, staging, and response assessment of Hodgkin and non-Hodgkin lymphoma: the Lugano classification. J Clin Oncol 32, 3059–3068 (2014). - PMC - PubMed
    1. Lee DW, et al. Current concepts in the diagnosis and management of cytokine release syndrome. Blood 124, 188–195 (2014). - PMC - PubMed
    1. Long AH, et al. 4–1BB costimulation ameliorates T cell exhaustion induced by tonic signaling of chimeric antigen receptors. Nat Med 21, 581–590 (2015). - PMC - PubMed
    1. Fienberg HG, Simonds EF, Fantl WJ, Nolan GP & Bodenmiller B. A platinum-based covalent viability reagent for single-cell mass cytometry. Cytometry. Part A : the journal of the International Society for Analytical Cytology 81, 467–475 (2012). - PMC - PubMed
    1. Zunder ER, et al. Palladium-based mass tag cell barcoding with a doublet-filtering scheme and single-cell deconvolution algorithm. Nat Protoc 10, 316–333 (2015). - PMC - PubMed

Publication types