. 2022 Sep 12;13(1):5344.
doi: 10.1038/s41467-022-33101-6.

Integrated Pockels laser

Affiliations

Integrated Pockels laser

Mingxiao Li et al. Nat Commun. .

Abstract

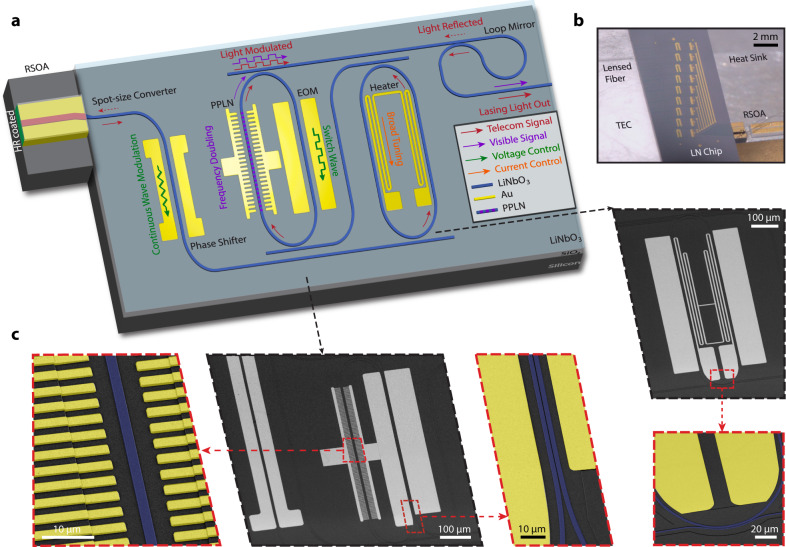
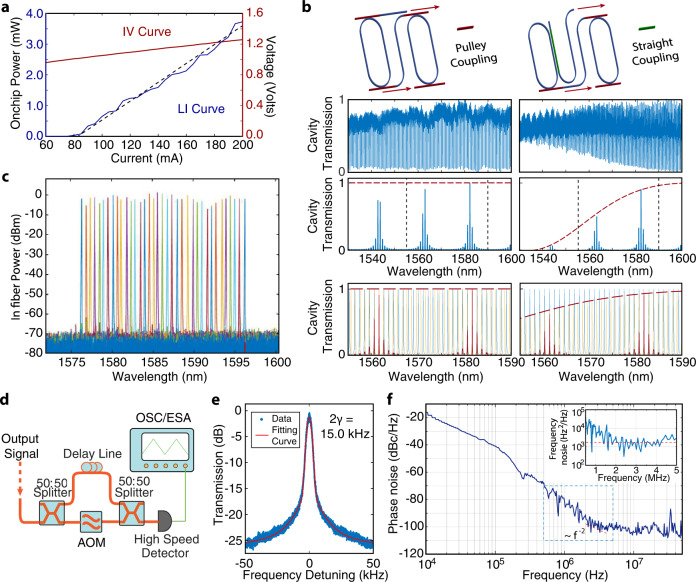
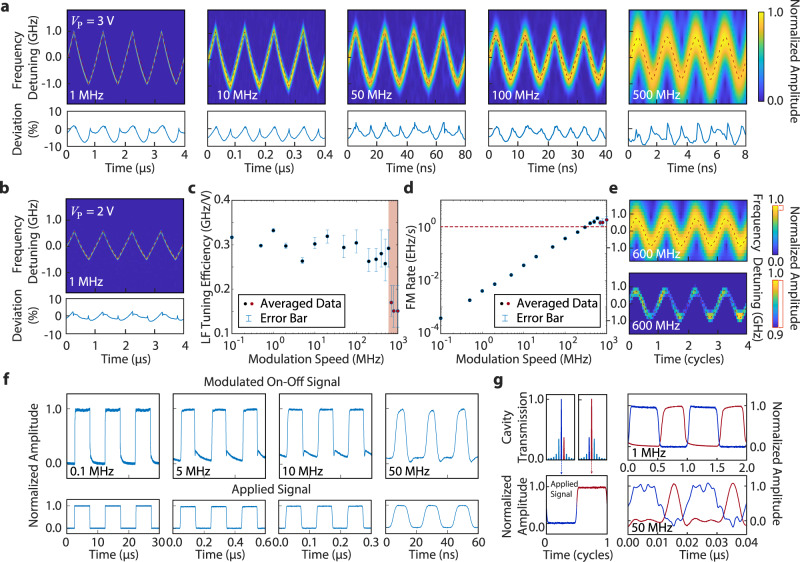
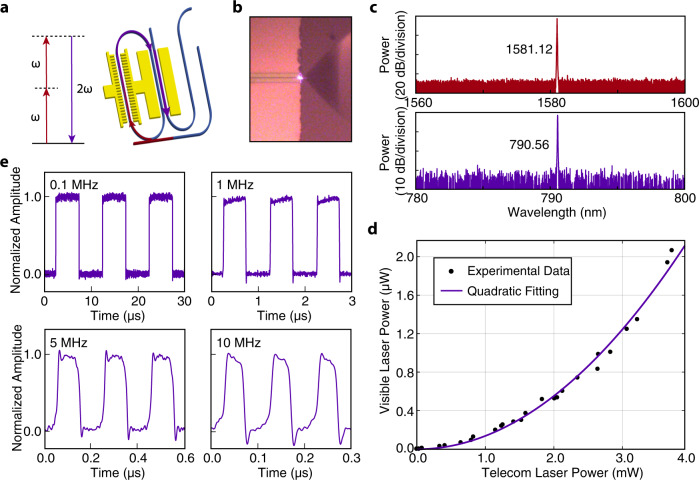
The development of integrated semiconductor lasers has miniaturized traditional bulky laser systems, enabling a wide range of photonic applications. A progression from pure III-V based lasers to III-V/external cavity structures has harnessed low-loss waveguides in different material systems, leading to significant improvements in laser coherence and stability. Despite these successes, however, key functions remain absent. In this work, we address a critical missing function by integrating the Pockels effect into a semiconductor laser. Using a hybrid integrated III-V/Lithium Niobate structure, we demonstrate several essential capabilities that have not existed in previous integrated lasers. These include a record-high frequency modulation speed of 2 exahertz/s (2.0 × 10¹⁸ Hz/s) and fast switching at 50 MHz, both of which are made possible by integration of the electro-optic effect. Moreover, the device co-lases at infrared and visible frequencies via the second-harmonic frequency conversion process, the first such integrated multi-color laser. Combined with its narrow linewidth and wide tunability, this new type of integrated laser holds promise for many applications including LiDAR, microwave photonics, atomic physics, and AR/VR.


Conflict of interest statement

The authors declare no competing interests.

Figures

Fig. 1
Fig. 1. Concept and structure of the integrated Pockels laser.
a Schematic of the hybrid integrated laser structure. b Photo of the setup with an RSOA edge coupled to the device and sitting on heat sinks. A lensed fiber couples the light out from the device. The substrate is assembled by a thermoelectric controller (TEC) for environmental temperature tuning. c Scanning electron microscope image of a fabricated device. False colors are applied to the zoomed-in figures highlighted by red dashed outlines.
Fig. 2
Fig. 2. Power, linewidth, and wavelength tuning characteristics of the laser.
a Measured LI and IV curves of the laser. b Schematic of the Vernier ring structure: the left one with pulley coupling and the right one with straight coupling replacing the output pulley bus waveguide. Second row: Measured transmission spectrum of both pulley and straight coupling. Third row: Simulated transmission spectrum of the Vernier structure output. Left: with pulley coupling applied to all ports. Right: with output port replaced by straight coupling. Red dashed lines show the power transfer limited by the coupling rate. c Thermal-optic tuning spectrum of the laser wavelength recorded by an optical spectrum analyzer. d Setup schematic of delayed self-heterodyne phase noise measurement. AOM: acoustic-optical modulator. OSC: real-time oscilloscope. ESA: electrical signal analyzer. e Noise spectrum of laser measured by sub-coherence delayed self-heterodyne measurement. The curve is fit by a combination of Lorentzian and Gaussian distribution. γ is the half width of the half maximum of Lorentzian distribution. f Noise spectra of laser measured by correlated delayed self-heterodyne measurement. The dark blue line is the phase noise signal measured by a real-time oscilloscope. The light blue line in the inset shows the frequency noise signal derived from the phase noise. A white noise floor is highlighted by the dashed red line correspondingly in both plots. The dashed rectangular box indicates the frequency range corresponding to the inset figure.
Fig. 3
Fig. 3. High-speed tuning and switching characteristics of the laser.
a Time-frequency spectrograms of the beat note between the Pockels laser and a reference diode laser, at different modulation frequencies. The red dashed lines show the triangular waveforms of the driving electrical signal (with an amplitude of VP = 3 V) (The slight waveform distortion is induced by the limited bandwidth of a RF amplifier used to boost the electrical signal. See Methods for details). The lower panel shows the deviation of signal compared to the modulating triangular ramp. b Time-frequency spectrogram of the beat note with a smaller driving voltage of VP = 2 V. c The recorded laser-frequency (LF) tuning efficiency of the laser frequency. The red shaded area indicates the frequency range beyond the photon lifetime limit of the laser cavity. The error bars indicate the processing uncertainty of STFT at high frequency caused by the measurement setup limitation. d Recorded laser frequency modulation rate. Red dashed line highlights the level of 1 EHz/s. e Time-frequency spectrogram of the beat note signal with a modulation frequency of 600 MHz and a driving voltage of VP = 3 V. The lower one shows the same spectrogram but with a zoom-in amplitude range of 90–100%. f On-off intensity switching waveform of the laser (top row) at different modulation frequencies. The corresponding driving electrical signal is shown in the bottom row, with an amplitude of VP = 3 V. g Left: Schematic shows the switching between adjacent Vernier lasing mode in red and dark blue curve with the applied electrical signal shown on the bottom. Right: Recorded waveforms of the two lasing modes, at a modulation frequency of 1 MHz and 50 MHz.
Fig. 4
Fig. 4. Performance of the dual-wavelength laser.
a Schematic of the SHG process implemented in the resonator. b Optical microscope image of the produced SHG light at the output facet of the laser chip. c Optical spectra of the fundamental-frequency lasing mode (top) and the up-converted light at the second harmonic (bottom). d Recorded power dependence between the laser outputs at the telecom wavelength and in the visible. The solid curve shows a quadratic fitting to the recorded data (solid dots). e On-off switching waveform of the SH light at different modulation frequencies.
Fig. 5
Fig. 5. Design of the spot-size converter.
a, b The simulated normalized electrical field of the mode profile from a typical RSOA gain chip and the designed converter respectively. c, d The normalized electrical field of the simulated mode profile along x- and y-directions at the center of modes as labeled with white arrows in (a, b) respectively.
Fig. 6
Fig. 6. Characterization of the linearity of laser frequency modulation.
The first row shows the recorded waveform of the electrical signal used to drive the phase shifter, together with its deviation to a perfect triangular waveform (induced by an RF amplifier) defined as Deviation 1. Because of the periodicity of the signal, Deviation 1 is fully represented within one modulation period, which is obtained by averaging it over multiple modulation periods to have a better accuracy. The periodic waveform of Deviation 1 is thus obtained by duplicating it over multiple modulation periods in time, as shown in the shaded region. The second row shows the waveform of laser frequency modulation retrieved with STFT from the recorded laser beat note. Deviation 2 shows its difference from a perfect triangular function, normalized by the peak-peak amplitude. The last row plots the difference between Deviation 2 and Deviation 1.
Fig. 7
Fig. 7. Experimental setup for high-speed tuning and switching of the laser.
a Right: Schematic of device with probes placed for high-speed characterization. Dashed lines are used to highlight the operating units. Up Left: Schematic of signal waveforms for laser frequency modulation. Top: triangular electrical signal to drive the phase shifter; middle: laser beat note; bottom: time-frequency spectrogram retrieved by the STFT. Down Left: Schematic of signal waveforms for laser-mode switching. Top: square-wave electrical signal to drive the Vernier ring resonator; Bottom: the produced waveforms at two lasing modes. STFT: short time Fourier transform. b, c Schematic of experimental setup to record the laser beat note and the laser-mode switching, respectively. ECDL: external cavity diode laser; WDM: Wavelength-division multiplexer.
Fig. 8
Fig. 8. Optical spectra of the fundamental-frequency lasing mode (top) and the up-converted light at the second harmonic (bottom).
The measured signal at different wavelength of fundamental-frequency lasing mode (top) and generated second-harmonic mode (bottom) from the same device, indicating a dual lasing bandwidth over 10 nm at visible wavelength.

References

    1. Spencer DT, et al. An optical-frequency synthesizer using integrated photonics. Nature. 2018;557:81–85. doi: 10.1038/s41586-018-0065-7. - DOI - PubMed
    1. Xiang C, et al. Laser soliton microcombs heterogeneously integrated on silicon. Science. 2021;373:99–103. doi: 10.1126/science.abh2076. - DOI - PubMed
    1. Newman ZL, et al. Architecture for the photonic integration of an optical atomic clock. Optica. 2019;6:680–685. doi: 10.1364/OPTICA.6.000680. - DOI
    1. Hall RN, Fenner GE, Kingsley JD, Soltys TJ, Carlson RO. Coherent light emission from GaAs Junctions. Phys. Rev. Lett. 1962;9:366. doi: 10.1103/PhysRevLett.9.366. - DOI
    1. Yariv, A. Quantum Electronics (3rd Ed.), (New York: Holt, Reinhart and Wilson, 1985).