. 2022 Dec;18(12):1388-1398.
doi: 10.1038/s41589-022-01098-0. Epub 2022 Sep 12.

Selective inhibitors of JAK1 targeting an isoform-restricted allosteric cysteine

Affiliations

Selective inhibitors of JAK1 targeting an isoform-restricted allosteric cysteine

Madeline E Kavanagh et al. Nat Chem Biol. 2022 Dec.

Erratum in

Abstract

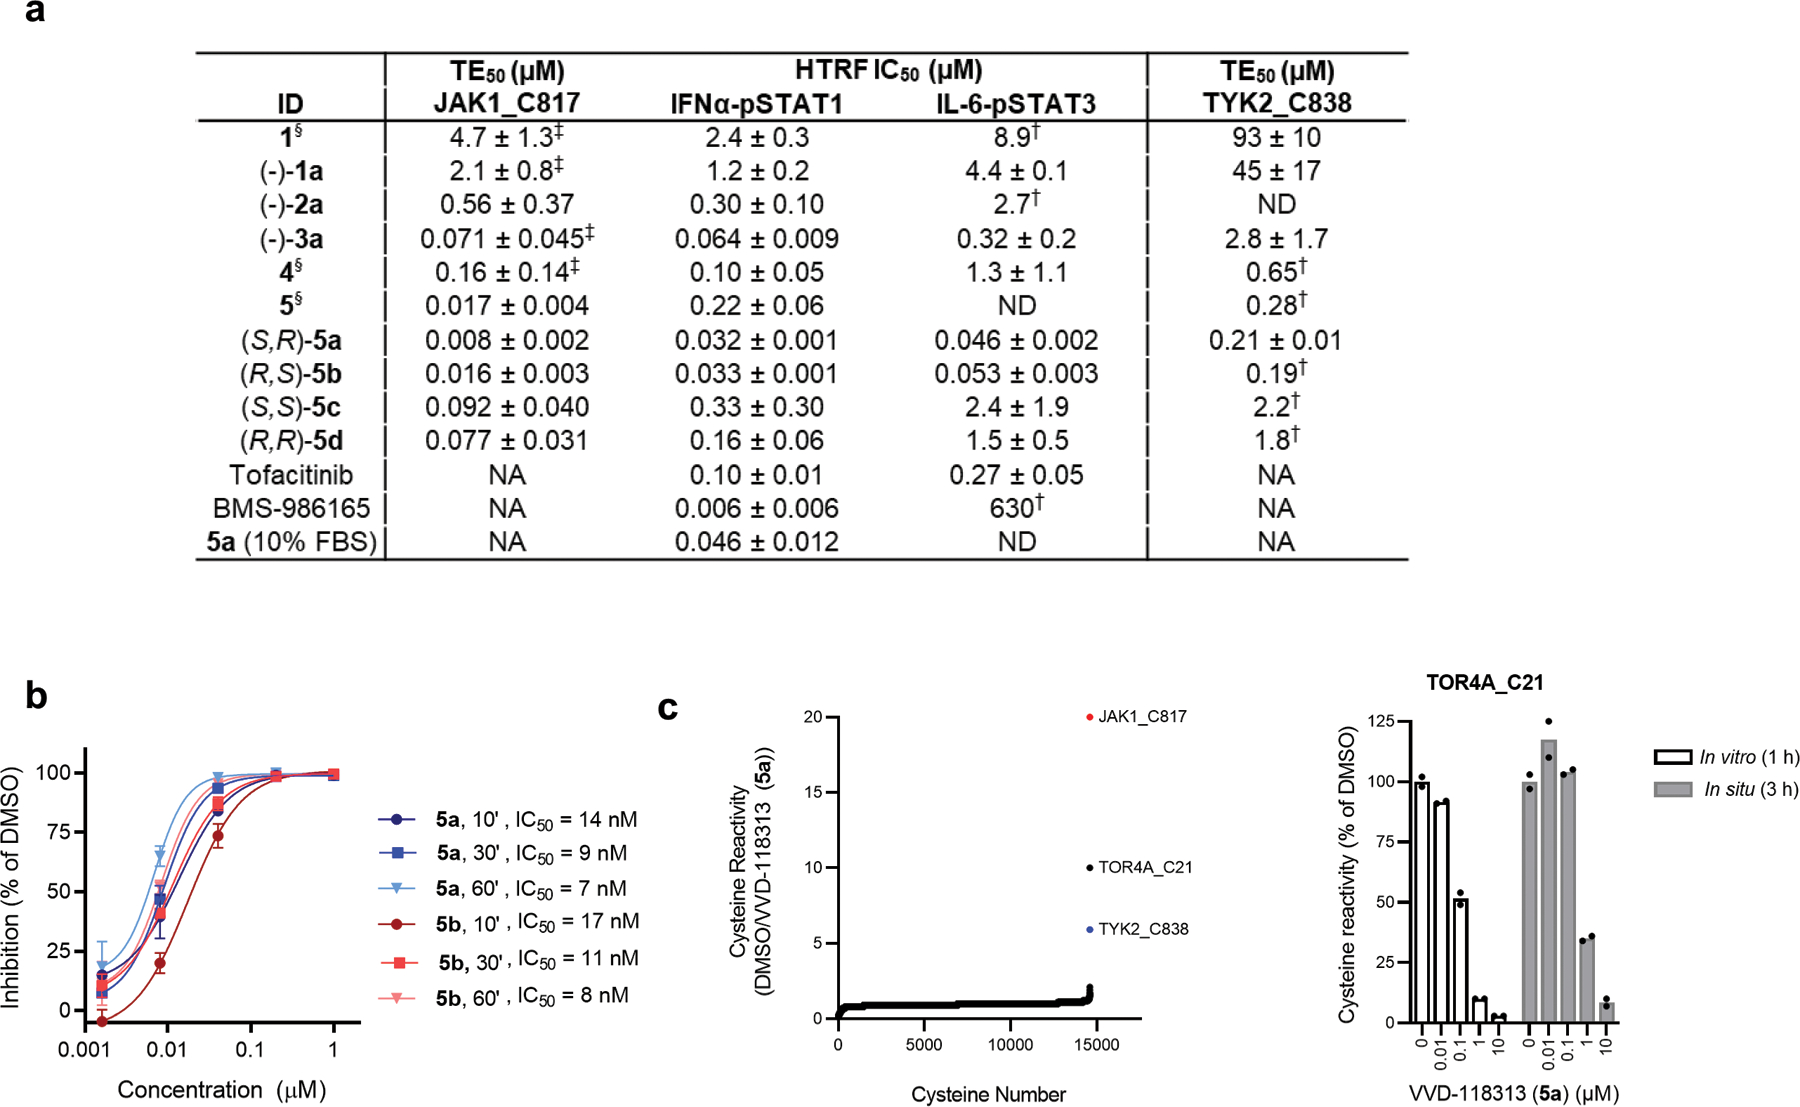
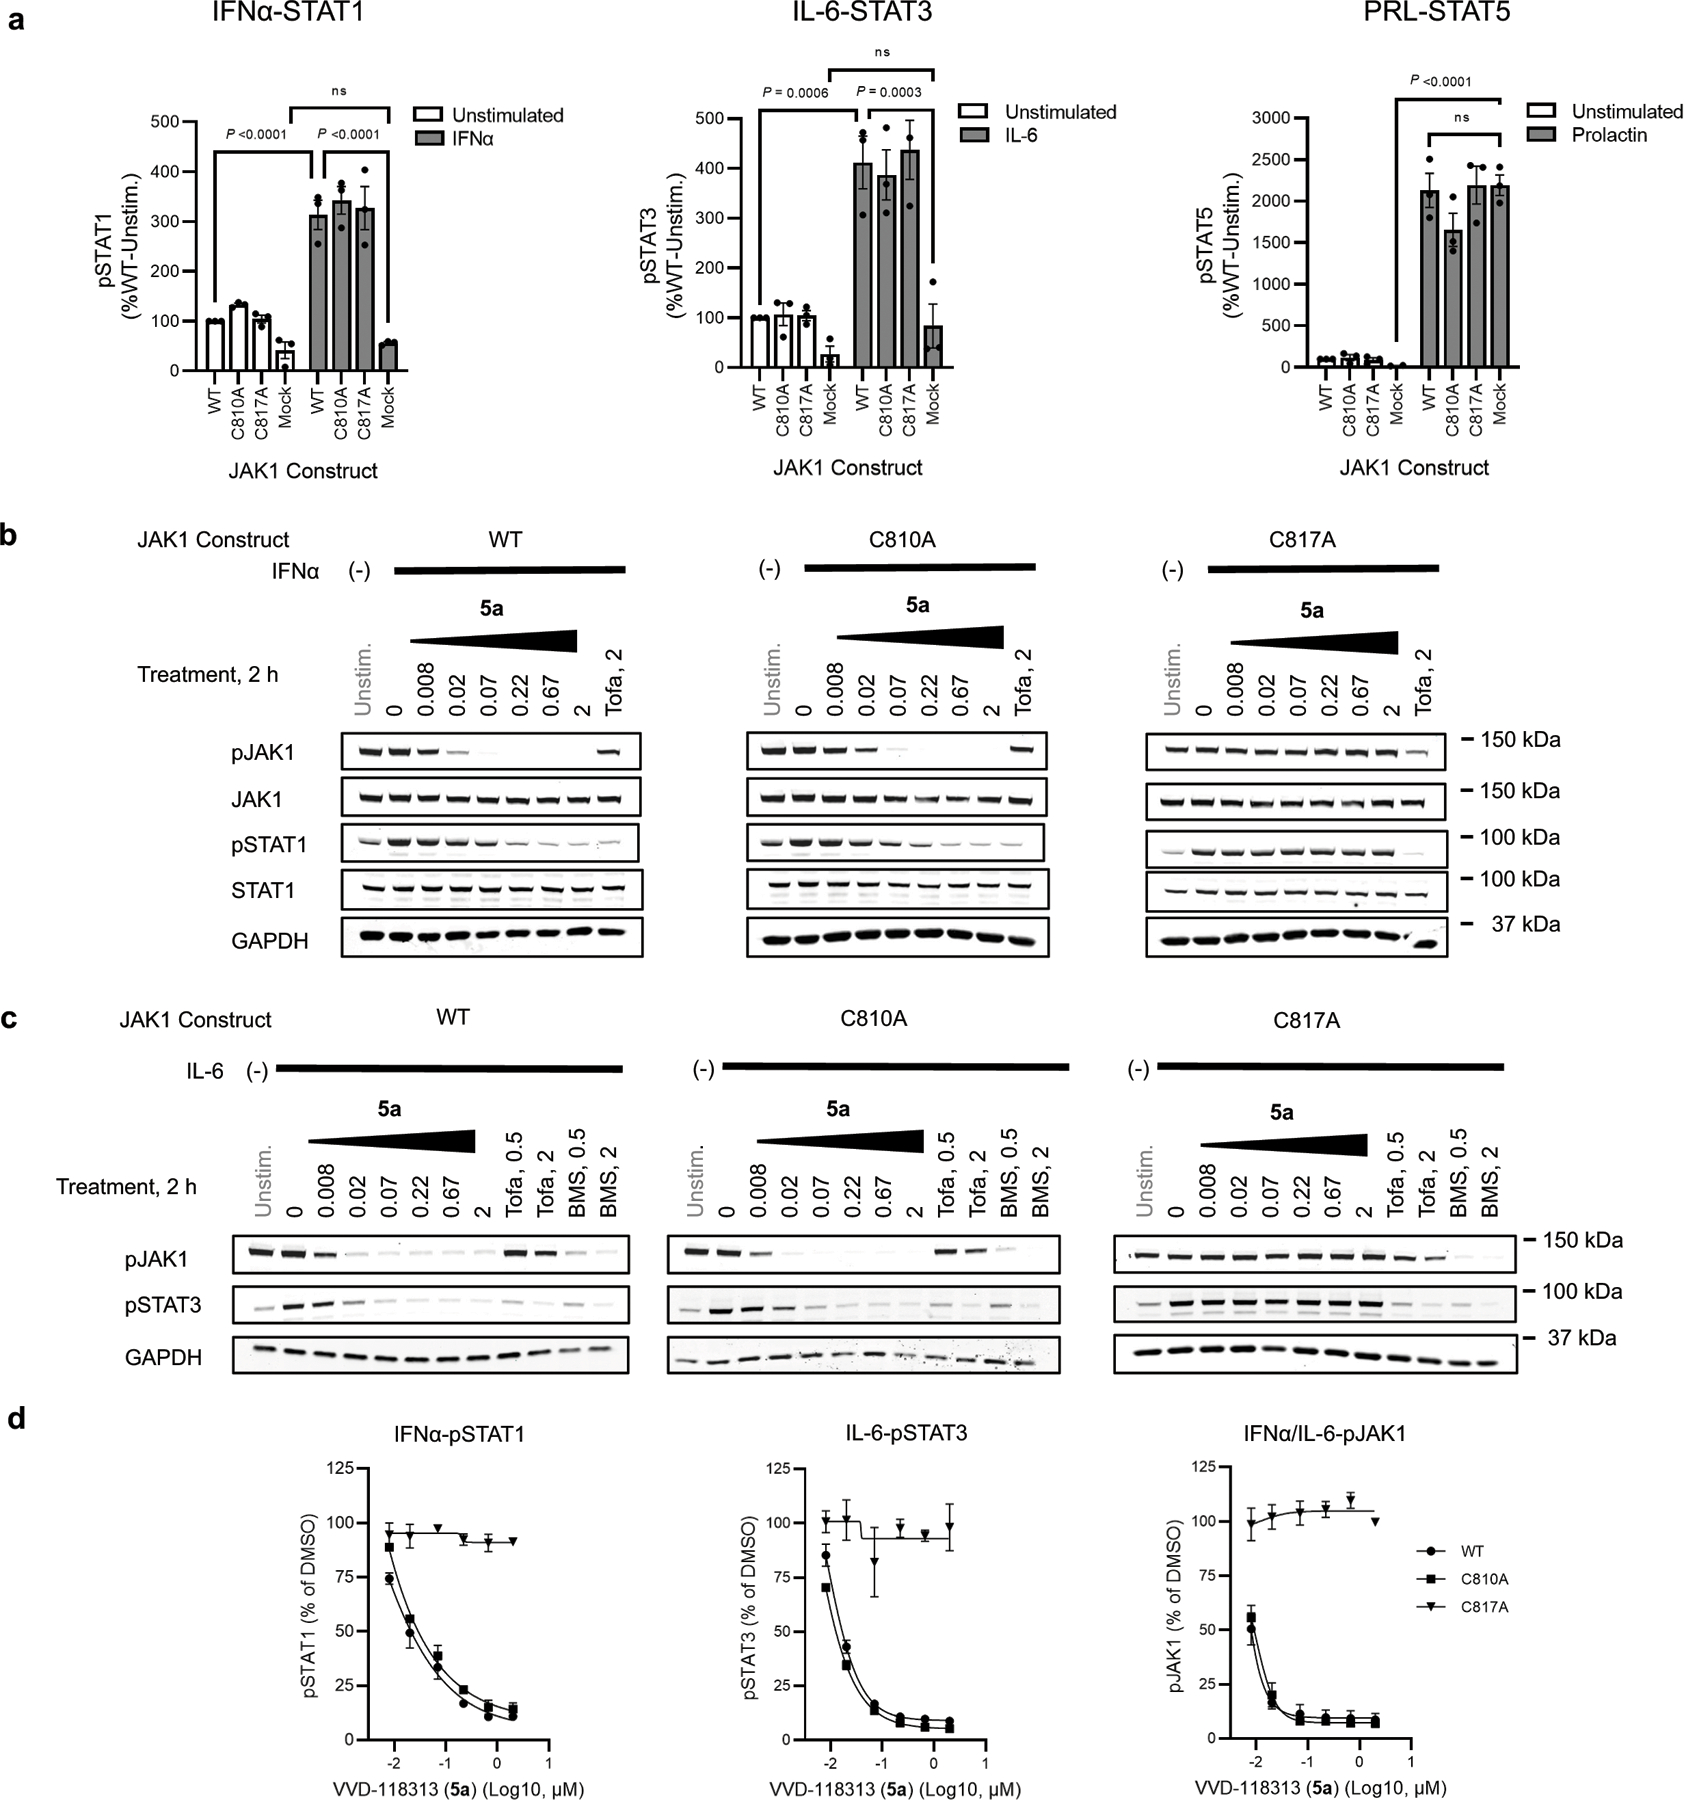
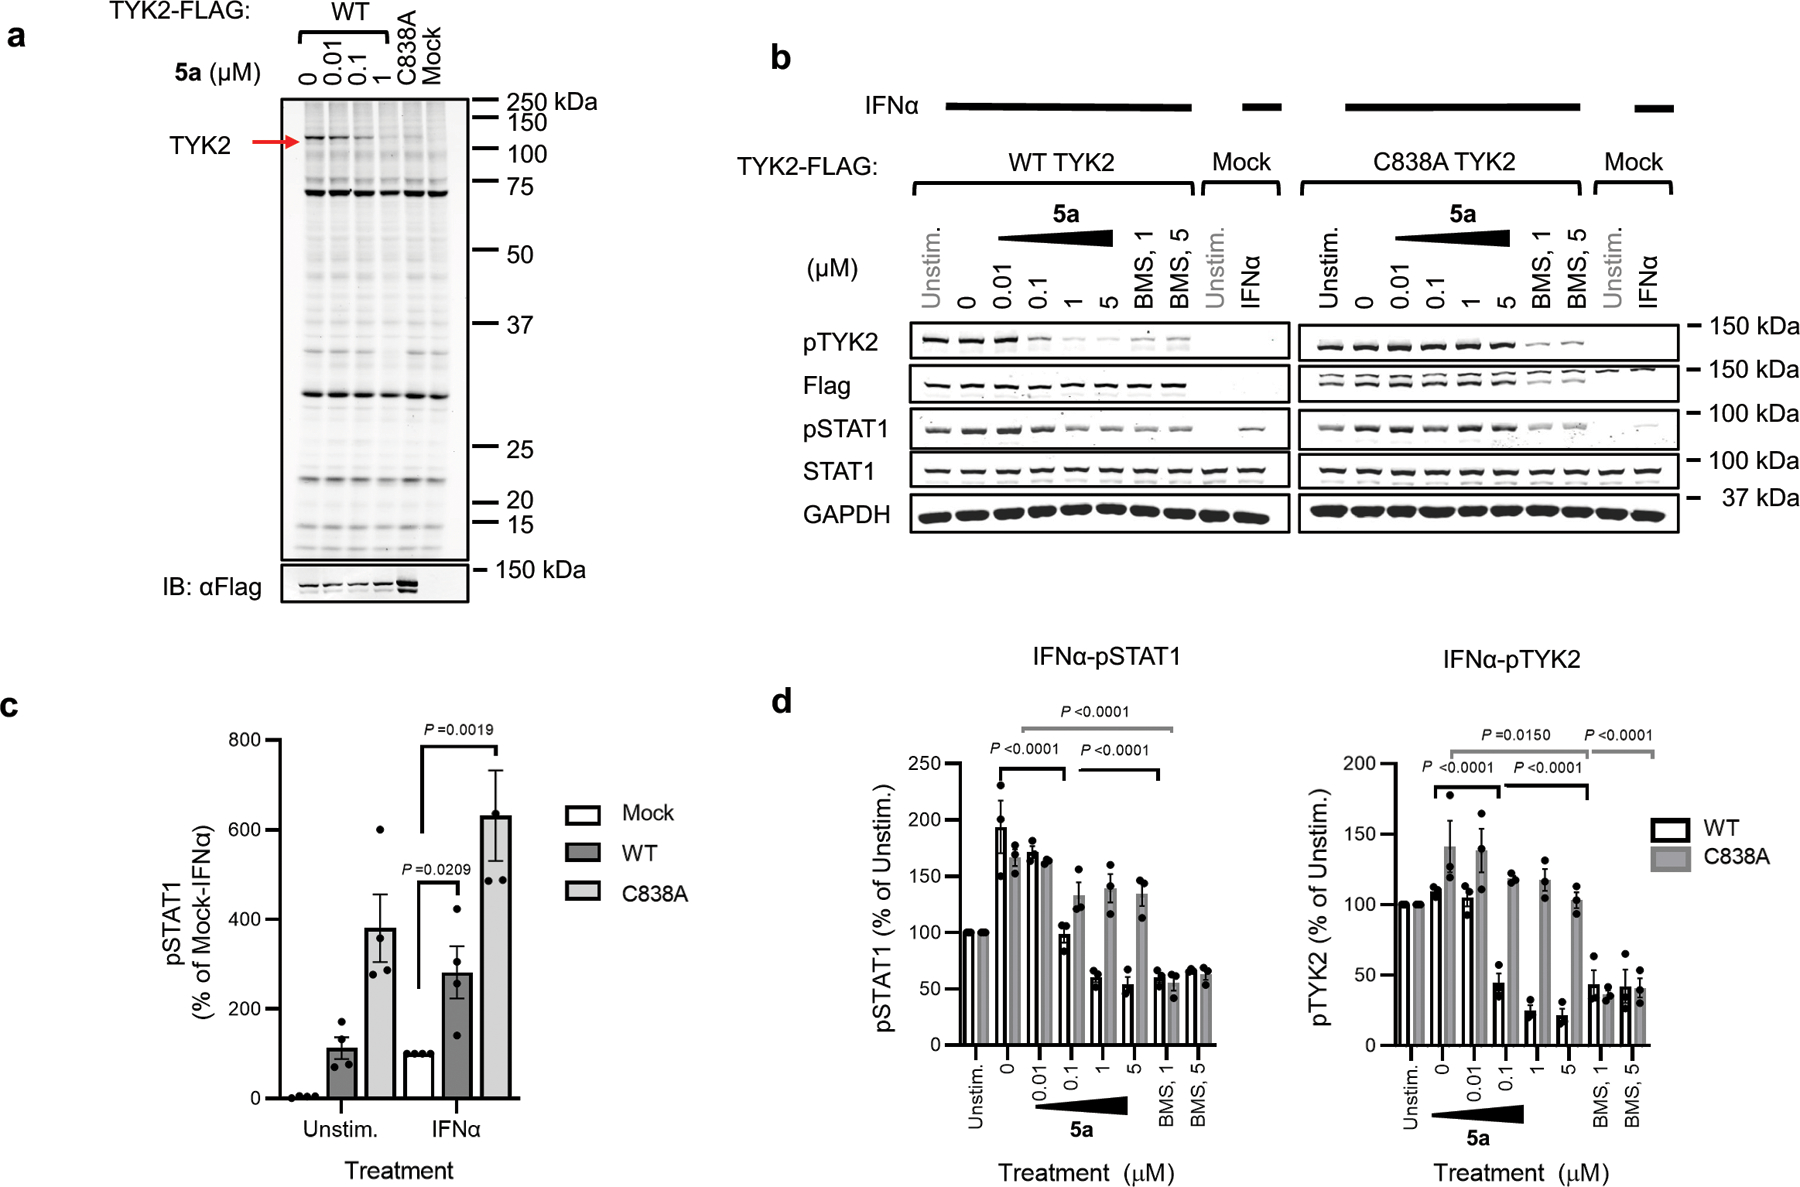
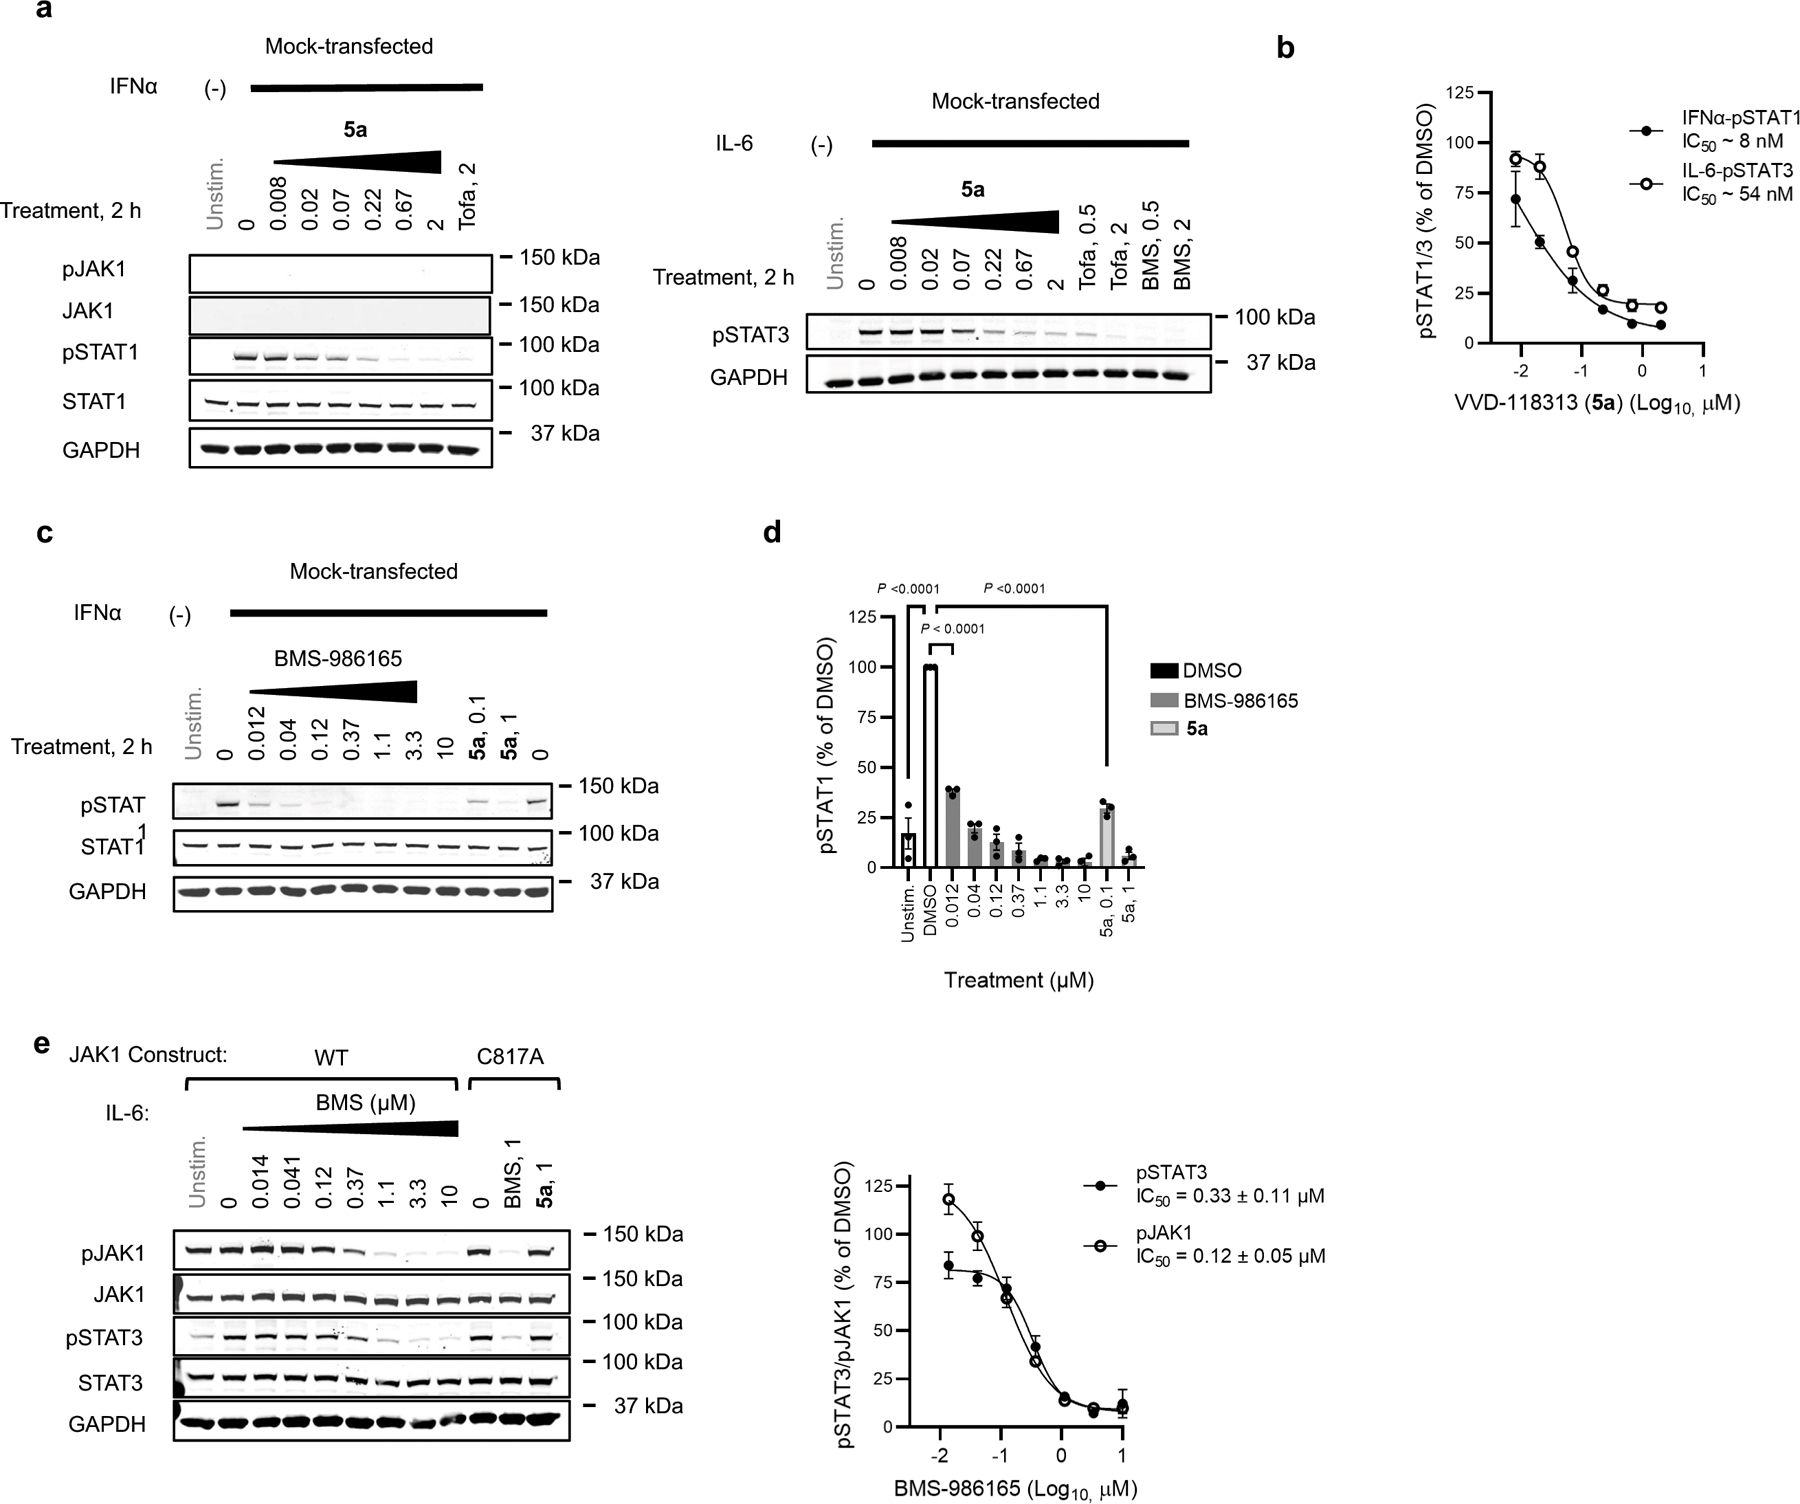
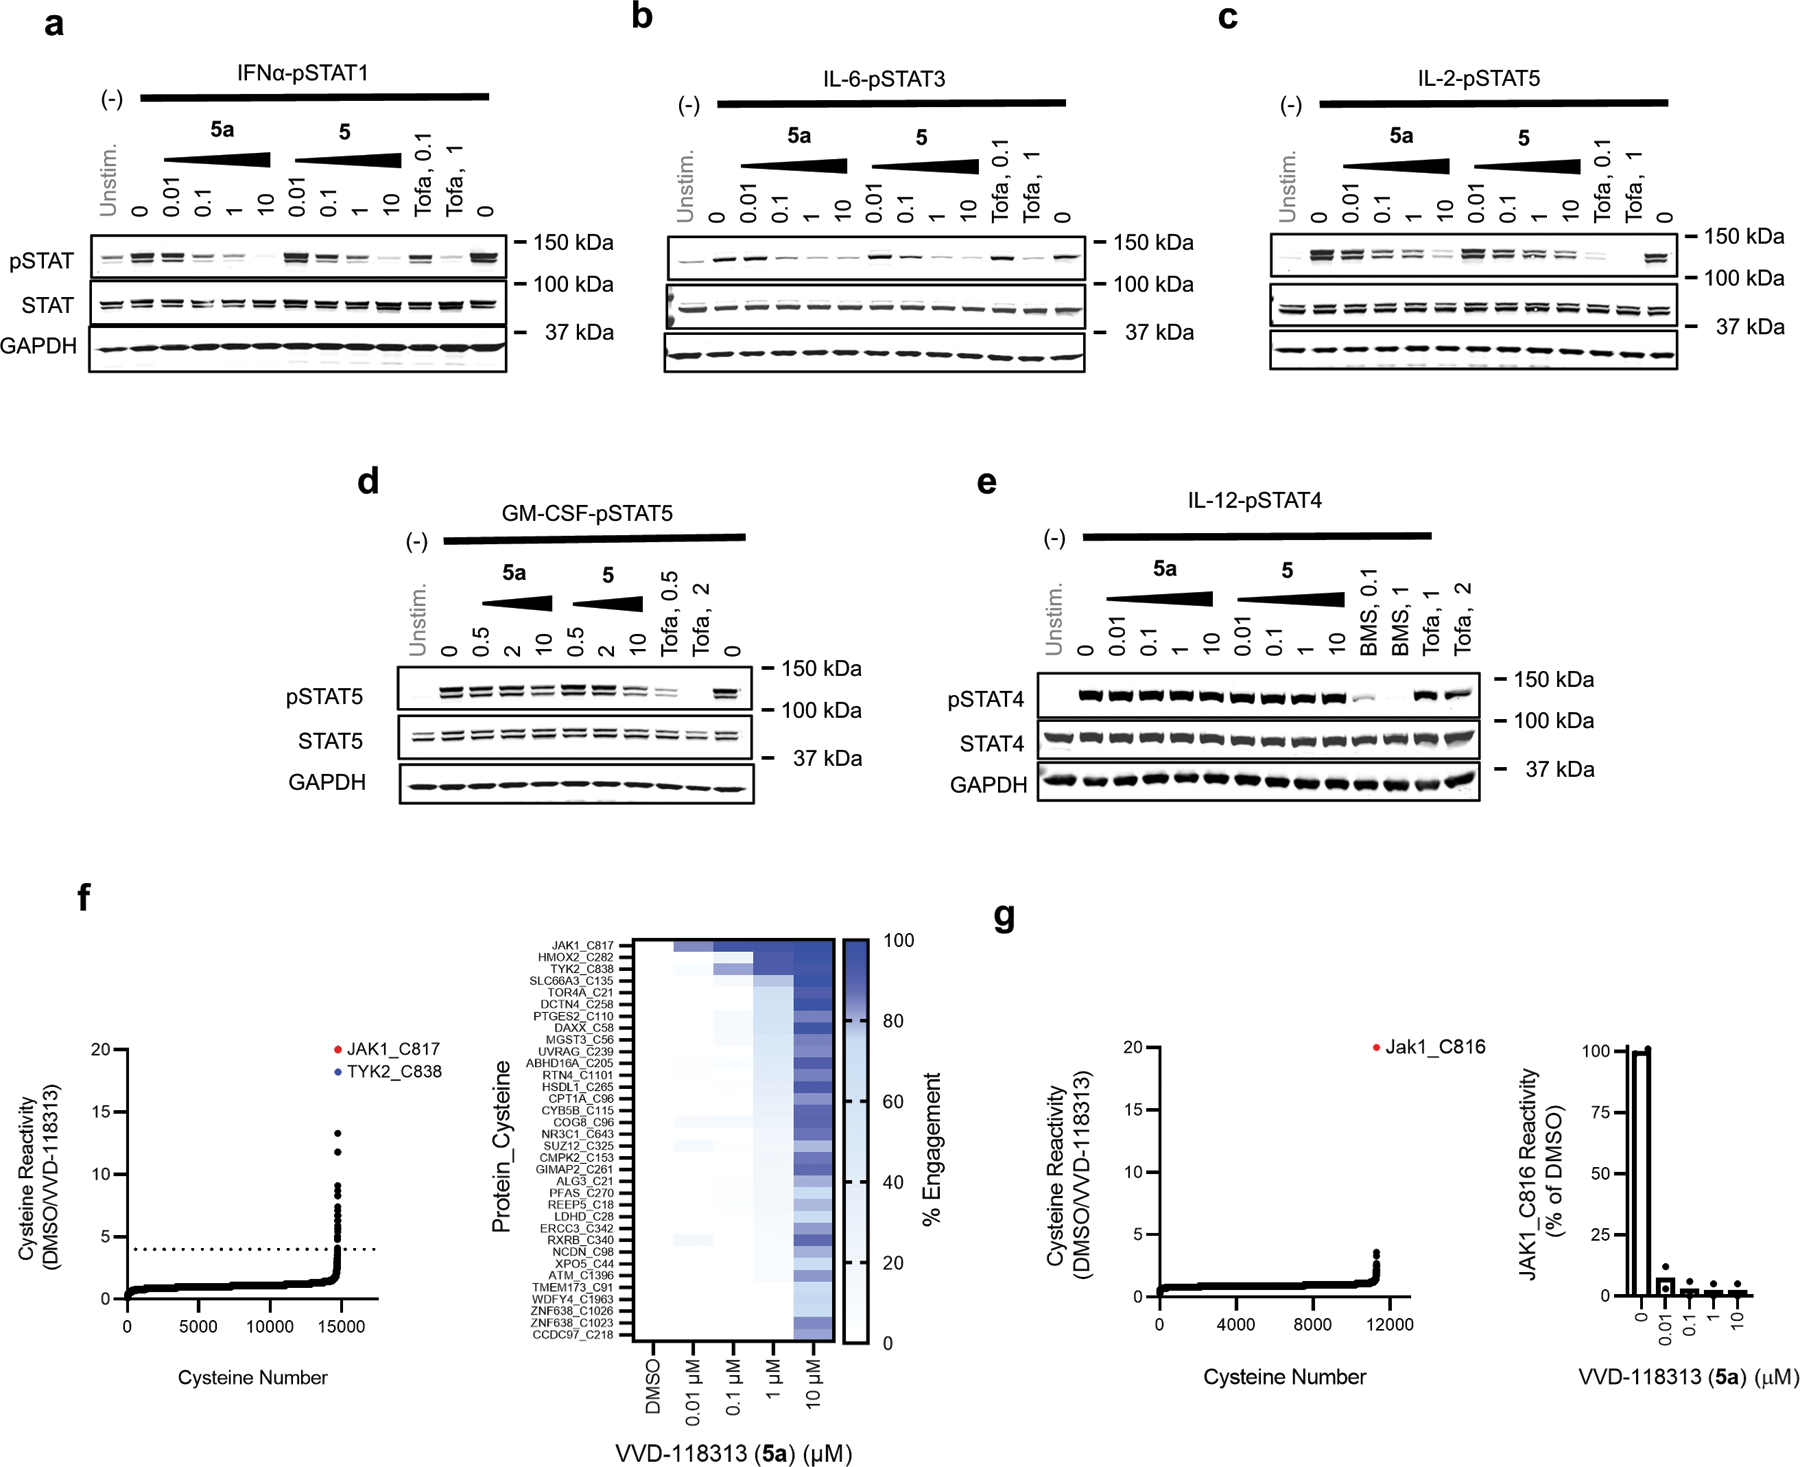
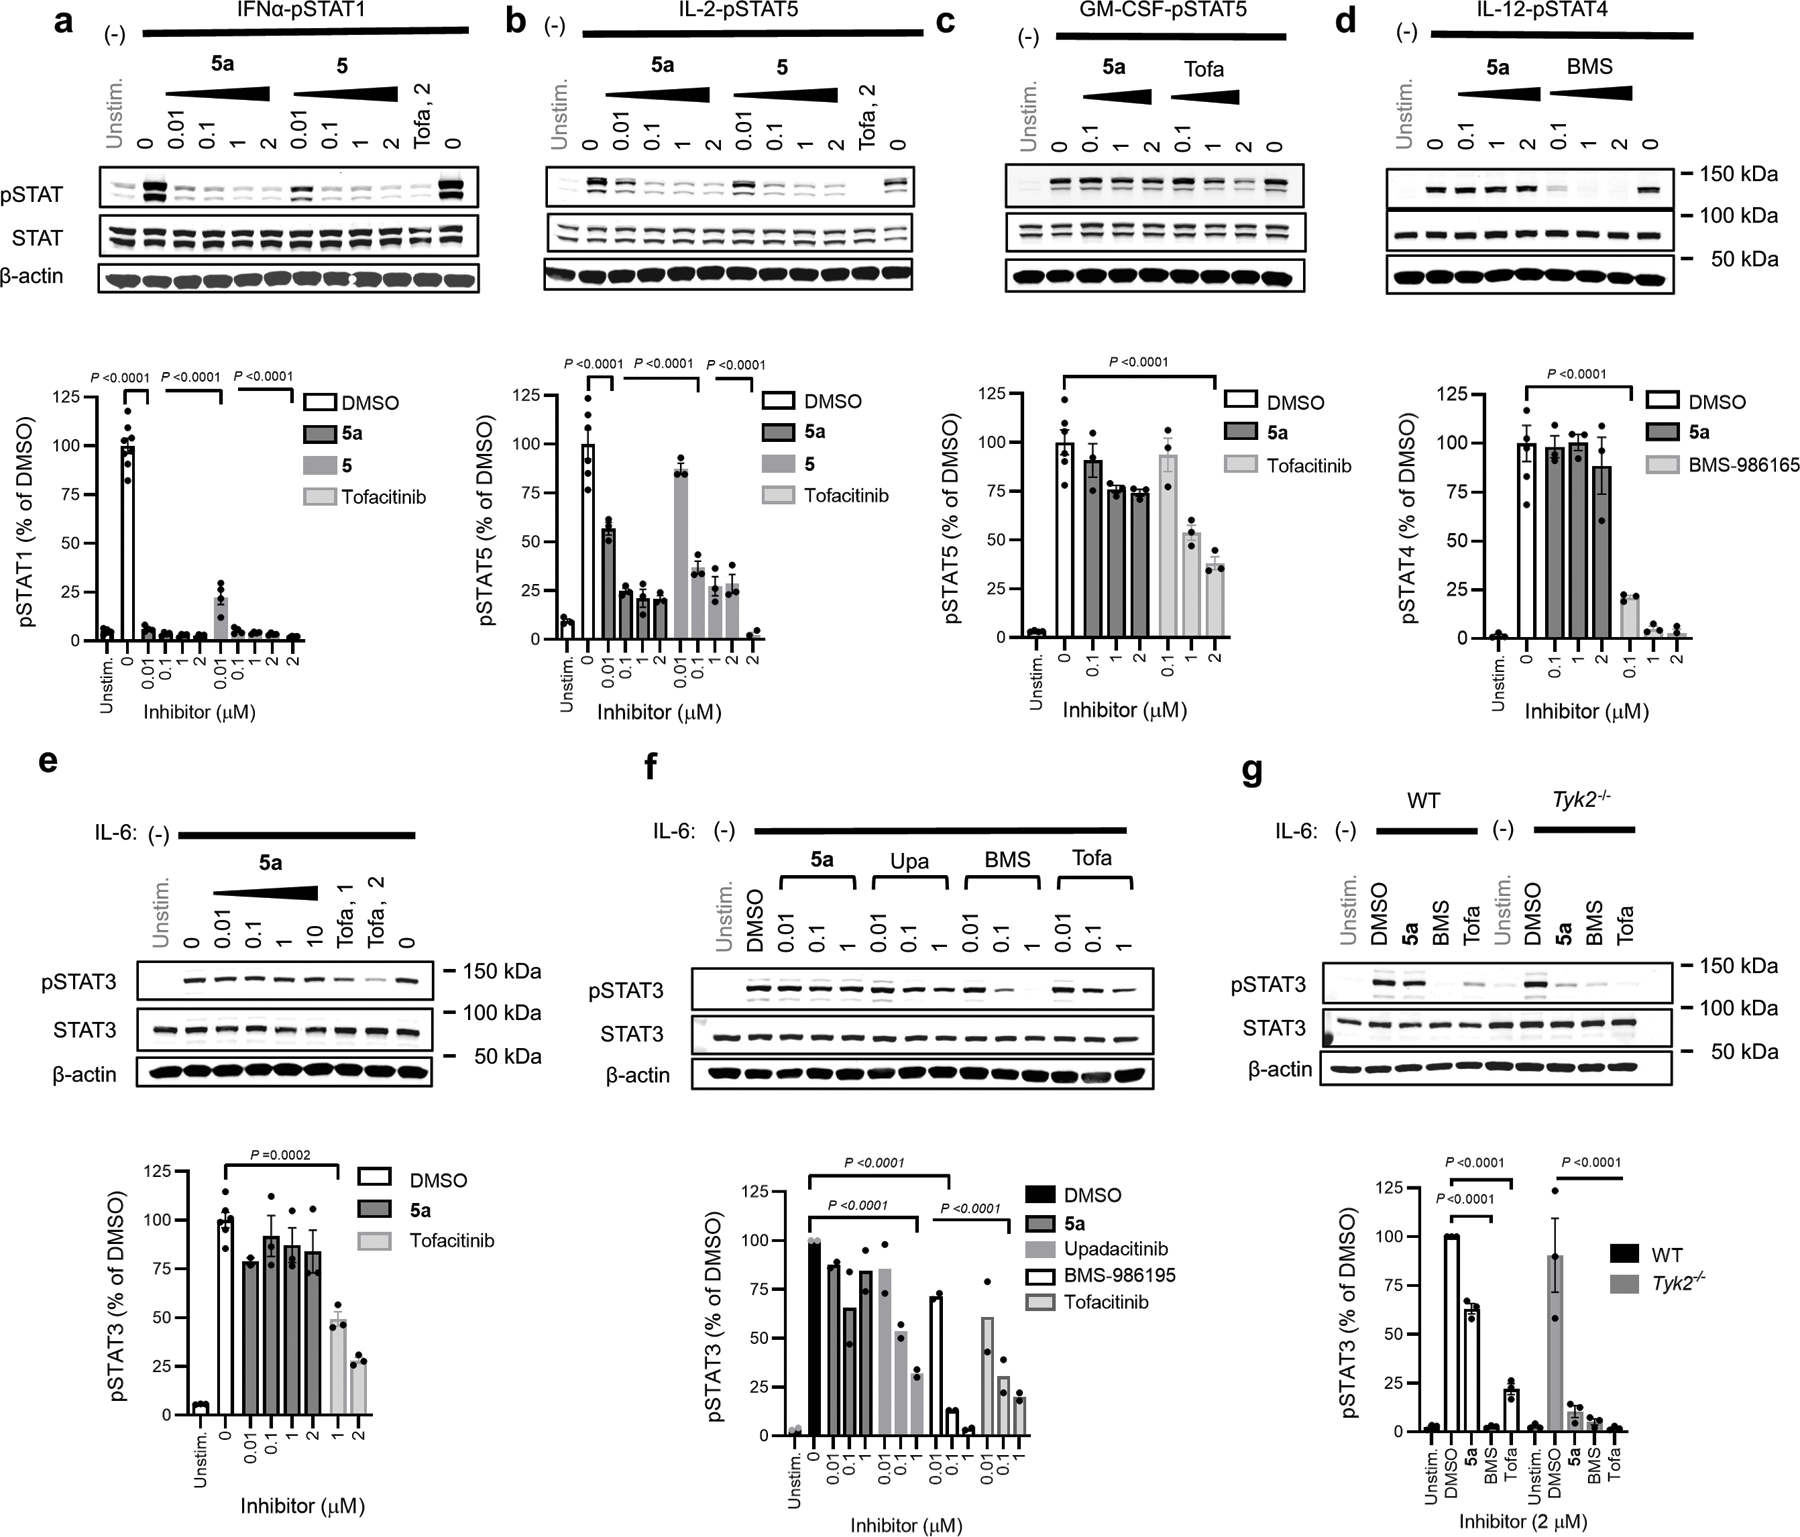
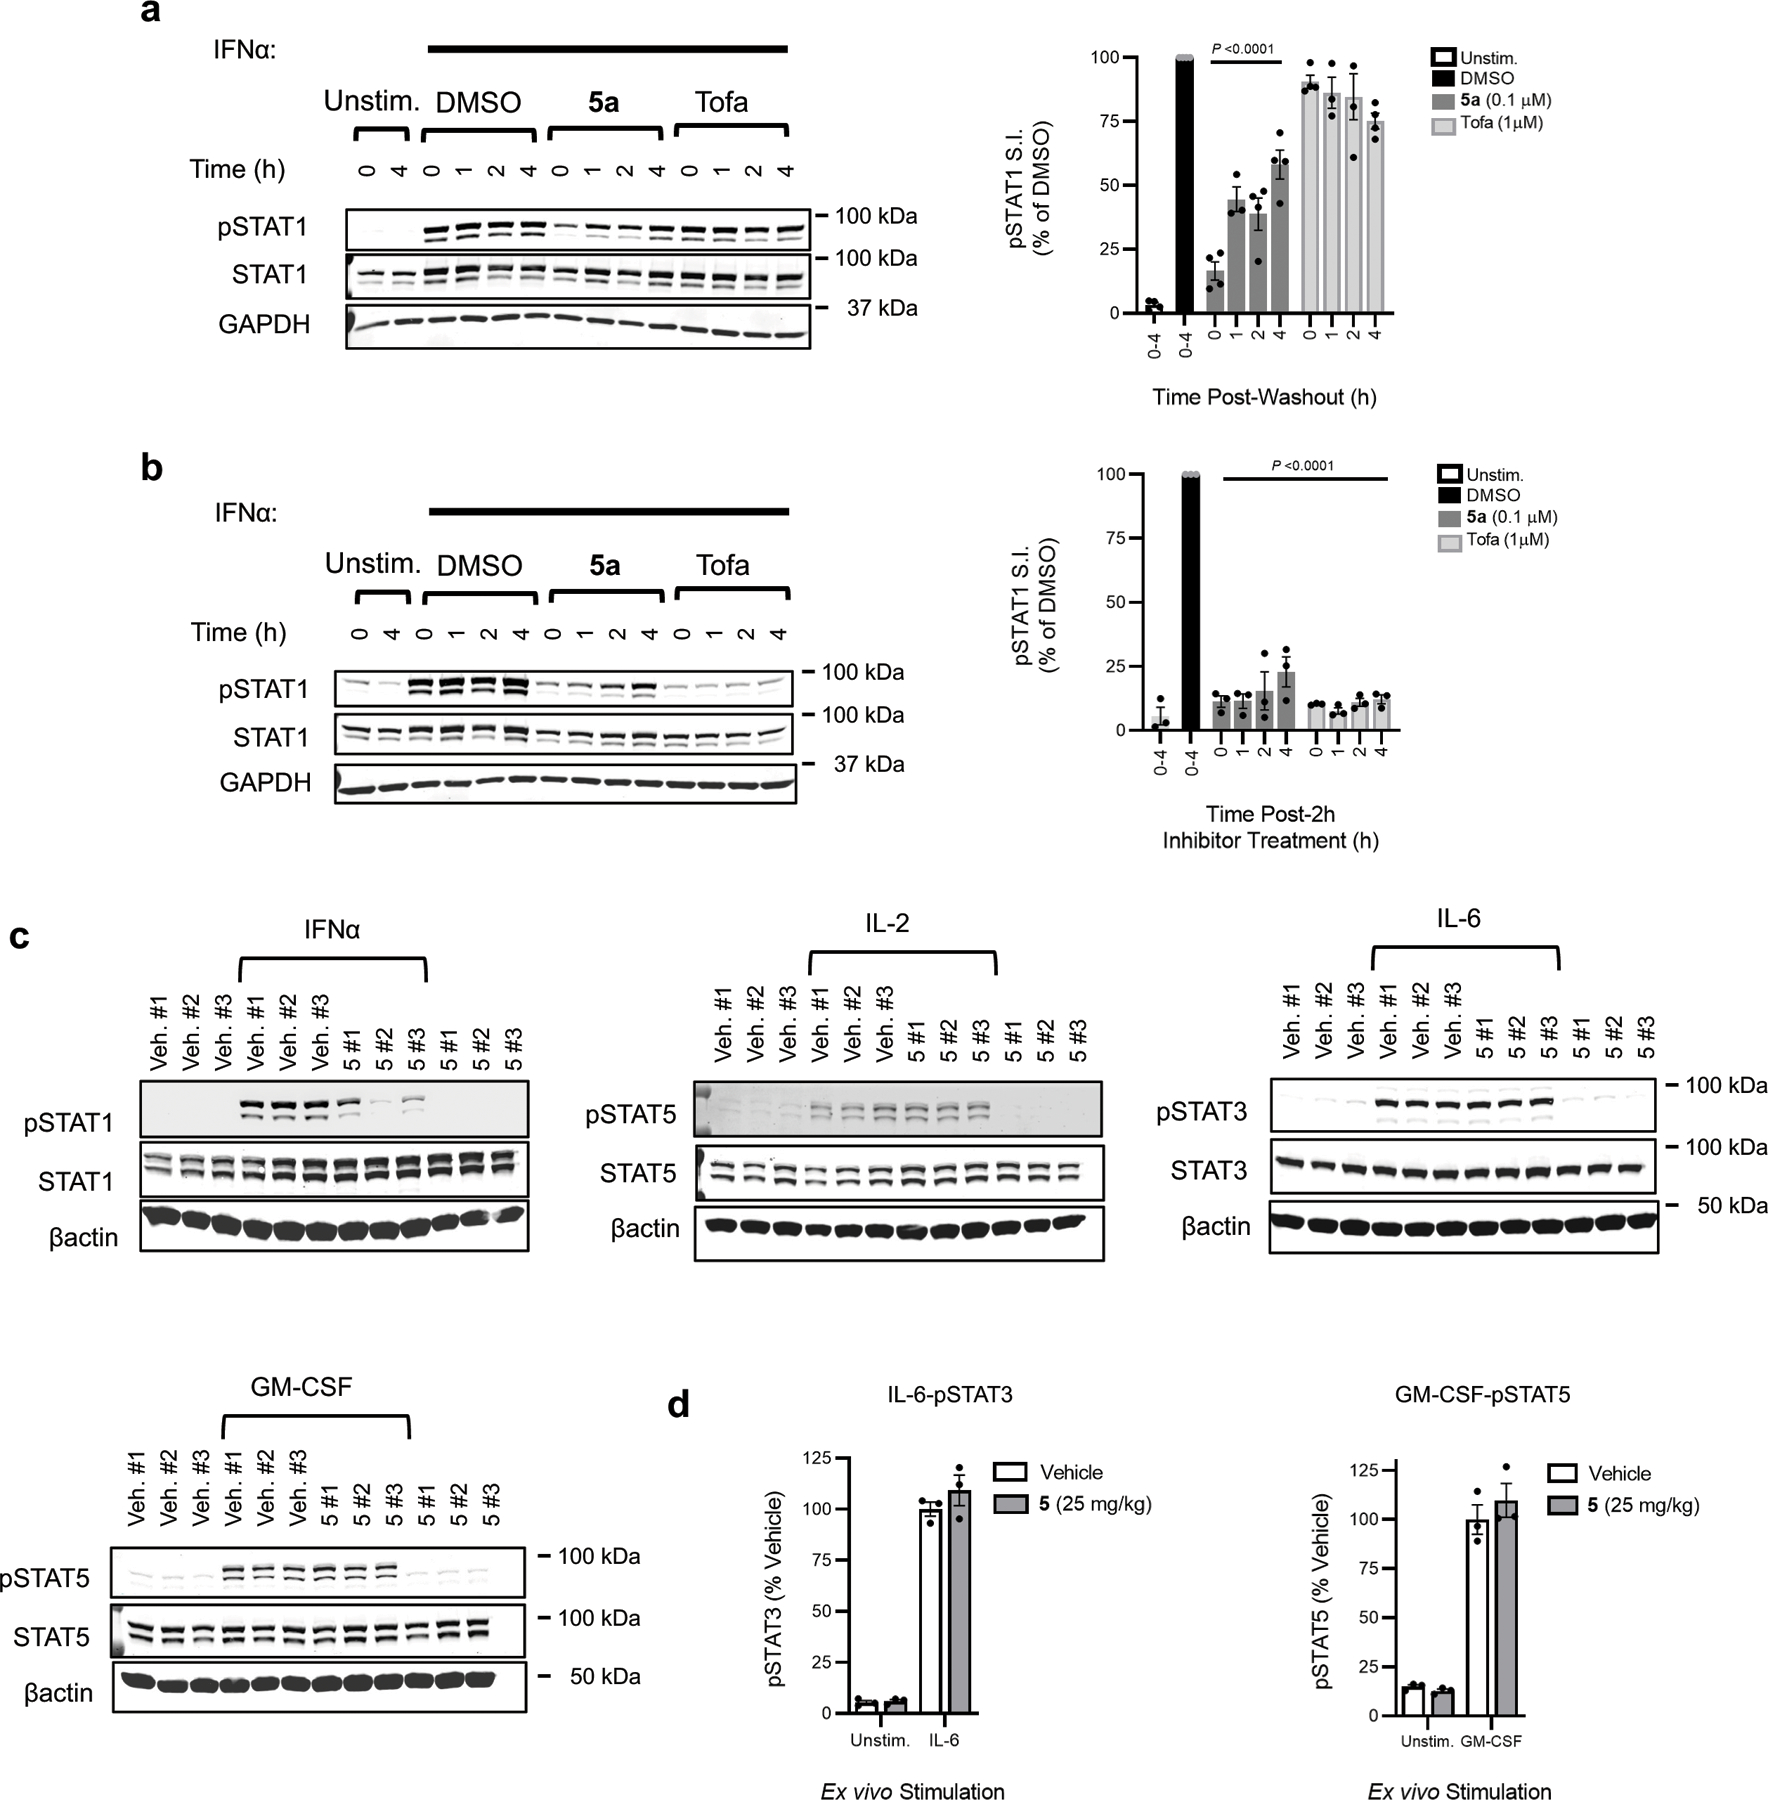
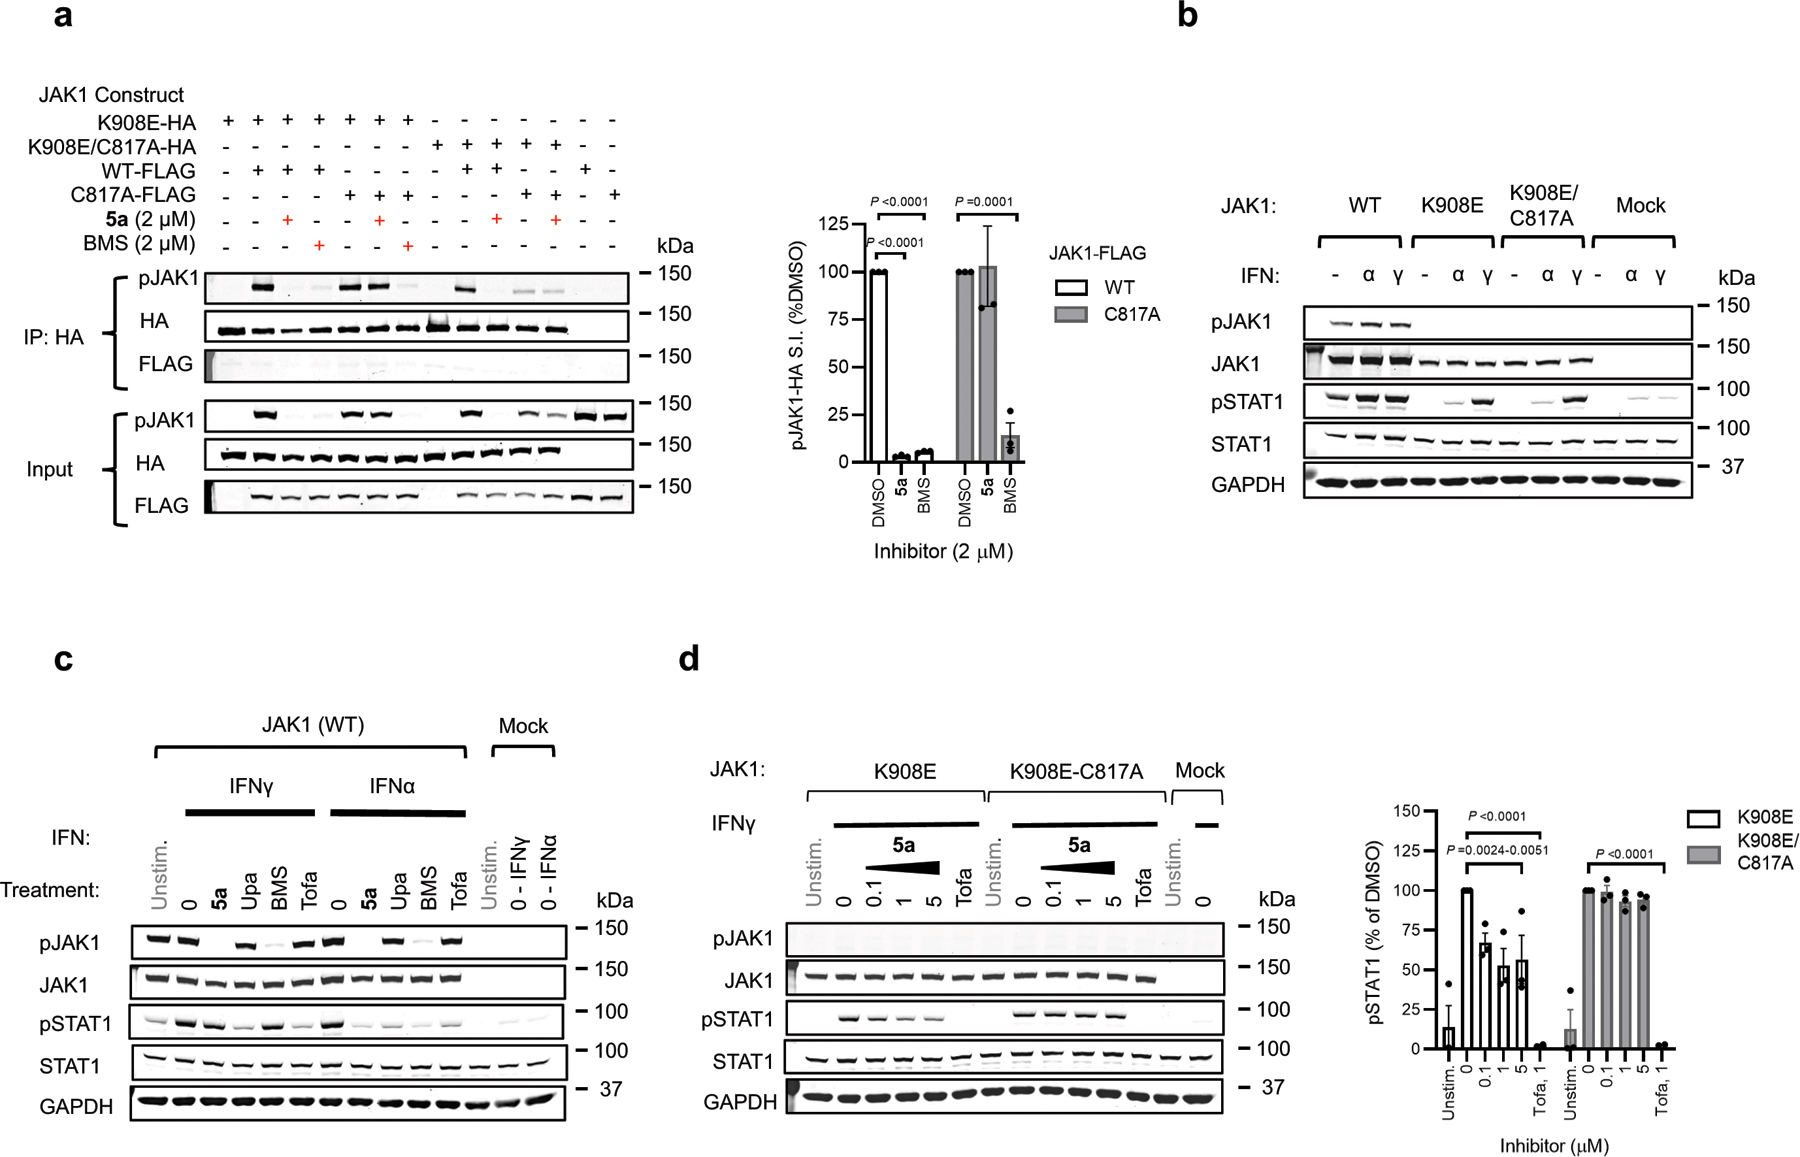
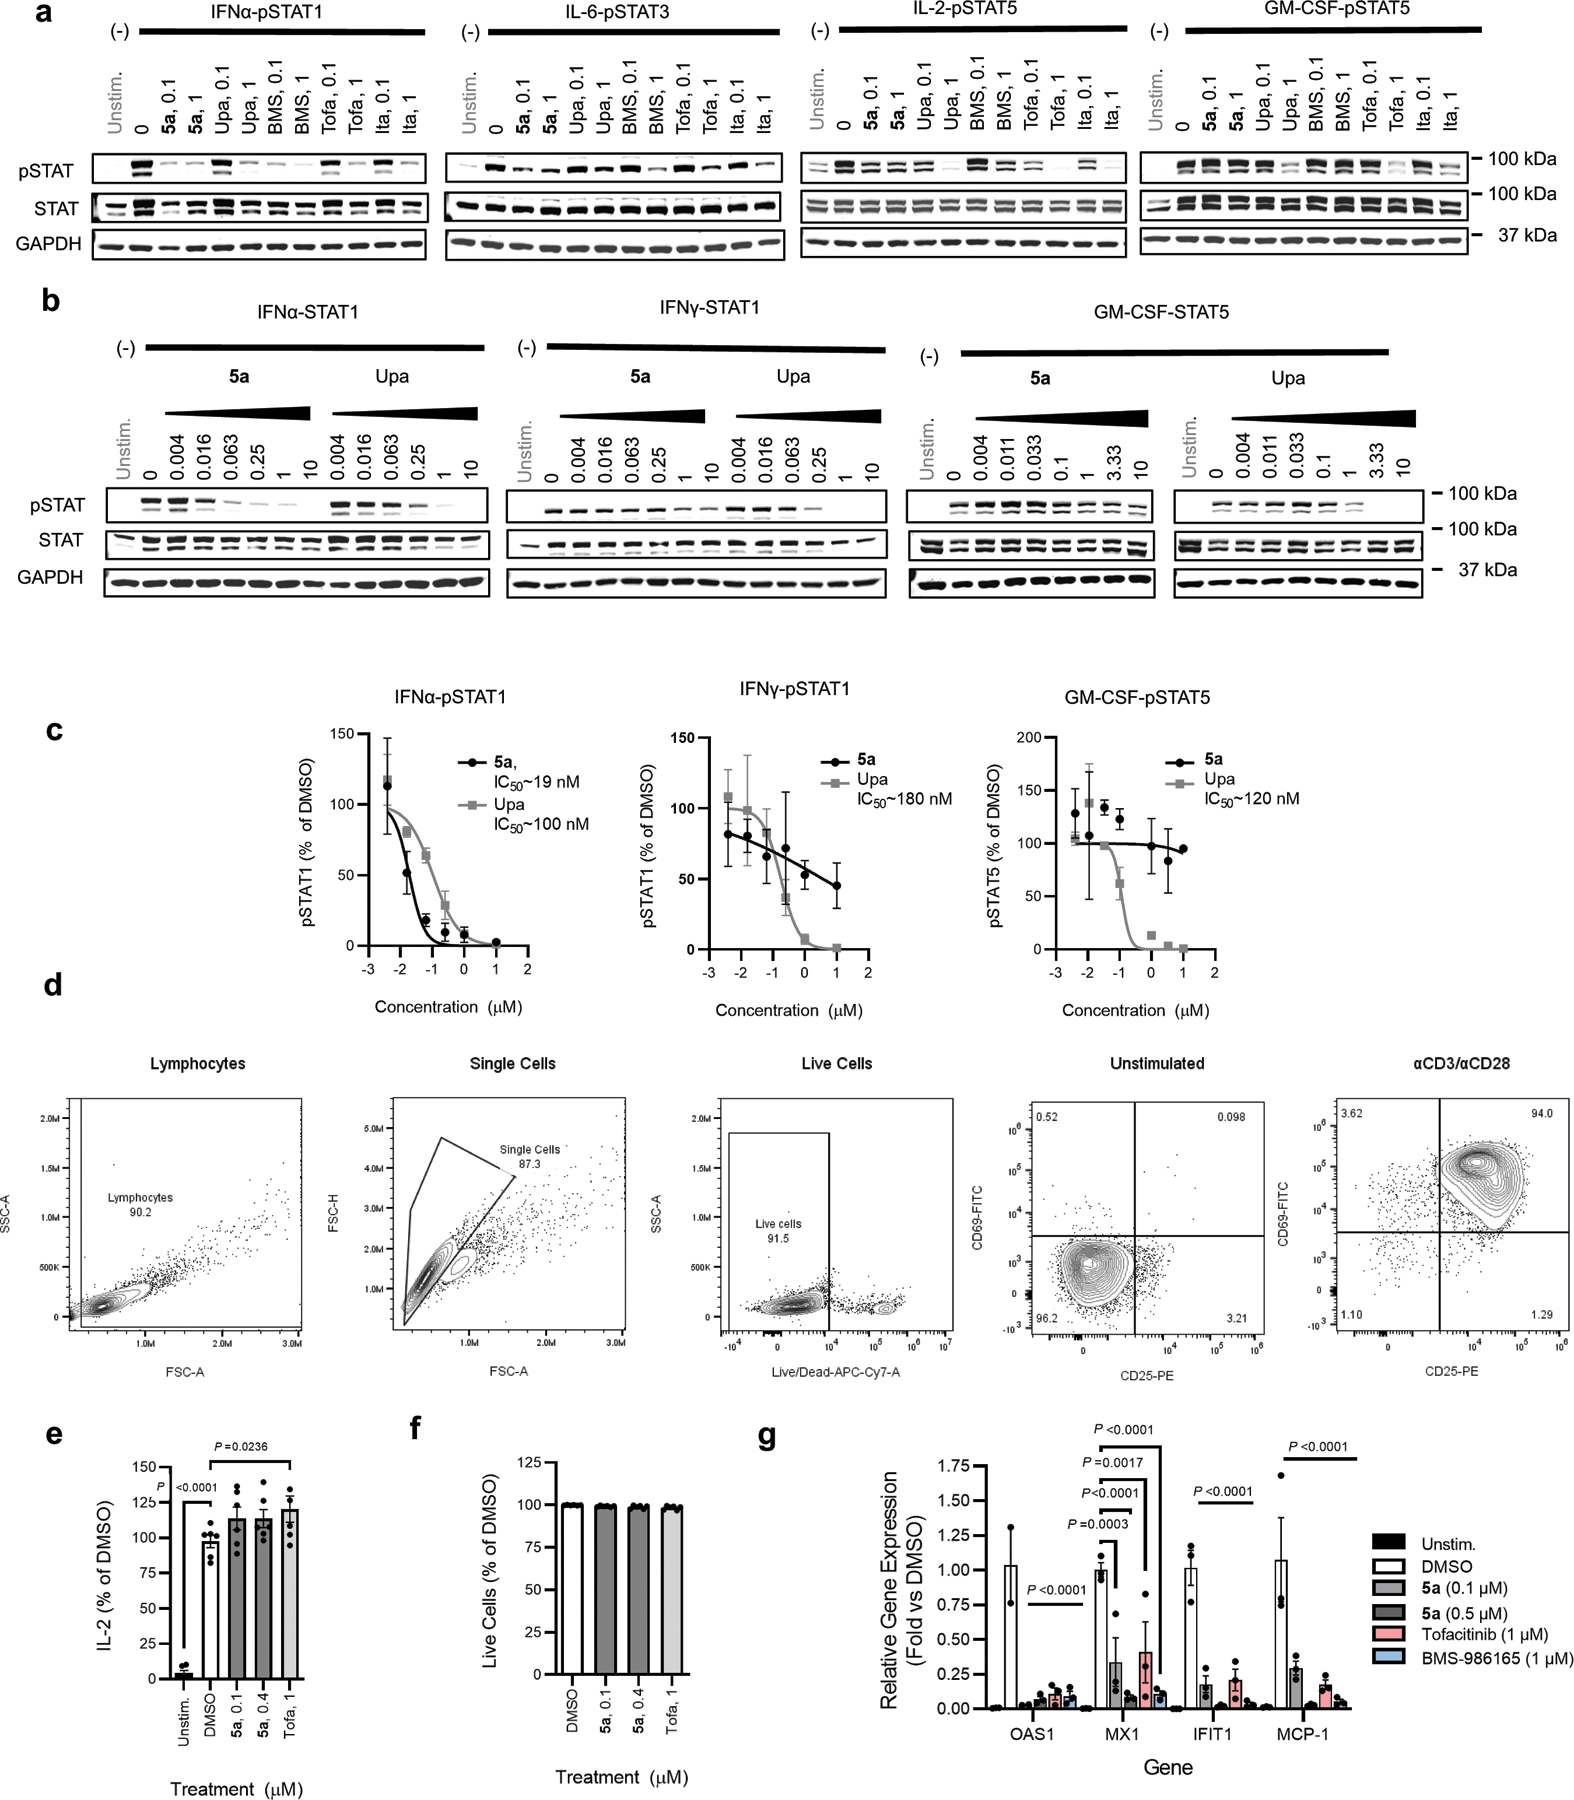
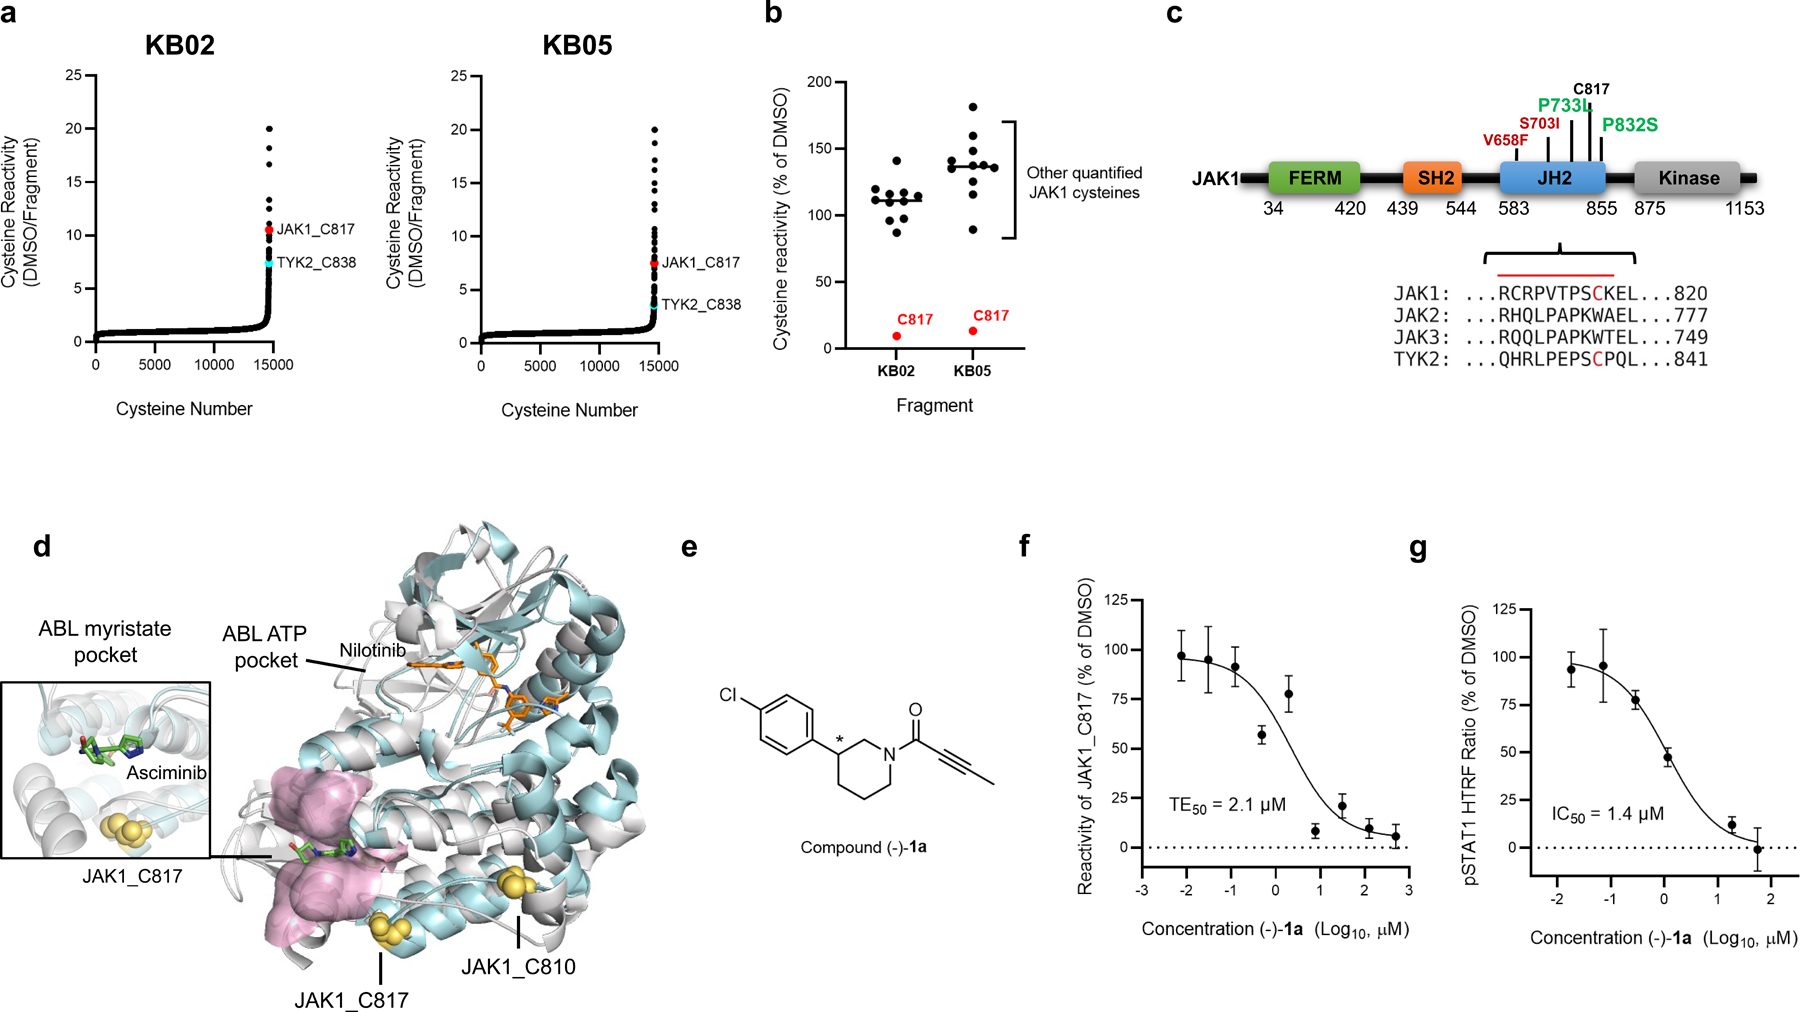
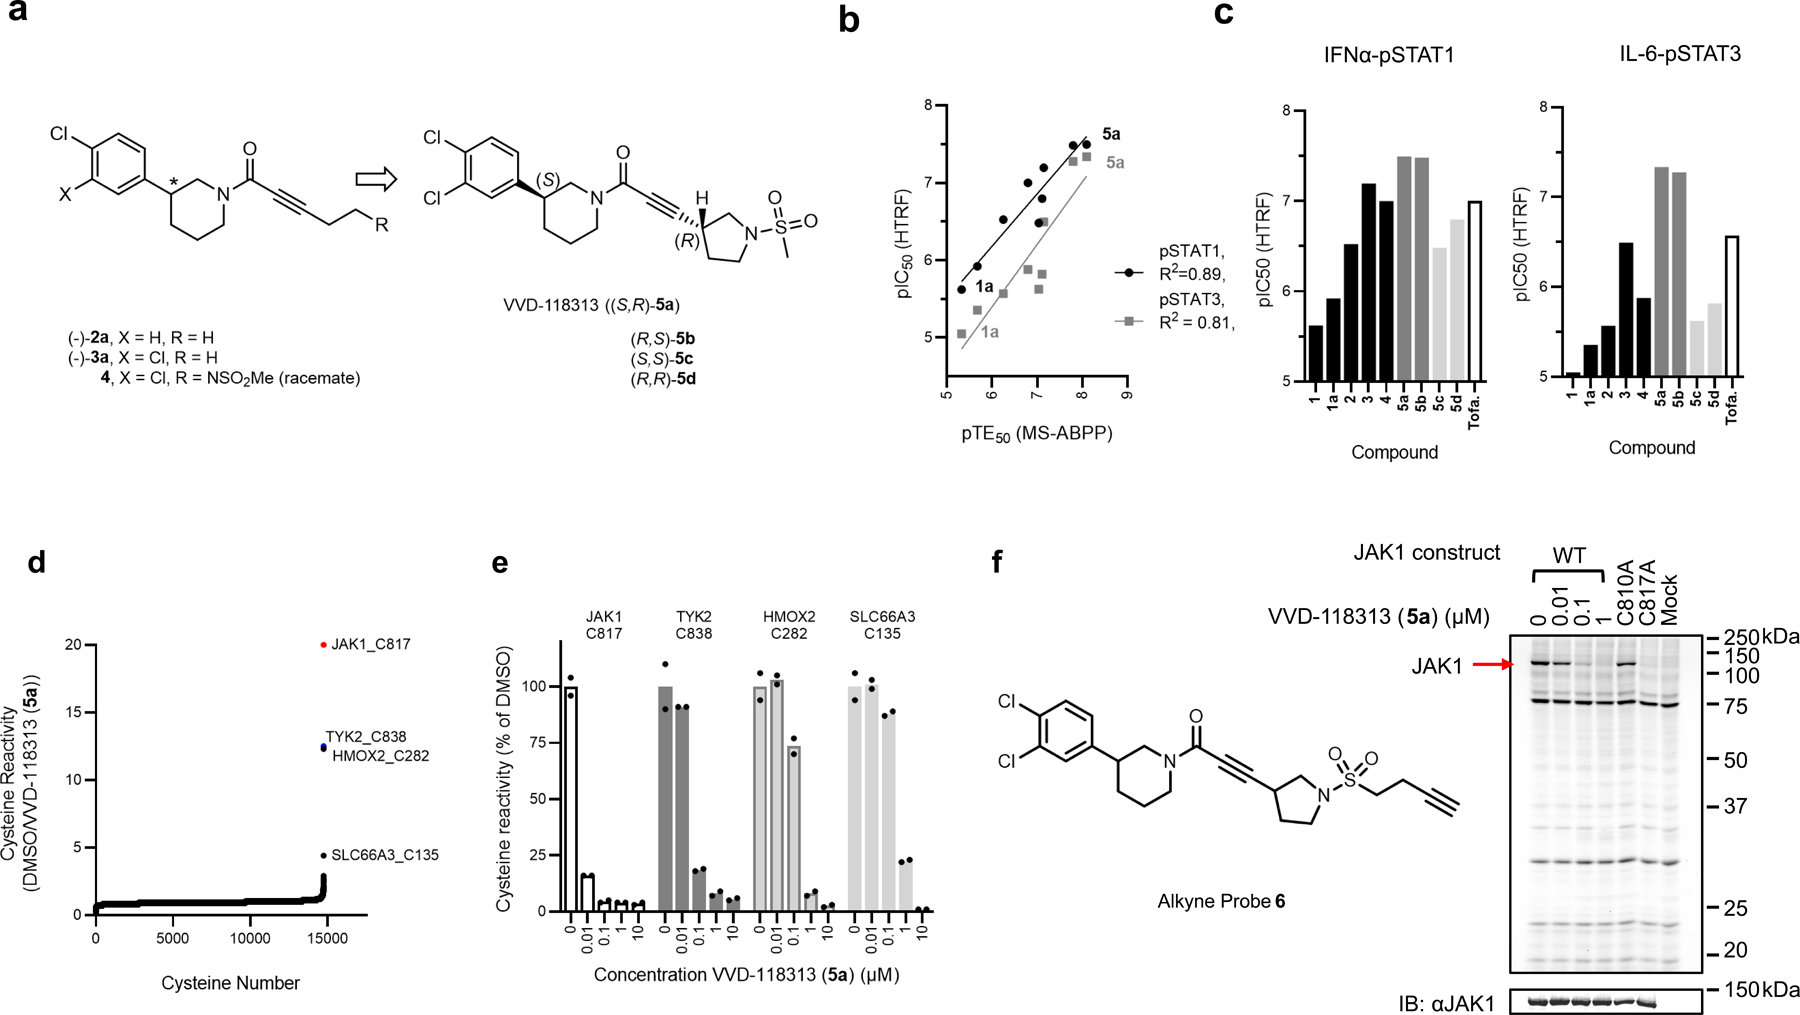
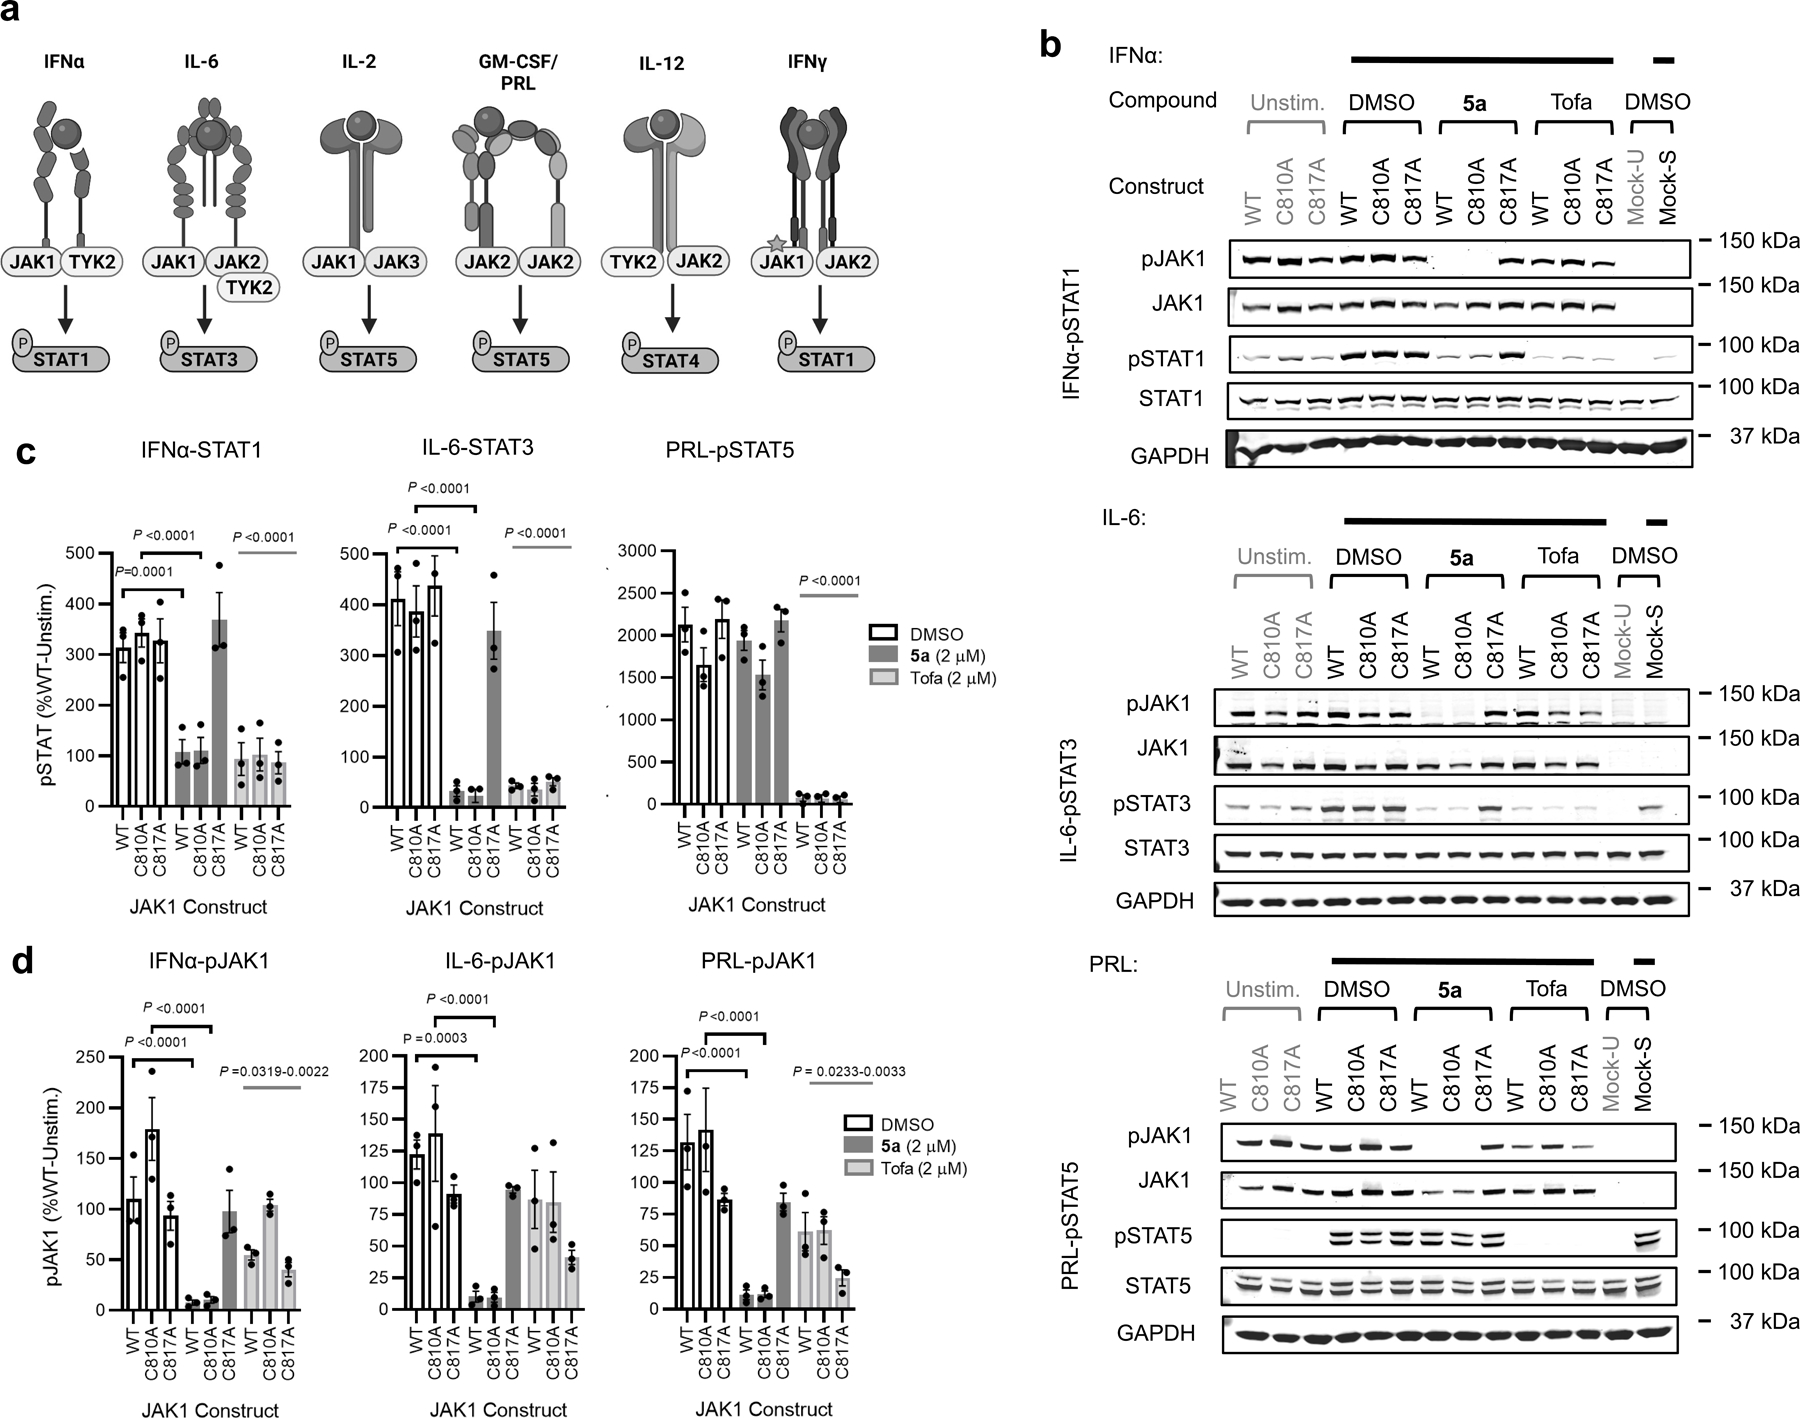
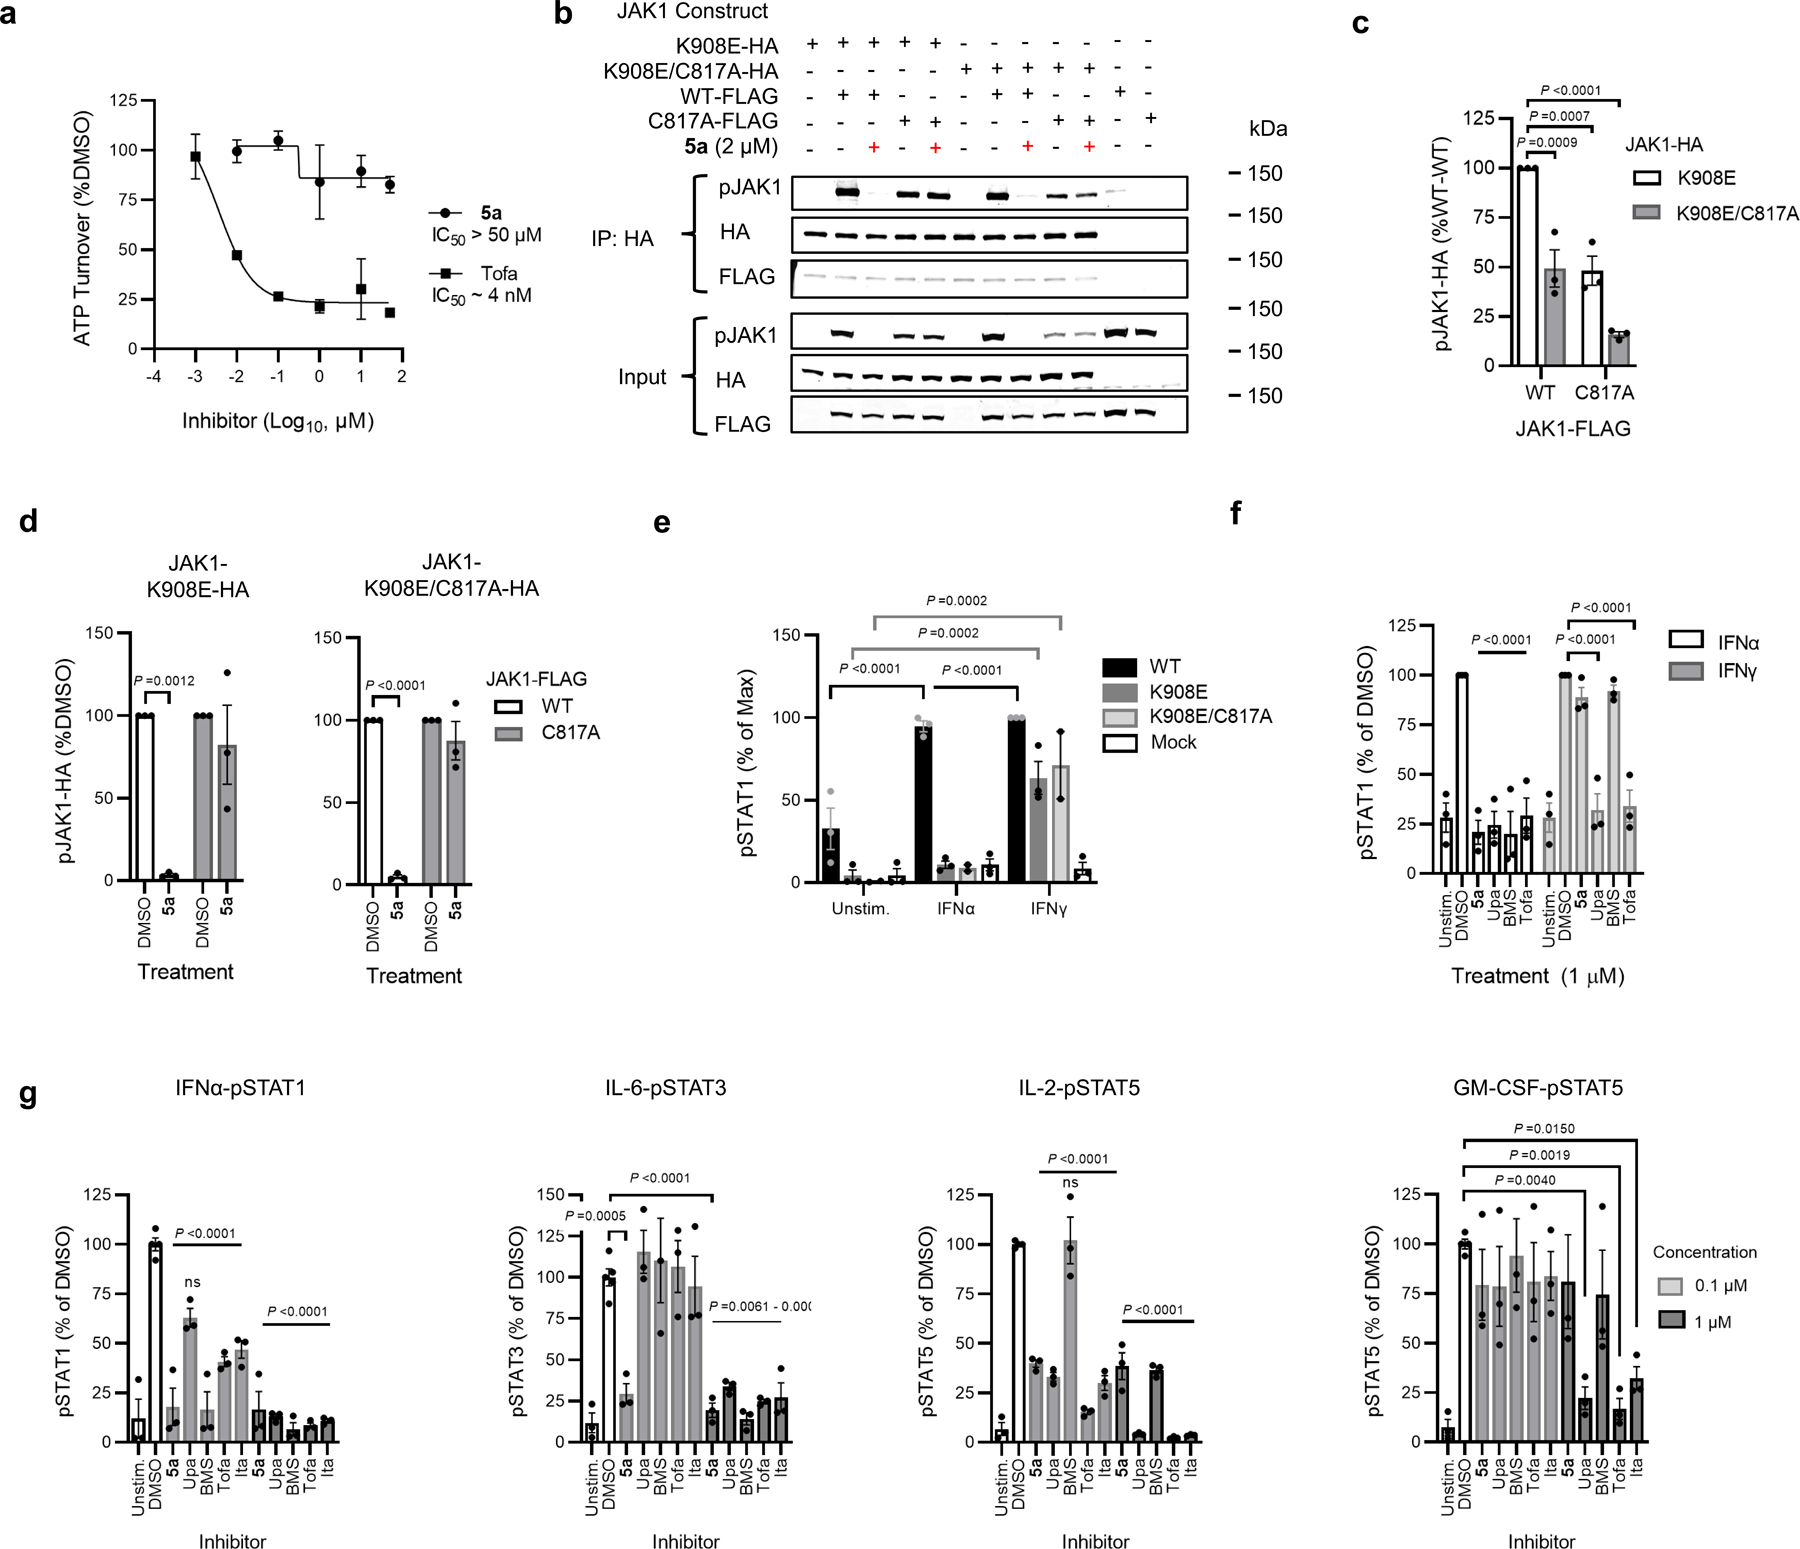
The Janus tyrosine kinase (JAK) family of non-receptor tyrosine kinases includes four isoforms (JAK1, JAK2, JAK3, and TYK2) and is responsible for signal transduction downstream of diverse cytokine receptors. JAK inhibitors have emerged as important therapies for immun(onc)ological disorders, but their use is limited by undesirable side effects presumed to arise from poor isoform selectivity, a common challenge for inhibitors targeting the ATP-binding pocket of kinases. Here we describe the chemical proteomic discovery of a druggable allosteric cysteine present in the non-catalytic pseudokinase domain of JAK1 (C817) and TYK2 (C838), but absent from JAK2 or JAK3. Electrophilic compounds selectively engaging this site block JAK1-dependent trans-phosphorylation and cytokine signaling, while appearing to act largely as 'silent' ligands for TYK2. Importantly, the allosteric JAK1 inhibitors do not impair JAK2-dependent cytokine signaling and are inactive in cells expressing a C817A JAK1 mutant. Our findings thus reveal an allosteric approach for inhibiting JAK1 with unprecedented isoform selectivity.


Conflict of interest statement

Competing Interests

The authors declare no competing financial interests.

Figures

Extended Data Fig. 1
Discovery of a ligandable cysteine in the JAK1/TYK2 pseudokinase domain a, Chemical structures of broadly reactive electrophilic fragments KB02 and KB05 evaluated previously for covalent reactivity with cysteines in the human T-cell proteome (Vinogradova, E. V. et al, Cell 182, 1009–1026 e29 (2020), b, Relative MS3 signal intensity values for all quantified IA-DTB-labeled, cysteine-containing peptides in TYK2 in KB02- or KB05-treated T cells compared to DMSO-treated T cells. The KB02- and KB05-liganded cysteine in TYK2 (C838) is highlighted in blue. Horizontal black bars indicate the median signal intensity for all other quantified TYK2 cysteines. Data are mean values combined from soluble and particulate proteomic of n = 2 (KB02) or n = 3 (KB05) independent replicates analyzed over 2 MS-ABPP experiments.
Extended Data Fig. 2
Chemical optimization, characterization and proteome-wide reactivity of VVD-118313 (5a). a, Engagement and inhibitory activity of covalent ligands targeting JAK1_C817. Engagement (TE50, μM, 1 h, in vitro) for JAK1_C817 or TYK2_C838 determined by targeted TMT-ABPP in human cell lysates. Data are mean values ± S.D. from n = 2–3 independent experiments with the exception of values marked with , which were from a single experiment. JAK1 inhibition (IC50) determined using HTRF assays measuring IFNα (100 ng/mL, 30 min)-stimulated STAT1 phosphorylation or IL-6 (25 ng/mL, 30 min)-stimulated STAT3 phosphorylation in human PBMCs pretreated with compounds for 2 h. Compounds were tested as single stereoisomers except where noted §. Absolute configuration not assigned for (−)-1a, (−)-2a and (−)-3a. For 5a, JAK1 inhibition following IFNα stimulation was also measured in PBMCs cultured in media supplemented with 10% v/v fetal bovine serum (FBS). Data are mean values ± S.D. from n = 2 independent experiments except where noted (n=3, n=1). ND – not determined. NA – not applicable for a non-covalent orthosteric inhibitor. b, IC50 values for JAK1_C817 engagement by VVD-118313 (5a) and enantiomer 5b in Jurkat T-cell lysate at 10, 30 and 60 minutes. JAK1_C817 engagement was measured by targeted MS-ABPP, where iodoacetamide desthiobiotin (200 μM) was added to cell lysates at the indicated timepoints after incubation with 5a or 5b. Data are mean values ± S.D. of n = 2 independent experiments. TE50 values were estimated by fitting data to a 4PL model and are reported as 95% confidence interval. c, Left, Global cysteine reactivity profile for VVD-118313 (1 µM, 1 h, in vitro) in primary human PBMC lysates (2 mg/mL proteome). Data represent mean ratio values (DMSO/VVD-118313) for IA-DTB-labeled, cysteine-containing peptides quantified from n = 2 replicate cell treatments analyzed in a single MS-ABPP experiment. Ratio values for JAK1_C817 (red) and TYK2_C838 (blue) are highlighted. Quantified cysteines with ratios ≥ 4 (≥ 75% engagement) are marked. Right, Concentration-dependent reactivity profile for VVD-118313 reactivity with TOR4A_C21 in human PBMCs (0.01–10 μM, 3 h, in situ) or PBMC lysates (0.01–10 µM, 1 h, in vitro). Bars show mean values from VVD-118313-treated samples shown as a percentage of DMSO-treated samples from n = 2 replicate cell treatments analyzed in a single MS-ABPP experiment.
Extended Data Fig. 3
Characterization of VVD-118313 inhibitory activity against JAK1 in 22Rv1 cells. a, Quantification of western blotting data measuring cytokine-stimulated STAT phosphorylation in 22Rv1 cells expressing WT-, C810A-, or C817A-JAK1 variants compared to mock-transfected 22Rv1 cells (see Fig. 3b for representative western blots). Cells were treated with IFNα (100 ng/mL, 30 min), IL-6 (50 ng/mL, 30 min) or prolactin (PRL, 500 ng/mL, 15 min) after which the indicated phosphorylated STATs (pSTATs) were measured. Signal intensities were normalized to unstimulated 22Rv1 cells expressing WT-JAK1. Data are mean values ± S.E.M. from n = 3 independent experiments. Significance was determined by two-way ANOVA with Tukey’s post-hoc test and reported for select comparisons. IFNα and IL-6-stimulated STAT1/3 phosphorylation was significantly enhanced by expression of any of the three JAK1 variants (P<0.0001), while prolactin-stimulated STAT5 phosphorylation was unaffected by JAK1 expression. b, c, Western blots showing concentration-dependent effects of VVD-118313 (5a) on IFNα-stimulated STAT1 phosphorylation (b) and IL-6-stimulated STAT3 phosphorylation (c) in 22Rv1 cells expressing WT-, C810A-, or C817A-JAK1 variants. Blots are representative of n = 2 independent experiments. d, Quantification of concentration-dependent effects of VVD-118313 (5a) on IFNα-stimulated pSTAT1 (left), IL-6-stimulated pSTAT3 (middle), and pJAK1 (integrated from both IFNα- and IL-6-stimulations) in 22Rv1 cells expressing WT-JAK1. Data are mean values ± S.E.M. from n = 2 (pSTAT1, pSTAT3) or n = 3 (pJAK1) independent experiments.
Extended Data Fig. 4
Engagement of TYK2_C838 and inhibition of TYK2-dependent signaling in 22Rv1 cells. a, Gel-ABPP experiment showing labeling of recombinant WT-TYK2, but not C838A-TYK2, expressed in 22Rv1 cells by alkyne probe 6 (0.1 μM, 2 h, in situ). The labeling of WT-TYK2 was blocked by pretreatment with VVD-118313 (5a) (0.01–1 μM, 2 h, in situ). We noted that the C838A-TYK2 mutant consistently expressed at higher levels than WT-TYK2, as revealed by the anti-TYK2 immunoblot (bottom). Data are from a single experiment representative of n = 2 independent experiments. b, Western blots showing concentration-dependent effects of VVD-118313 (5a; 0.01 – 5 µM, 2 h) and BMS- 986165 (BMS, 1 or 5 µM, 2 h) on TYK2 phosphorylation (pTYK2) and IFNα-stimulated STAT1 phosphorylation in 22Rv1 cells expressing recombinant WT-TYK2 or a C838A-TYK2 mutant. Blots representative of n = 3 independent experiments. c, Quantification of IFNα-stimulated STAT1 phosphorylation in TYK2 (WT or C838A)-transfected 22Rv1 cells compared to mock-transfected cells. Signal intensities were normalized to IFNα-treated (100 ng/mL, 30 min) mock-transfected cells. Data are mean values ± S.E.M. from n = 4 independent experiments. Significance was determined using a two-tailed Student’s t-test. d, Quantification of pSTAT1 (left) and pTYK2 (right) signals normalized to unstimulated control cells expressing WT-TYK or C838A-TYK2. Data are mean values ± S.E.M. from n = 3 independent experiments. Significance was determined by two-way ANOVA with Dunnett’s post-hoc test. P-values are only shown for the lowest concentration of each compound to inhibit pSTAT1 or pTYK2 S.I. ≥50%.
Extended Data Fig. 5
Allosteric JAK1 and TYK2 inhibitors block endogenous signaling in 22Rv1s and JAK1 phosphorylation. a-d, Western blots (a, c) and quantification (b, d) of the effect of VVD-118313 (5a), tofacitinib (Tofa), and BMS-986165 (BMS) on IFNα-stimulated STAT1 and IL-6-stimulated STAT3 phosphorylation in mock-transfected 22Rv1 cells, which lack JAK1. Unstim, unstimulated controls. b, d, Quantification of pSTAT1 signals shown as a percent of the stimulated DMSO-treated control cells for each assay. Data are mean values ± S.E.M.. from n = 2 (a, b), or n = 3 (c, d) independent experiments. Significance was determined by one-way ANOVA with Tukey’s post-hoc test and shown for the lowest concentration to inhibit pSTAT1 S.I. ≥50%. e, Left, Western blots showing concentration dependent effects of BMS-986165 (BMS) on IL-6-stimulated STAT3 phosphorylation and JAK1 phosphorylation in 22Rv1 cells transfected with WT or C817A-JAK1. Right, Quantification of pSTAT3 and pJAK1 signal intensity. Western blots are representative, and data are mean values ± S.E.M., from n = 3 independent experiments.
Extended Data Fig. 6
VVD-118313 functional activity and proteomic selectivity in primary immune cells. a-e, Western blots corresponding to Fig. 4a–e, showing effects of VVD-118313 (5a), stereoisomeric mixture 5, and tofacitinib (Tofa) on JAK-STAT signaling pathways in human PBMCs and PHA-P/IL-2 generated T-blasts. Cells were treated with compounds at the indicated concentrations for 2 h prior to stimulation with IFNα (a; 100 ng/mL, 30 min), IL-6 (b; 25 ng/mL, 30 min), IL-2 (c; 20 U/mL, 15 min), GM-CSF (d; 0.5 mg/mL, 15 min), or IL-12 (e; 12.5 ng/mL, 15 min). Blots are representative of n = 3 (IL-6, IL-2, IL-12) or n = 4 (IFNα, GM-CSF) independent experiments. f, Left, Global cysteine reactivity profile for VVD-118313 (5a; 10 µM, 3 h, in situ) in primary human PBMCs. Reactivity values for JAK1_C817 (red) and TYK2_C838 (blue) are highlighted, and dashed horizontal line marks boundary for > 75% engagement by VVD-118313 at 10 µM. Right, heat map showing the reactivity profiles for cysteines in PBMCs treated with the indicated concentrations of VVD-118313. Only cysteines that were engaged >75% by VVD-118313 at 10 µM are shown. Data in both panels represent mean ratio values (DMSO/VVD-118313) for IA-DTB-labeled, cysteine-containing peptides quantified from n = 2 replicate cell treatments analyzed in a single MS-ABPP experiment. g, Left, Global cysteine reactivity profile for VVD-118313 (1 µM, 1 h, in vitro) in mouse splenocyte lysates. Jak1_C816 shown in red. Right, Reactivity of JAK1_C816 in mouse splenocyte lysates treated with the indicated concentrations of VVD-118313 (5a; 1 h). Data in both panels represent mean ratio values (DMSO/VVD-118313) for IA-DTB-labeled, cysteine-containing peptides quantified from n =2 replicate cell treatments analyzed in a single MS-ABPP experiment.
Extended Data Fig. 7
Characterization of the inhibitory activity of VVD-118313 in mouse splenocytes. a-e, Top, Western blots showing concentration-dependent effects of VVD-118313 (5a) and/or compound 5 on IFNα-stimulated STAT1 phosphorylation (a), IL-2-stimulated STAT5 phosphorylation (b), GM-CSF-stimulated STAT5 phosphorylation (c), IL-12-stimulated STAT4 phosphorylation (d), and IL-6-stimulated STAT3 phosphorylation (e) in mouse splenocytes. Tofacitinib (Tofa) and BMS-986165 were also tested where indicated. Splenocytes were treated with compounds at indicated concentration for 2 hours prior to stimulation with IFNα (100 ng/mL, 30 min), IL-2 (20 U/mL, 15 min), GM-CSF (10 mg/mL, 15 min), IL-12 (12.5 ng/mL, 15 min) or IL-6 (10 ng/mL, 30 min). Bottom, Quantification of pSTAT signals. Signal intensities were normalized relative to stimulated DMSO-treated controls in each assay. Data are mean values ± S.E.M. from n = 3 (IL-2, GM-CSF, IL-12, IL-6) or n = 4 (IFNα) biologically independent experiments. Significance determined by one-way-ANOVA with Dunnett’s post-hoc test. P-values are shown for the lowest concentration of compound to inhibit S.I. ≥50%. . f, Top, Western blot showing effects of a panel of JAK inhibitors on IL-6-stimulated STAT3 phosphorylation in mouse splenocytes. Bottom, quantification of pSTAT3 signals performed and analyzed as described in a-e. Data are mean values ± S.E.M. from n = 2 independent experiments. g, Top, Western blot showing effect of JAK inhibitors on IL-6 stimulated STAT3 phosphorylation in splenocytes from Tyk2-null mice (Tyk2−/−) or matched wildtype (WT, Tyk2fl/fl) mice. Bottom, Quantification of pSTAT3 signal intensity normalized to the stimulated DMSO control of WT splenocytes. Data are mean values ± S.E.M. from n = 3 mice. Significance of inhibition relative to DMSO-treatment controls was determined by two-way ANOVA with Tukey’s post-hoc test.
Extended Data Fig. 8
VVD-118313 inhibits JAK1-dependent signaling ex vivo. a, Left, Representative western blots showing recovery of JAK1-mediated STAT1-phosphorylation in human PBMCs that were treated with 5a (0.1 μM) or tofacitinib (1 μM) for 2 h, then compounds were removed by washing and PBMCs were stimulated with IFNα (100 ng/mL, 30 min) at the indicated timepoint post washout. Right, Quantification of pSTAT1 signal intensity normalized to DMSO-treated control. Data are mean values ± S.E.M. from n = 4 independent experiments. Significance determined by two-way-ANOVA with Tukey’s post-hoc test. b, Left, Representative western blots, and right, quantification of pSTAT1 signal intensity from equivalent experiment to that described in (a), except that media was not exchanged after the first 2 h. Data are mean values ± S.E.M from n = 3 independent experiments. Significance relative to stimulated DMSO-treated control at each time point determined by two-way-ANOVA with Tukey’s post-hoc test. For a and b, T=0 refers to the time of the washout step performed in a. c, Western blots containing the results quantified in Fig. 4h, which represents ex vivo cytokine-stimulated STAT phosphorylation assays performed in splenocytes from mice treated with vehicle or compound 5 (25 mg/kg, 2 × 4 h). Splenocytes were stimulated with IFNα (1000 U/mL, 30 min), IL-2 (20 U/mL, 15 min), IL-6 (10 ng/mL, 30 min) or GM-CSF (10 ng/mL) prior to analysis of indicated STAT phosphorylation signals. #1–3 correspond to n = 3 individual mice per treatment groups. Blots are representative of n = 3 (IFNα, IL-2) or n = 1 (GM-CSF, IL-6) independent experiments. d, Quantification of ex vivo stimulation of splenocytes from mice treated with vehicle or 5 (25 mg/kg, s.c., 2 × 4 h) with IL-6 (10 ng/mL, 30 min) or GM-CSF (10 ng/mL, 15 min). Data are mean values ± S.E.M., from n = 3 mice analyzed in one experiment.
Extended Data Fig. 9
Mechanistic properties of allosteric JAK1 inhibitors. a, Left, Western blots measuring effects of VVD-118313 (5a) and BMS-986165 (BMS) (2 µM, 2 h) on JAK1 phosphorylation (pJAK1) from anti-HA immunoprecipitations (IPs) of HA-tagged kinase dead (K908E) JAK1 (WT or C817A mutant) expressed in 22Rv1 cells alongside catalytically active FLAG-tagged JAK1 (WT or C817A mutant). Right, quantification of pJAK1 data, where pJAK1 signals in HA-immunoprecipitation eluent were normalized as a % of the respective DMSO-treated controls. Data are mean values ± S.E.M. from n = 3 independent experiments. Significance determined by two-way ANOVA with Dunnett’s post-hoc test. b, Western blots showing that both K908E- and K908E/C817A-JAK1 mutants support IFNγ-stimulated (50 ng/mL, 30 min), but not IFNα-stimulated (100 ng/mL, 30 min) STAT1 phosphorylation (pSTAT1) in 22Rv1 cells. Blots are representative of n = 3 independent experiments. c, Westerns blots showing the effects of DMSO, VVD-118313 (5a), upadacitinib (Upa), BMS-986165 (BMS) or tofacitinib (all 1 μM, 2h) on IFNα (100 ng/mL, 30 min) or IFNγ (1000 U/mL, 30 min)-stimulated STAT1 phosphorylation in WT-JAK1 transfected 22Rv1 cells. Blots are representative of n = 3 independent experiments. d, Left, western blots showing the effects of VVD-118313 (5a; 0.1–5 µM, 2 h) and tofacitinib (Tofa; 1 µM, 2 h) on IFNγ-dependent STAT1 phosphorylation (pSTAT1) in 22Rv1 cells expressing K908E-JAK1-HA or K908E/C817A-JAK1-HA. Right, quantification of western blot data. Data are mean values ± S.E.M. from n = 3 independent experiments. Significance determined by two-way ANOVA with Dunnett’s post-hoc test.
Extended Data Fig. 10
Distinct pharmacological profile and effects of VVD-118313 on JAK/STAT-dependent immune cell processes. a, Western blots related to Fig. 5g showing effects of the indicated JAK inhibitors on the indicated cytokine-STAT phosphorylation pathways. Human PBMCs were treated with the compounds – VVD-118313 (5a), upadactinib (Upa), BMS-986165 (BMS), tofacitinib (Tofa. and itacitinib (Ita) – at the indicated concentrations (µM) for 2 h and then stimulated with IFNα (100 ng/mL, 309 min), IL-6 (25 ng/mL, 30 min), IL-2 (20 U/mL< 15 min) or GM-CSF (0.5 ng/mL, 15 minutes). Blots are representative of n = 2 (IL-6) or n = 3 (IFNα, IL-2, GM-CSF) independent experiments. b, Western blots showing concentration-dependent effects of VVD-118313 (5a) and upadacitinib (Upa) on IFNα-stimulated STAT1, IFNγ-stimulated STAT1, and GM-CSF-stimulated STAT5 phosphorylation in human PBMCs. Blots are representative of n = 2 independent experiments. c, Quantification of the concentration-dependent effects of VVD-118313 (5a) or upadacitinib (Upa) on pSTAT signals related to (b). Data were normalized to the DMSO-treated cytokine-stimulated control in each assay. Dose-response curves are mean values ± S.D. from n = 2 independent experiments. IC50 values were estimated by fitting data to a 4PL model. d, Flow cytometry plots showing gating strategy for the quantification of CD25+ and CD69+ T-cells in Fig. 6a, b. e, Quantification of secreted IL-2 from T cells treated with the indicated concentrations of VVD-118313 (5a) or tofacitinib and stimulated with αCD3/αCD28 (5/2 μg/mL) for 24 h. Data are mean values ± S.E.M. from n = 3 independent experiments and are normalized as a percent of the DMSO-treated stimulated cells from each donor. Significance was determined by two-way ANOVA with Dunnett’s post-hoc test. f, Proportion of single cell lymphocyte population staining negative with Near IR Live/Dead cell viability stain. Data are normalized as a percent of the DMSO-treated control are mean values ± S.E.M. of n = 3 biological replicates. g, RT-PCR analysis of the expression of the indicated interferon-stimulated genes in PBMCs treated with VVD-118313 (0.1, 0.5 μM), tofacitinib (1μM) or BMS-986165 (1 μM) for 2 h followed by IFNα (100 ng/mL, 16 h). Gene expression values were normalized to GAPDH and are reported as fold-change relative to DMSO-treated stimulated control (ΔΔCt). Data are mean values ± S.E.M from n = 3 independent experiments. Significance determined by two-way ANOVA with Tukey’s post-hoc test.
Figure 1.
Figure 1.. Discovery of a ligandable cysteine in the JAK1/TYK2 pseudokinase domain.
a, Competition ratios of IA-DTB-labeled and enriched cysteine-containing peptides quantified in MS-ABPP experiments performed using proteomes from human T cells treated in situ with the cysteine-reactive small-molecule fragments KB02 and KB05 (50 µM, 1 h) or DMSO control. b, Relative MS3 signal intensity values for all quantified IA-DTB-labeled, cysteine-containing peptides in JAK1 in KB02- or KB05-treated T cells compared to DMSO-treated T cells. The KB02- and KB05-liganded cysteine C817 is highlighted in red. Horizontal black bars indicate the median signal intensity for all other quantified JAK1 cysteines. For a and b, data are mean values combined from soluble and particulate proteomic of n = 2 (KB02) or n = 3 (KB05) independent replicates analyzed over 2 MS-ABPP experiments as described previously. c, Top, Domain structure of JAK1, noting C817 and select gain- (red) or loss- (green) of-function mutations in the pseudokinase (JH2) domain. Below, Partial amino acid sequence alignment of human JAK family proteins. Electrophilic fragment-liganded cysteines in JAK1 (C817) and TYK2 (C838) are in red. Red line indicates the tryptic peptide containing JAK1_C817. d, Overlay of the x-ray crystal structures of the JAK1 JH2 domain (PDB 4L00) and ABL kinase domain (PDB 5MO4), highlighting the proximity of JAK1 C817 (yellow spheres) to the ABL myristate-binding pocket (pink). The allosteric ABL inhibitor asciminib (green) and orthosteric inhibitor nilotinib (orange) are show in stick representations. e, Structure of compound (−)-1a (*single stereoisomer, absolute configuration not assigned). f, Concentration-dependent engagement of JAK1_C817 by (−)-1a determined by targeted MS-ABPP experiments (1 h compound treatment of human PBMC or Jurkat cell proteome). TE, target engagement. g, Concentration-dependent inhibition of IFNα-stimulated STAT1 phosphorylation (pSTAT1) by (−)-1a in human PBMCs. Cells were treated with (−)-1a for 2 h followed by 100 ng/mL of IFNα for 30 min, lysed, and pSTAT1 signals measured by HTRF. Data for f, g are mean values ± S.D. from n = 3 (f) or n = 2 (g) independent experiments.
Figure 2.
Figure 2.. Optimization of covalent allosteric JAK1 inhibitors.
a, Structures of VVD-118313 (compound 5a), stereoisomers (5b-d), and key precursors ((−)-2a, (−)-3a, and 4). Compounds (−)-2a, (−)-3a, and 5a-d were tested as single stereoisomers (*absolute configuration not assigned). b, Correlation between engagement of JAK1_C817 (pTE50) determined for compounds as described in Fig. 1f and inhibition of cytokine-induced STAT1/3 phosphorylation (pSTAT1/pSTAT3; HTRF pIC50) determined for compounds tested as described in Fig. 1g and Extended Data Fig. 2a. R2 values comparing pTE50 values to pIC50 values for pSTAT1 (black circles) and pSTAT3 (gray squares) were determined by linear regression. c, pIC50 values for inhibition of IFNα-stimulated STAT1 and IL-6-stimulated STAT3 phosphorylation for representative compounds determined as described in Fig. 1g and Extended Data Fig. 2a. For b, c, Data are mean –log-transformed values from n = 2 independent experiments. d, Global cysteine reactivity profile for VVD-118313 (5a) (1 µM, 3 h, in situ) in primary human PBMCs. Data represent mean ratio values (DMSO/VVD-118313) for IA-DTB-labeled, cysteine-containing peptides quantified from n = 2 replicate cell treatment experiments analyzed in a single MS-ABPP experiment. Ratio values for JAK1_C817 (red) and TYK2_C838 (blue) are highlighted. Quantified cysteines with ratios ≥ 4 (≥ 75% engagement) are marked. e, Concentration-dependent reactivity profiles for cysteines engaged by VVD-118313 in human PBMCs (0.01–10 μM, 3 h, in situ). Bars show mean values from VVD-118313-treated cells shown as a percentage of DMSO-treated cells from n = 2 replicate cell treatment experiments analyzed in a single MS-ABPP experiment. f, Left, structure of alkyne probe 6. Right, gel-ABPP experiment showing labeling of recombinant WT-JAK1 and C810A-JAK1, but not C817A-JAK1, expressed in 22Rv1 cells with alkyne probe 6 (0.1 μM, 2 h, in situ). The labeling of WT-JAK1 is blocked by pretreatment with VVD-118313 (0.01–1 μM, 2 h, in situ). Below, western blot showing JAK1 expression in gel-ABPP experiment. Data are from a single experiment representative of n = 2 independent experiments.
Figure 3.
Figure 3.. VVD-118313 inhibits JAK1 through engagement of C817.
a, Representative cytokine signaling pathways involving different JAK family members. (star indicates that JAK1 serves a scaffolding role for IFNg-STAT1 signaling). b, Western blots showing effects of VVD-118313 (5a) and the pan-JAK inhibitor tofacitinib (Tofa) on JAK1 phosphorylation (pJAK1; Y1034/Y1035 phosphorylation detected with (D7N4Z) Rabbit mAb #74129, CST) and IFNα-stimulated STAT1 (JAK1-dependent), IL-6-stimulated STAT3 (JAK1-dependent), and prolactin (PRL)-stimulated STAT5 (JAK2-dependent) phosphorylation in 22Rv1 cells expressing WT-, C810A-, or C817A-JAK1. Cells were treated with compounds (2 µM) for 2 h and then stimulated with IFNα (100 ng/mL, 30 min), IL-6 (50 ng/mL, 30 min) or PRL (500 ng/mL, 15 min) prior to analysis. Blots are representative of n = 3 independent experiments used for quantification. c, d, Quantification of pSTAT1/3/5 (c) and pJAK1 (d) signals from (b). Signal intensities were normalized relative to the unstimulated WT-JAK1-transfected control for each experiment. Data are mean values ± S.E.M. from n = 3 independent experiments. Significance was determined by two-way ANOVA with Dunnett’s post-hoc test and reported relative to stimulated, DMSO-treated control of respective JAK1 construct.
Figure 4.
Figure 4.. VVD-118313 selectively inhibits JAK1 signaling in primary human immune cells and mice.
a-d, JAK-STAT pathway activity (pSTAT signals measured by western blotting) in human PBMCs treated with the indicated compounds for 2 h prior to stimulation with IFNα (a; 100 ng/mL, 30 min), IL-6 (b; 25 ng/mL, 30 min), IL-2 (c; 20 U/mL, 15 min), or GM-CSF (d; 0.5 mg/mL, 15 min).Data are mean values ± S.E.M. from n =3 (IL-6, IL-2) or n = 4 (IFNα, GM-CSF) independent experiments. Significance determined by one-way-ANOVA with Dunnett’s post-hoc test. P-values are only shown for the lowest concentration of each compound that displayed significance for inhibition of pSTAT. e, STAT4 phosphorylation in phytohemagglutinin (PHA-P)/IL-2-generated PBMC-derived T-blasts treated with the indicated compounds for 2 h prior to stimulation with IL-12 (12.5 ng/mL, 15 min). Data are mean values ± S.E.M. from n = 3 independent experiments, except for compound 5, where data are from n = 2 experiments. Significance was determined as for (a-d). See Extended Data Fig. 6a–e for representative western blots of data quantified in panels a-e. f, g, Reactivity profiles for JAK1_C816 (f) and all quantified JAK1 cysteines (g) from spleen proteomic lysates of mice treated with vehicle (dose 0 mg/kg) or compound 5 (25 or 50 mg/kg, s.c. 2 × 4 h). Data are mean values ± S.D. from n = 4 animals/group analyzed in a single targeted MS-ABPP experiment. In g, bars represent median reactivity values for all JAK1 cysteines other than C816. h, Ex vivo cytokine stimulation of splenocytes from mice treated with vehicle or 5 (25 mg/kg, s.c., 2 × 4 h); IFNα (100 ng/mL, 30 min) or IL-2 (20 U/mL, 15 min). Data are mean values ± S.E.M. from n = 3 independent experiments, each containing n = 3 mice per treatment group. Significance determined by two-way ANOVA with Šidák’s post hoc test. See Extended Data Fig. 8c for representative western blots of data quantified in panels h.
Figure 5.
Figure 5.. Mechanistic properties of allosteric JAK1 inhibitors.
a, Substrate assay with recombinant purified JAK1 (residues 438–1154) treated with DMSO, VVD-118313 (5a) or tofacitinib (Tofa) (0.001 - μM, 30 min) prior to addition of an IRS-1 peptide substrate (0.2 µg/mL) and ATP (50 µM, 1 h). Data are mean values ± S.D. from n = 2 independent experiments. b, western blots measuring JAK1 phosphorylation (pJAK1) from anti-HA immunoprecipitations (IPs) of HA-tagged kinase dead (K908E) JAK1 (WT or C817A mutant) expressed in 22Rv1 cells alongside catalytically active FLAG-tagged JAK1 (WT or C817A mutant). Blots are representative of n = 3 experiments. c, Quantification of pJAK1 signals from anti-HA IPs from DMSO-treated cells co-expressing the indicated combinations JAK1 constructs. Data are normalized to signals in 22Rv1 cells expressing K908E-JAK1-HA and WT-JAK1-FLAG. d Quantification of pJAK1 signals from anti-HA IPs of either DMSO or VVD-118313 (5a; 2 µM, 2 h)-treated 22Rv1 cells expressing the indicated combination of JAK1 constructs. Data are normalized to signals in DMSO-treated control cells. e, Quantification of STAT1 phosphorylation (pSTAT1) in IFNγ-stimulated (50 ng/mL, 30 min) 22Rv1 cells expressing the indicated JAK1 constructs. pSTAT1 signals were normalized to the maximum signal (IFNγ-stimulated WT-JAK1 transfected cells). f, Inhibition of IFNα (100 ng/mL, 30 min) or IFNγ (1000 U/mL, 30 min)-stimulated STAT1 phosphorylation in WT-JAK1 transfected 22Rv1 cells treated with DMSO, VVD-118313 (5a), upadacitinib (Upa), BMS-986165 (BMS) or tofacitinib Tofa (1 μM, 2h). For c-f, data are mean values ± S.E.M. from n = 3 independent experiments. Significance was determined by two-way ANOVA with Dunnett’s post-hoc test (c-d, f) or with Tukey’s post-hoc test (e). See Extended Data Fig. 9b, c for representative western blots of data quantified in panels e, f. g, Effects of VVD-118313 (5a) and other JAK inhibitors on the indicated cytokine-stimulated pSTAT pathways in human PBMCs as determined by western blotting (see Extended Data Fig. 10a for representative western blots). Data are mean values ± S.E.M. from n = 2 (IL-6) or n = 3 (IFNα, IL-2, GM-CSF) independent experiments. Significance determined by one-way ANOVA with Šidák’s post-hoc test.
Figure 6.
Figure 6.. Effects of VVD-118313 on JAK/STAT-dependent immune cell processes.
a, Representative flow cytometry plot showing CD25 and CD69 expression on unstimulated or αCD3/αCD28-stimulated primary human T cells treated with DMSO or VVD-118313 (5a, 0.4 μM) for 24 h. b, Quantification of CD25+ and CD69+ T cells stimulated with αCD3/αCD28 and treated with the indicated concentration of VVD-118313 or tofacitinib. Data are mean values ± S.E.M of n = 3 biological replicates and are normalized as a per-cent of the DMSO-treated stimulated cells from each donor. Significance relative to stimulated, DMSO-treated control was determined by two-way ANOVA with Dunnett’s post-hoc test. c, Quantification of IFNγ in T-cell media measured by ELISA. Data are mean values ± S.E.M of n = 3 biological replicates. Cell treatment and data analysis performed as described in (a, b). d, Heat map of cytokine/chemokine expression in culture media from human PBMCs treated with DMSO, VVD-118313 (5a, 0.1 or 0.5 µM), tofacitinib (1 μM), or BMS-986165 (1 μM) for 2 h, then stimulated with IFNα (100 ng/mL, 16 h). Cytokines were quantified using a 27-plex immunoassay kit and data are shown for cytokines induced by IFNα treatment ≥ 2-fold verse unstimulated controls across n = 3 biological replicates. Data are expressed as percent of stimulated DMSO-treated cells from n = 3–4 technical replicates and n = 3 independent biological experiments. e, Quantification of select cytokines/chemokines in PBMC media treated as described in (d). Cytokine concentrations are expressed as pg/mL, calculated from standard curves and are mean values ± S.E.M. of n = 3–4 technical replicates and n = 3 independent biological donors. Significance relative to stimulated, DMSO-treated control was determined by one-way ANOVA with Dunnett’s post-hoc test.

References

    1. Schwartz DM et al. JAK inhibition as a therapeutic strategy for immune and inflammatory diseases. Nat Rev Drug Discov 16, 843–862 (2017). - PubMed
    1. Hammarén HM, Virtanen AT, Raivola J & Silvennoinen O The regulation of JAKs in cytokine signaling and its breakdown in disease. Cytokine 118, 48–63 (2019). - PubMed
    1. Spinelli FR, Meylan F, O’Shea JJ & Gadina M JAK inhibitors: Ten years after. Eur. J. Immunol 51, 1615–1627 (2021). - PubMed
    1. Virtanen AT, Haikarainen T, Raivola J & Silvennoinen O Selective JAKinibs: prospects in inflammatory and autoimmune diseases. BioDrugs 33, 15–32 (2019). - PMC - PubMed
    1. Baxter EJ et al. Acquired mutation of the tyrosine kinase JAK2 in human myeloproliferative disorders. The Lancet 365, 1054–1061 (2005). - PubMed

Publication types