Clinical Trial
. 2023 Jan 5;146(1):50-64.
doi: 10.1093/brain/awac335.

Multimodal prediction of residual consciousness in the intensive care unit: the CONNECT-ME study

Affiliations
Clinical Trial

Multimodal prediction of residual consciousness in the intensive care unit: the CONNECT-ME study

Moshgan Amiri et al. Brain. .

Abstract

Functional MRI (fMRI) and EEG may reveal residual consciousness in patients with disorders of consciousness (DoC), as reflected by a rapidly expanding literature on chronic DoC. However, acute DoC is rarely investigated, although identifying residual consciousness is key to clinical decision-making in the intensive care unit (ICU). Therefore, the objective of the prospective, observational, tertiary centre cohort, diagnostic phase IIb study 'Consciousness in neurocritical care cohort study using EEG and fMRI' (CONNECT-ME, NCT02644265) was to assess the accuracy of fMRI and EEG to identify residual consciousness in acute DoC in the ICU. Between April 2016 and November 2020, 87 acute DoC patients with traumatic or non-traumatic brain injury were examined with repeated clinical assessments, fMRI and EEG. Resting-state EEG and EEG with external stimulations were evaluated by visual analysis, spectral band analysis and a Support Vector Machine (SVM) consciousness classifier. In addition, within- and between-network resting-state connectivity for canonical resting-state fMRI networks was assessed. Next, we used EEG and fMRI data at study enrolment in two different machine-learning algorithms (Random Forest and SVM with a linear kernel) to distinguish patients in a minimally conscious state or better (≥MCS) from those in coma or unresponsive wakefulness state (≤UWS) at time of study enrolment and at ICU discharge (or before death). Prediction performances were assessed with area under the curve (AUC). Of 87 DoC patients (mean age, 50.0 ± 18 years, 43% female), 51 (59%) were ≤UWS and 36 (41%) were ≥ MCS at study enrolment. Thirty-one (36%) patients died in the ICU, including 28 who had life-sustaining therapy withdrawn. EEG and fMRI predicted consciousness levels at study enrolment and ICU discharge, with maximum AUCs of 0.79 (95% CI 0.77-0.80) and 0.71 (95% CI 0.77-0.80), respectively. Models based on combined EEG and fMRI features predicted consciousness levels at study enrolment and ICU discharge with maximum AUCs of 0.78 (95% CI 0.71-0.86) and 0.83 (95% CI 0.75-0.89), respectively, with improved positive predictive value and sensitivity. Overall, both machine-learning algorithms (SVM and Random Forest) performed equally well. In conclusion, we suggest that acute DoC prediction models in the ICU be based on a combination of fMRI and EEG features, regardless of the machine-learning algorithm used.

Keywords: EEG; acute brain injury; disorders of consciousness; functional MRI; machine-learning.


Figures

Figure 1
Figure 1
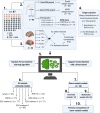
Flow chart and methods. (1) The study population consisted of 87 patients who were clinically classified according to their level of consciousness after ICU admission at study enrolment and ICU discharge (or prior to death). EEG was performed in 86 patients, fMRI in 64 patients and both EEG and fMRI in 63 patients (orange); in one patient (yellow) only fMRI was available and in 23 patients (dark grey) only EEG. (2) All EEGs were analysed using three different methods: manual visual analysis with grading according to the Synek scale; categorization according to the ABCD model based on spectral band power from centrally located EEG electrodes; automated classification using a SVM classifier based on 68 EEG markers from the whole EEG recording (EEG markers C), EEG markers R from resting-state EEG and EEG markers S from EEG with stimulations. (3) FMRI functional connectivity (FC) estimates were derived from six networks, resulting in six within-network and 15 between-network connectivity estimates. (4) Target outcomes to be predicted were consciousness levels at time of enrolment (DoCenrolment) and at time of ICU discharge (DoCdischarge). (5) Prediction performance of all EEG and fMRI features were analysed using two different machine-learning algorithms: Random Forest and Support Vector Machine (SVM). (6) First, prediction performance of each available feature with maximum available data was determined with unimodal models (results are presented in Table 2). (7) Then, for direct comparison of models, same-sample models based on data from 48 patients with all available features (i.e. all six EEG features and fMRI FC measures) were derived (results are given in Table 3). (8) Unimodal models I–VII were based on individual features. (9) Multimodal models VIII–XIV were based on different combinations of EEG and fMRI features (results shown in Table 3). (10) Finally, pairwise comparisons of the same-sample models were performed, with both machine-learning algorithms, separately (results given in Supplementary Figs 3 and 4). Figure created with BioRender.com.
Figure 2
Figure 2
Consciousness levels during ICU admission and relation to mortality in the ICU. Alluvial plot illustrating clinical classification of consciousness level of all patients (n = 87) at enrolment (DoCenrolment) and at discharge from ICU (alive or dead, DoCdischarge). Percentages of patients are depicted on the y-axis. As illustrated on the x-axis, median time between assessment of DoCenrolment and DoCdischarge was 16 days, while median time between DoCdischarge and death in ICU was 2 days. Distribution of patients according to DoCenrolment was: 24 (27.5%) coma, 27 (31.4%) UWS, 19 (21.8%) MCS−, 10 (11.5%) MCS+, two (2.3%) eMCS/CS and five (5.7%) LIS. Distribution of patients according to DoCdischarge was: 16 (18.4%) coma, 20 (23.0%) UWS, 20 (23.0%) MCS−, 11 (12.6%) MCS+, 13 (14.9%) LIS and seven (8.0%) eMCS/CS. In total 31 (35.6%) patients died in the ICU, of whom 28 (90.3%) were classified as coma/UWS at enrolment. In sum, the majority of deaths in ICU occurred in ≤UWS patients.
Figure 3
Figure 3
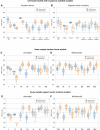
Unimodal models with maximum available data and same-sample models predicting levels of consciousness. Box plots illustrating model performances (AUCs) of Random Forest (A) and SVM (B) machine-learning models predicting DoCenrolment and DoCdischarge. Each model is based on the maximum amount of data available (see also Fig. 1, step 7). With the Random Forest models (A), the highest AUC for predicting DoCenrolment was obtained with the Synek categories (0.79; 95% CI 0.77–0.80), while the highest AUCs for predicting DoCdischarge were obtained with Synek categories (0.71; 95% CI 0.66–0.74), EEG markers C (0.71; 95% CI 0.64–0.76) and EEG markers R (0.71; 95% CI 0.63–0.76). With the SVM models (B), the highest AUCs for predicting DoCenrolment were obtained with fMRI functional connectivity (FC) measures (0.71; 95% CI 0.62–0.81) and Synek categories (0.70; 95% CI 0.68–0.71), while the highest AUCs for predicting DoCdischarge were obtained with the SVM classifier (0.69; 95% CI 0.62–0.75) and EEG markers R (0.68; 95% CI 0.60–0.78). (CF) show Random Forest (C and D) and SVM (E and F) same-sample unimodal (C and E: models I–VII) and multimodal (D and F: models VIII–XIV) model performances (AUCs) when models are based on data from the exactly same patients (n = 48) with all available features [e.g. fMRI FC + Synek category + ABCD category + SVM classification of EEG segments (see also Fig. 1, steps 8 and 9)]. Of the unimodal same-sample models (C), all models except the ABCD model (model II) could predict level of consciousness at both enrolment and discharge above chance level. All multimodal models (D) could predict level of consciousness at both enrolment and discharge above chance level. In sum, this figure shows that all multimodal models (VIII–XIV) performed well with narrow CIs in predicting both DoCenrolment (AUCs ≥ 0.70 in six of seven models) and DoCdischarge (AUCs ≥ 0.80 in five of seven models) (D), while the unimodal models (AC) in general performed with lower AUCs and wider CIs. A similar pattern was observed for SVM machine-learning models (E and F). Unimodal same-sample models: I = Synek, II = ABCD, III = EEG markers C, IV = EEG markers R, V = EEG markers S, VI = SVM and VII = fMRI FC. Multimodal same-sample models: VIII = fMRI FC + EEG markers C, IX = fMRI FC + EEG markers R, X = fMRI FC + markers S, XI = fMRI FC + Synek + ABCD + SVM, XII = Synek + ABCD + SVM, XIII = Synek + ABCD + SVM + EEG markers C and XIV = fMRI FC + Synek + ABCD + SVM + EEG markers C.
Figure 4
Figure 4
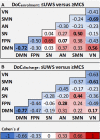
FMRI resting-state connectivity and association with levels of consciousness. Cohen’s d effect size of resting-state network connectivity estimates in ≤UWS patients compared to ≥MCS patients at enrolment (A) and ICU discharge (B). At both study enrolment (A) and ICU discharge (B), a pattern of decreased DMN within-network connectivity and increased between-network connectivity is seen in ≤UWS patients compared to ≥MCS patients. Tiles are colour-coded according to increasing/decreasing effect size from 0. Bold values indicate statistical significance with unadjusted P-values (Enrolment: DMN–DMN: P = 0.007, DMN–VN: P = 0.034, FPN–AN P = 0.009, SN–SMN: P = 0.047, SMN–VN: P = 0.006; ICU discharge: DMN–DMN: P = 0.001, VN–VN: P = 0.010, FPN–VN: P = 0.049, SMN–VN: P = 0.030) when comparing ≤UWS to ≥MCS patients.
Figure 5
Figure 5
FMRI resting-state connectivity in ≤UWS patients with favourable EEG features. Cohen’s d effect size of fMRI resting-state network connectivity estimates in patients classified as ≤UWS at enrolment with unfavourable EEG (EEG-) features compared to ≤UWS patients with favourable EEG (EEG+) features. In ≤UWS patients with unfavourable EEG features, the DMN within-network connectivity was decreased compared to ≤UWS patients with favourable EEG features. Tiles are colour-coded according to increasing/decreasing effect size from 0.

Comment in

References

    1. Majdan M, Plancikova D, Brazinova A, et al. . Epidemiology of traumatic brain injuries in Europe: A cross-sectional analysis. Lancet Public Health. 2016;1:e76–e83. - PubMed
    1. Rosenfeld JV, Maas AI, Bragge P, Morganti-Kossmann MC, Manley GT, Gruen RL. Early management of severe traumatic brain injury. Lancet. 2012;380:1088–1098. - PubMed
    1. Schnakers C, Vanhaudenhuyse A, Giacino J, et al. . Diagnostic accuracy of the vegetative and minimally conscious state: Clinical consensus versus standardized neurobehavioral assessment. BMC Neurol. 2009;9:35. - PMC - PubMed
    1. Kondziella D, Frontera JA. Pearls & Oy-sters: eyes-open coma. Neurology. 2021;96:864–867. - PubMed
    1. Turgeon AF, Lauzier F, Simard JF, et al. . Mortality associated with withdrawal of life-sustaining therapy for patients with severe traumatic brain injury: A Canadian multicentre cohort study. CMAJ. 2011;183:1581–1588. - PMC - PubMed

Publication types

Associated data