. 2022 Sep 1;149(17):dev200610.
doi: 10.1242/dev.200610. Epub 2022 Sep 13.

Mural Wnt/β-catenin signaling regulates Lama2 expression to promote neurovascular unit maturation

Affiliations

Mural Wnt/β-catenin signaling regulates Lama2 expression to promote neurovascular unit maturation

Saptarshi Biswas et al. Development. .

Abstract

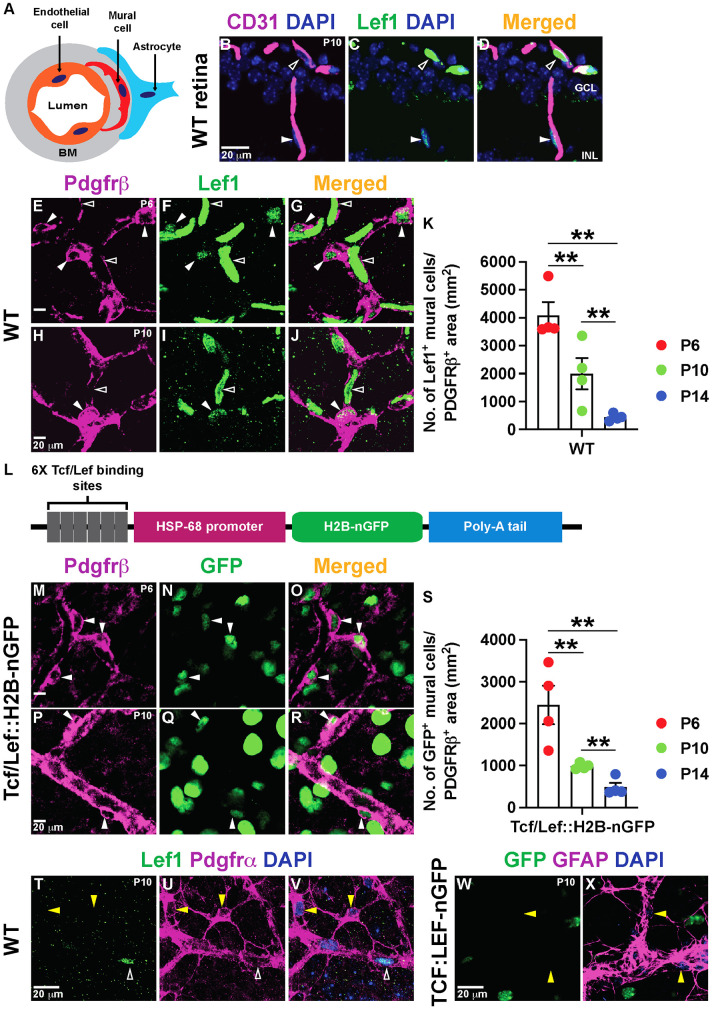
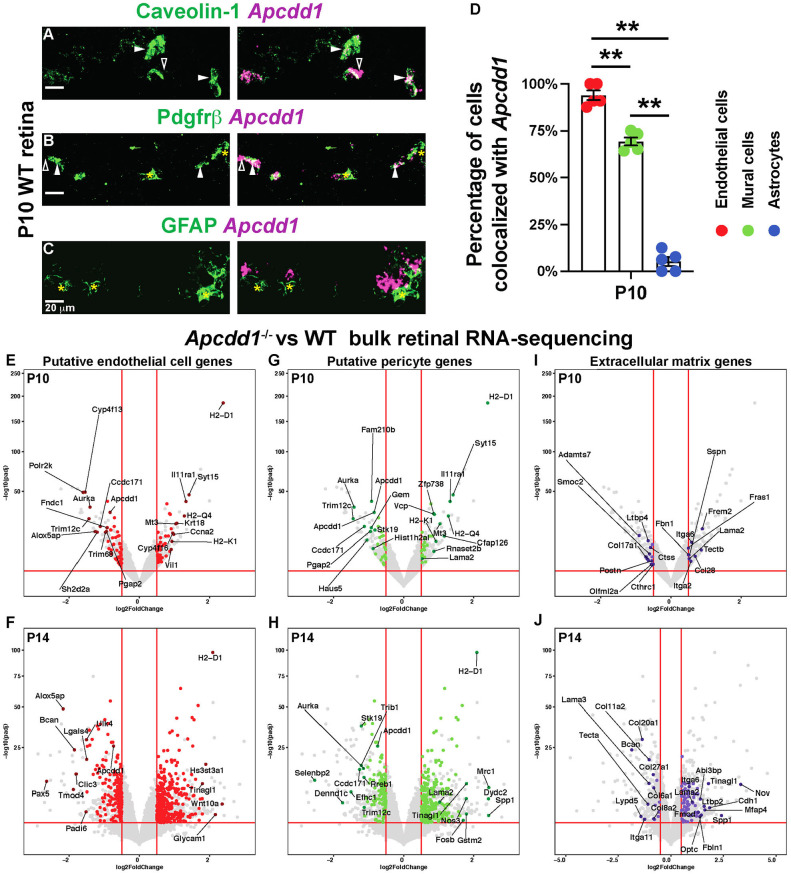
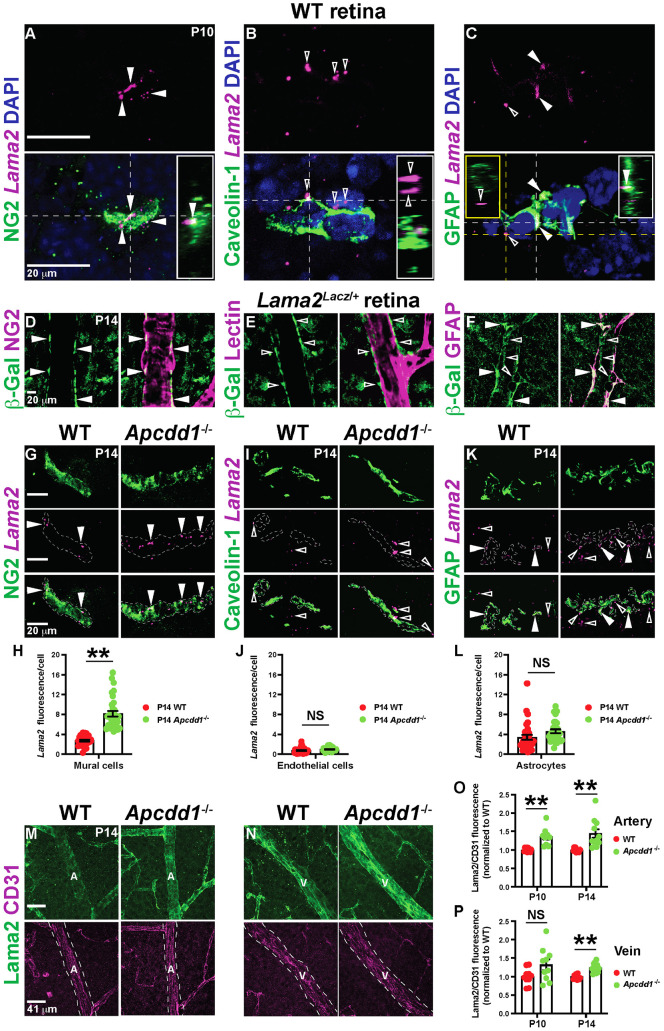
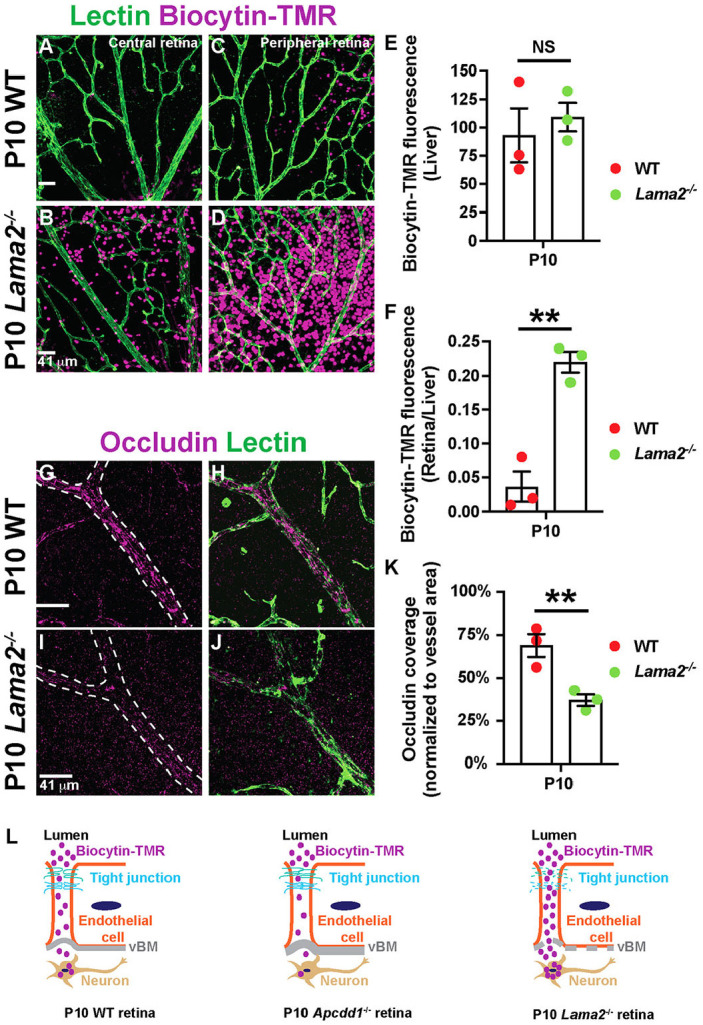
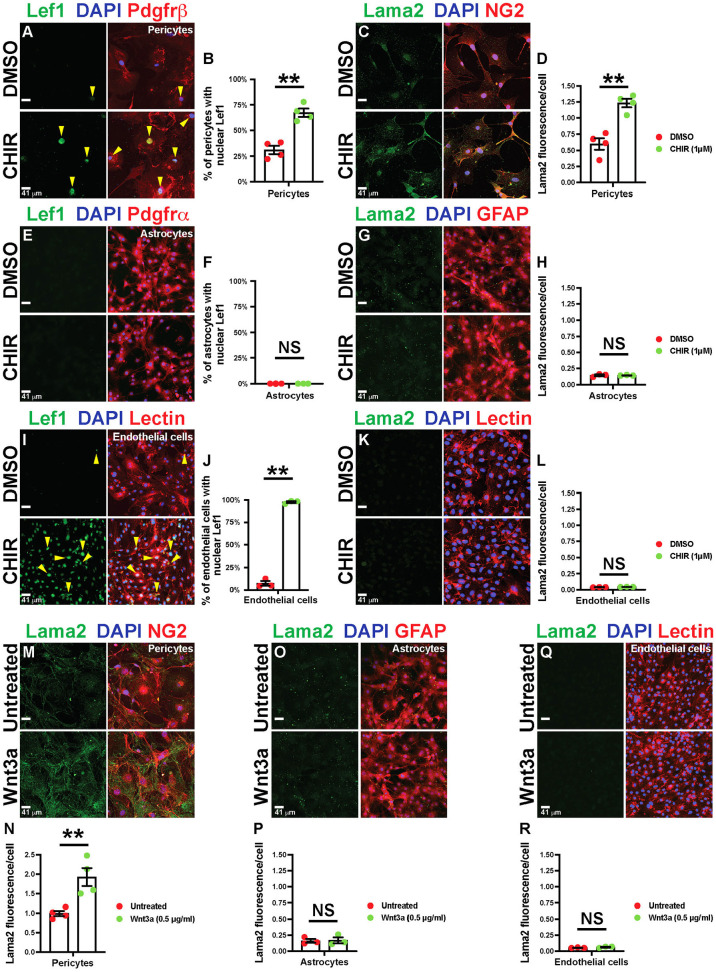
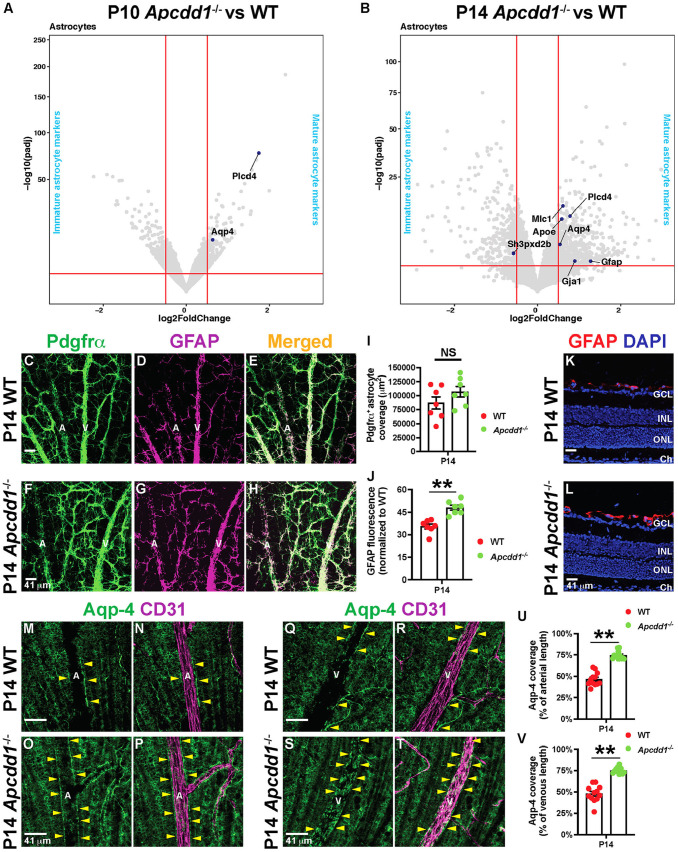
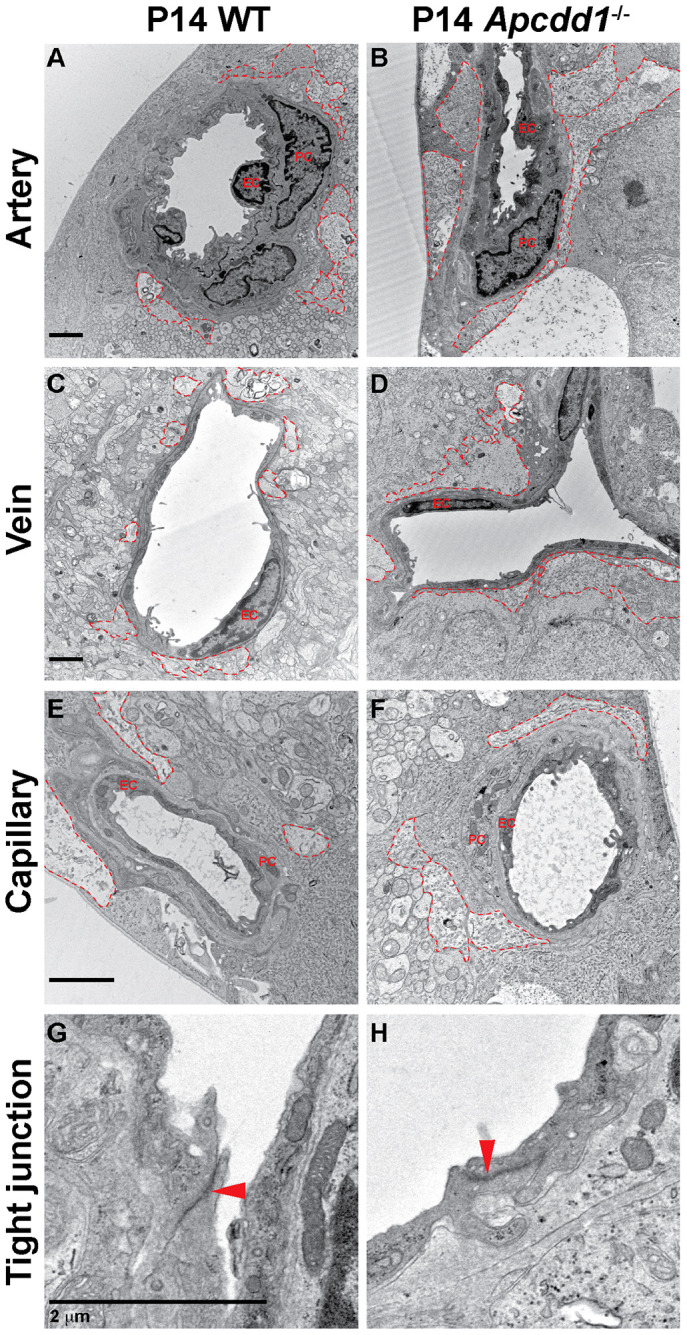
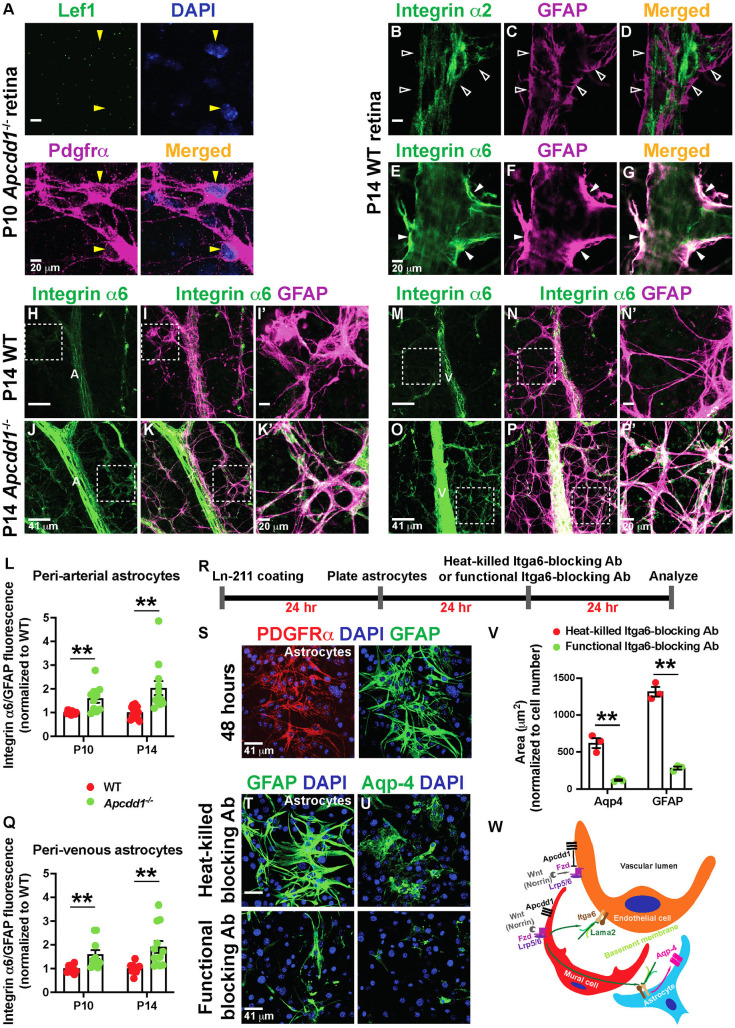
Neurovascular unit and barrier maturation rely on vascular basement membrane (vBM) composition. Laminins, a major vBM component, are crucial for these processes, yet the signaling pathway(s) that regulate their expression remain unknown. Here, we show that mural cells have active Wnt/β-catenin signaling during central nervous system development in mice. Bulk RNA sequencing and validation using postnatal day 10 and 14 wild-type versus adenomatosis polyposis coli downregulated 1 (Apcdd1-/-) mouse retinas revealed that Lama2 mRNA and protein levels are increased in mutant vasculature with higher Wnt/β-catenin signaling. Mural cells are the main source of Lama2, and Wnt/β-catenin activation induces Lama2 expression in mural cells in vitro. Markers of mature astrocytes, including aquaporin 4 (a water channel in astrocyte endfeet) and integrin-α6 (a laminin receptor), are upregulated in Apcdd1-/- retinas with higher Lama2 vBM deposition. Thus, the Wnt/β-catenin pathway regulates Lama2 expression in mural cells to promote neurovascular unit and barrier maturation.

Keywords: Blood–retinal barrier; Canonical Wnt signaling; Laminin; Mural cell; Retina; Vascular basement membrane.


Conflict of interest statement

Competing interests The authors declare no competing or financial interests.

Figures

Fig. 1.
Fig. 1.
Retinal vascular mural cells have active Norrin/β-catenin signaling. (A) Schematic of the cell types in the NVU. The vBM is depicted in gray. (B-D) P10 WT retinal sections stained for Lef1 (green) and CD31 (magenta). Unfilled arrowheads indicate Lef1+ ECs and filled arrowheads indicate Lef1+ cells next to the ECs in the ganglion cell layer (GCL) and inner nuclear layer (INL). (E-J) Lef1+ ECs (unfilled arrowheads) and Lef1+ mural cells (filled arrowheads) in WT retinal flat-mounts stained for Lef1 (green) and Pdgfrβ (magenta). (K) Lef1+ mural cell numbers in the retina at three developmental time-points (n=4/mice per time point). (L) Schematic of the Tcf/Lef::H2B-nGFP transgene. (M-R) Tcf/Lef::H2B-nGFP retinal flat-mounts labeled for GFP (green) and Pdgfrβ (magenta). Filled arrowheads indicate GFP+ mural cells. (S) GFP+ mural cell numbers in the retina at the indicated developmental time-points (n=4/mice per time point). (T-V) P10 WT retinal flat-mounts stained for Lef1, Pdgfrα and DAPI. Yellow arrowheads indicate Lef1 astrocytes. Unfilled arrowheads indicate Lef1+ ECs. (W,X) P10 Tcf/Lef::H2B-nGFP retinal flat-mounts stained for GFP, GFAP and DAPI. Yellow arrowheads indicate GFP astrocytes. Data are mean±s.e.m., analyzed with one-way ANOVA with Bonferroni corrections: **P<0.02.
Fig. 2.
Fig. 2.
Apcdd1 is expressed in both retinal ECs and PCs and Lama2 expression is increased in Apcdd1−/− retinas. (A-C) FISH of P10 WT retinal sections with antisense mRNA probes against Apcdd1 (magenta) followed by immunostaining for caveolin 1, Pdgfrβ or GFAP (green). Filled arrowheads, asterisks and unfilled arrowheads indicate Apcdd1 inside the cell, Apcdd1 cells and Apcdd1 outside the cell, respectively. (D) Fraction of Apcdd1+ ECs, mural cells and astrocytes in the retina (n=4 mice). (E-J) Volcano plots of putative EC (E,F: red dots), PC (G,H: green dots) and ECM (I,J; purple dots) genes differentially expressed between P10 and P14 Apcdd1−/− and WT retinas. Genes above the horizontal red lines are those with significantly different expression in Apcdd1−/− retinas. Genes to the right of vertical red lines are significantly upregulated, whereas those to the left are significantly downregulated in Apcdd1−/− retinas. The most differentially expressed genes are named. Data are mean±s.e.m., analyzed with two-tailed unpaired Student's t-test: **P<0.02.
Fig. 3.
Fig. 3.
Lama2 expression in mural cells and Lama2 deposition to the vBM is increased in Apcdd1−/− retinas. (A-C) FISH of P10 WT retinal sections with antisense probes against Lama2 (magenta) followed by immunostaining for NG2, caveolin 1 or GFAP (green) and DAPI (blue). Filled and unfilled arrowheads indicate Lama2 expression inside and outside cells, respectively. Insets show orthogonal projections of the area intersected by corresponding colored lines. (D-F) P14 Lama2lacZ/+ retinal flat-mounts stained for β-Gal and either NG2, lectin or GFAP. Filled and unfilled arrowheads indicate β-Gal localization inside and outside the cell, respectively. (G,I,K) FISH of P14 WT and Apcdd1−/−retinal sections with antisense probes against Lama2 (magenta) followed by immunostaining for NG2, caveolin 1 or GFAP (green). Filled and unfilled arrowheads indicate Lama2 localization inside and outside the cell, respectively. (H,J,L) Lama2 M.F.I. within each cell marker between WT and Apcdd1−/− retinas (32 fields from n=4 mice/genotype). (M,N) P14 WT and Apcdd1−/− retinal flat-mounts stained for Lama2 and CD31. Arteries (A) and veins (V) are outlined by dashed white lines. (O,P) Ratio of Lama2/CD31 M.F.I. in arteries and veins normalized to the WT average values at P10 and P14 (ten arteries or veins from n=5 mice/genotype). Data are mean±s.e.m., analyzed with two-tailed unpaired Student's t-test: NS, not significant, **P<0.02.
Fig. 4.
Fig. 4.
Paracellular BRB permeability is increased in Lama2−/− retinas. (A-D) P10 WT and Lama2−/− retinal flat-mounts, injected with biocytin-TMR, stained for lectin. (E,F) Biocytin-TMR M.F.I. in the liver parenchyma (E) and the ratio of biocytin-TMR fluorescence intensities in the retina versus liver parenchyma (F) (n=3 mice/genotype). (G-J) P10 WT and Lama2−/− retinal flat-mounts stained for occludin and lectin. (K) Occludin coverage of blood vessels (n=3 mice/genotype). (L) Schematic of paracellular biocytin-TMR extravasation in WT, Apcdd1−/− and Lama2−/− retinas. Data are mean±s.e.m., analyzed with two-tailed unpaired Student's t-test: NS, not significant, **P<0.02.
Fig. 5.
Fig. 5.
Wnt/β-catenin activation upregulates Lama2 expression in PCs, but not in astrocytes and ECs. (A-L) Primary mouse brain PCs, astrocytes and ECs treated with either DMSO or CHIR99021 (CHIR), followed by staining for Lef1, DAPI and either Pdgfrβ, Pdgfrα or lectin (A,E,I), or Lama2, DAPI and either NG2, GFAP or lectin (C,G,K). Yellow arrowheads indicate Lef1+ nuclei. B,F,J show percentage of cells with nuclear Lef1 expression. H,J,L show quantification of Lama2 expression by corresponding cell types. (M-R) Untreated or recombinant Wnt3a-treated primary mouse brain PCs, astrocytes and ECs stained for Lama2, DAPI and then NG2 (M), GFAP (O) or lectin (Q). N,P,R show the quantification of Lama2 expression by various cell types. n=3 or 4 independent experiments; Data are mean±s.e.m., analyzed with two-tailed unpaired Student's t-test: NS, not significant, **P<0.02.
Fig. 6.
Fig. 6.
Apcdd1−/− retinas show precocious astrocyte maturation and endfeet polarization. (A,B) Volcano plots of statistically significant differentially expressed astrocyte maturation genes (dark blue dots) between Apcdd1−/− and WT retinas at P10 and P14. Conventions as outlined in Fig. 2E-J. (C-H) P14 WT and Apcdd1−/− retinal flat-mounts stained for Pdgfrα (all astrocytes) and GFAP (mature astrocytes). (I,J) Pdgfrα+ astrocyte coverage (I) and GFAP M.F.I. (J) (n=7 mice/genotype). (K,L) P14 WT (K) and Apcdd1−/− (L) retinal sections stained for GFAP and DAPI. (M-T) P14 WT and Apcdd1−/− retinal flat-mounts stained for Aqp4 and CD31 in arteries (M-P) and veins (Q-T). A, artery; V, vein. Yellow arrowheads indicate Aqp4+ astrocyte endfeet around blood vessels. (U,V) Percentage of vascular length surrounded by Aqp4+ astrocyte endfeet (12 arteries or veins from n=6 mice/group). Data are mean±s.e.m., analyzed with two-tailed unpaired Student's t-test: NS, not significant, **P<0.02.
Fig. 7.
Fig. 7.
Apcdd1−/− retinal vessels have more extensive astrocyte endfeet coverage at the electron microscopy level compared with wild type. (A-F) TEM analyses of astrocyte endfeet coverage (red outlines) around the WT (A,C,E) and Apcdd1−/− (B,D,F) retinal superficial blood vessels show more-extensive endfeet coverage of arteries and veins in Apcdd1−/− retinas. (G,H) Ultrastructural analysis of endothelial tight junctions (red arrowheads) shows no obvious difference between WT and Apcdd1−/− retinas.
Fig. 8.
Fig. 8.
Astrocytic Itga6 expression is upregulated in Apcdd1−/− retinas. (A) P10 Apcdd1−/− retinal flat-mounts stained for Lef1, Pdgfrα and DAPI. Yellow arrowheads indicate Lef1 astrocytes. (B-G) P14 WT retinal flat-mounts stained for either integrin-α2 (B-D) or Itga6 (E-G) and GFAP. Unfilled arrowheads indicate the lack of integrin-α2 expression in astrocytes. Filled arrowheads indicate Itga6 expression in astrocytes. (H-Q) P14 WT and Apcdd1−/− retinal flat-mounts stained for Itga6 and GFAP in arteries (H-K′) and veins (M-P′). A, artery; V, vein. Corresponding boxed areas are magnified in I′,K′,N′,P′. Ratio of Itga6/GFAP M.F.I. in peri-arterial (L) and perivenous (Q) astrocytes, normalized to WT average values (ten arteries from n=5 mice/group at P10 and 12 arteries from n=6 mice/group at P14). (R-U) Primary mouse brain astrocytes were cultured on laminin-211-coated plates in the presence of either Itga6-blocking antibodies (Abs) or heat-killed Itga6-blocking Abs (control), and stained for Pdgfrα, GFAP, Aqp4 and DAPI. (V) GFAP+ and Aqp4+ astrocyte area (n=3 independent experiments). (W) Proposed model by which mural Wnt/β-catenin signaling regulates Lama2 deposition to the vBM and NVU maturation (see Discussion). Data are mean±s.e.m., analyzed with two-tailed unpaired Student's t-test: **P<0.02.

References

    1. Armulik, A., Genove, G., Mae, M., Nisancioglu, M. H., Wallgard, E., Niaudet, C., He, L., Norlin, J., Lindblom, P., Strittmatter, K.et al. (2010). Pericytes regulate the blood-brain barrier. Nature 468, 557-561. 10.1038/nature09522 - DOI - PubMed
    1. Baeten, K. M. and Akassoglou, K. (2011). Extracellular matrix and matrix receptors in blood-brain barrier formation and stroke. Dev. Neurobiol. 71, 1018-1039. 10.1002/dneu.20954 - DOI - PMC - PubMed
    1. Biswas, S., Watters, J., Bachay, G., Varshney, S., Hunter, D. D., Hu, H. and Brunken, W. J. (2018). Laminin-dystroglycan signaling regulates retinal arteriogenesis. FASEB J. 32, 6261-6273. 10.1096/fj.201800232R - DOI - PMC - PubMed
    1. Biswas, S., Cottarelli, A. and Agalliu, D. (2020). Neuronal and glial regulation of CNS angiogenesis and barriergenesis. Development 147, dev182279. 10.1242/dev.182279 - DOI - PMC - PubMed
    1. Chen, J., Stahl, A., Krah, N. M., Seaward, M. R., Joyal, J.-S., Juan, A. M., Hatton, C. J., Aderman, C. M., Dennison, R. J., Willett, K. L.et al. (2012). Retinal expression of Wnt-pathway mediated genes in low-density lipoprotein receptor-related protein 5 (Lrp5) knockout mice. PLoS One 7, e30203. 10.1371/journal.pone.0030203 - DOI - PMC - PubMed

Publication types