. 2022 Nov 2;12(11):2626-2645.
doi: 10.1158/2159-8290.CD-21-1658.

The Single-Cell Immunogenomic Landscape of B and Plasma Cells in Early-Stage Lung Adenocarcinoma

Affiliations

The Single-Cell Immunogenomic Landscape of B and Plasma Cells in Early-Stage Lung Adenocarcinoma

Dapeng Hao et al. Cancer Discov. .

Abstract

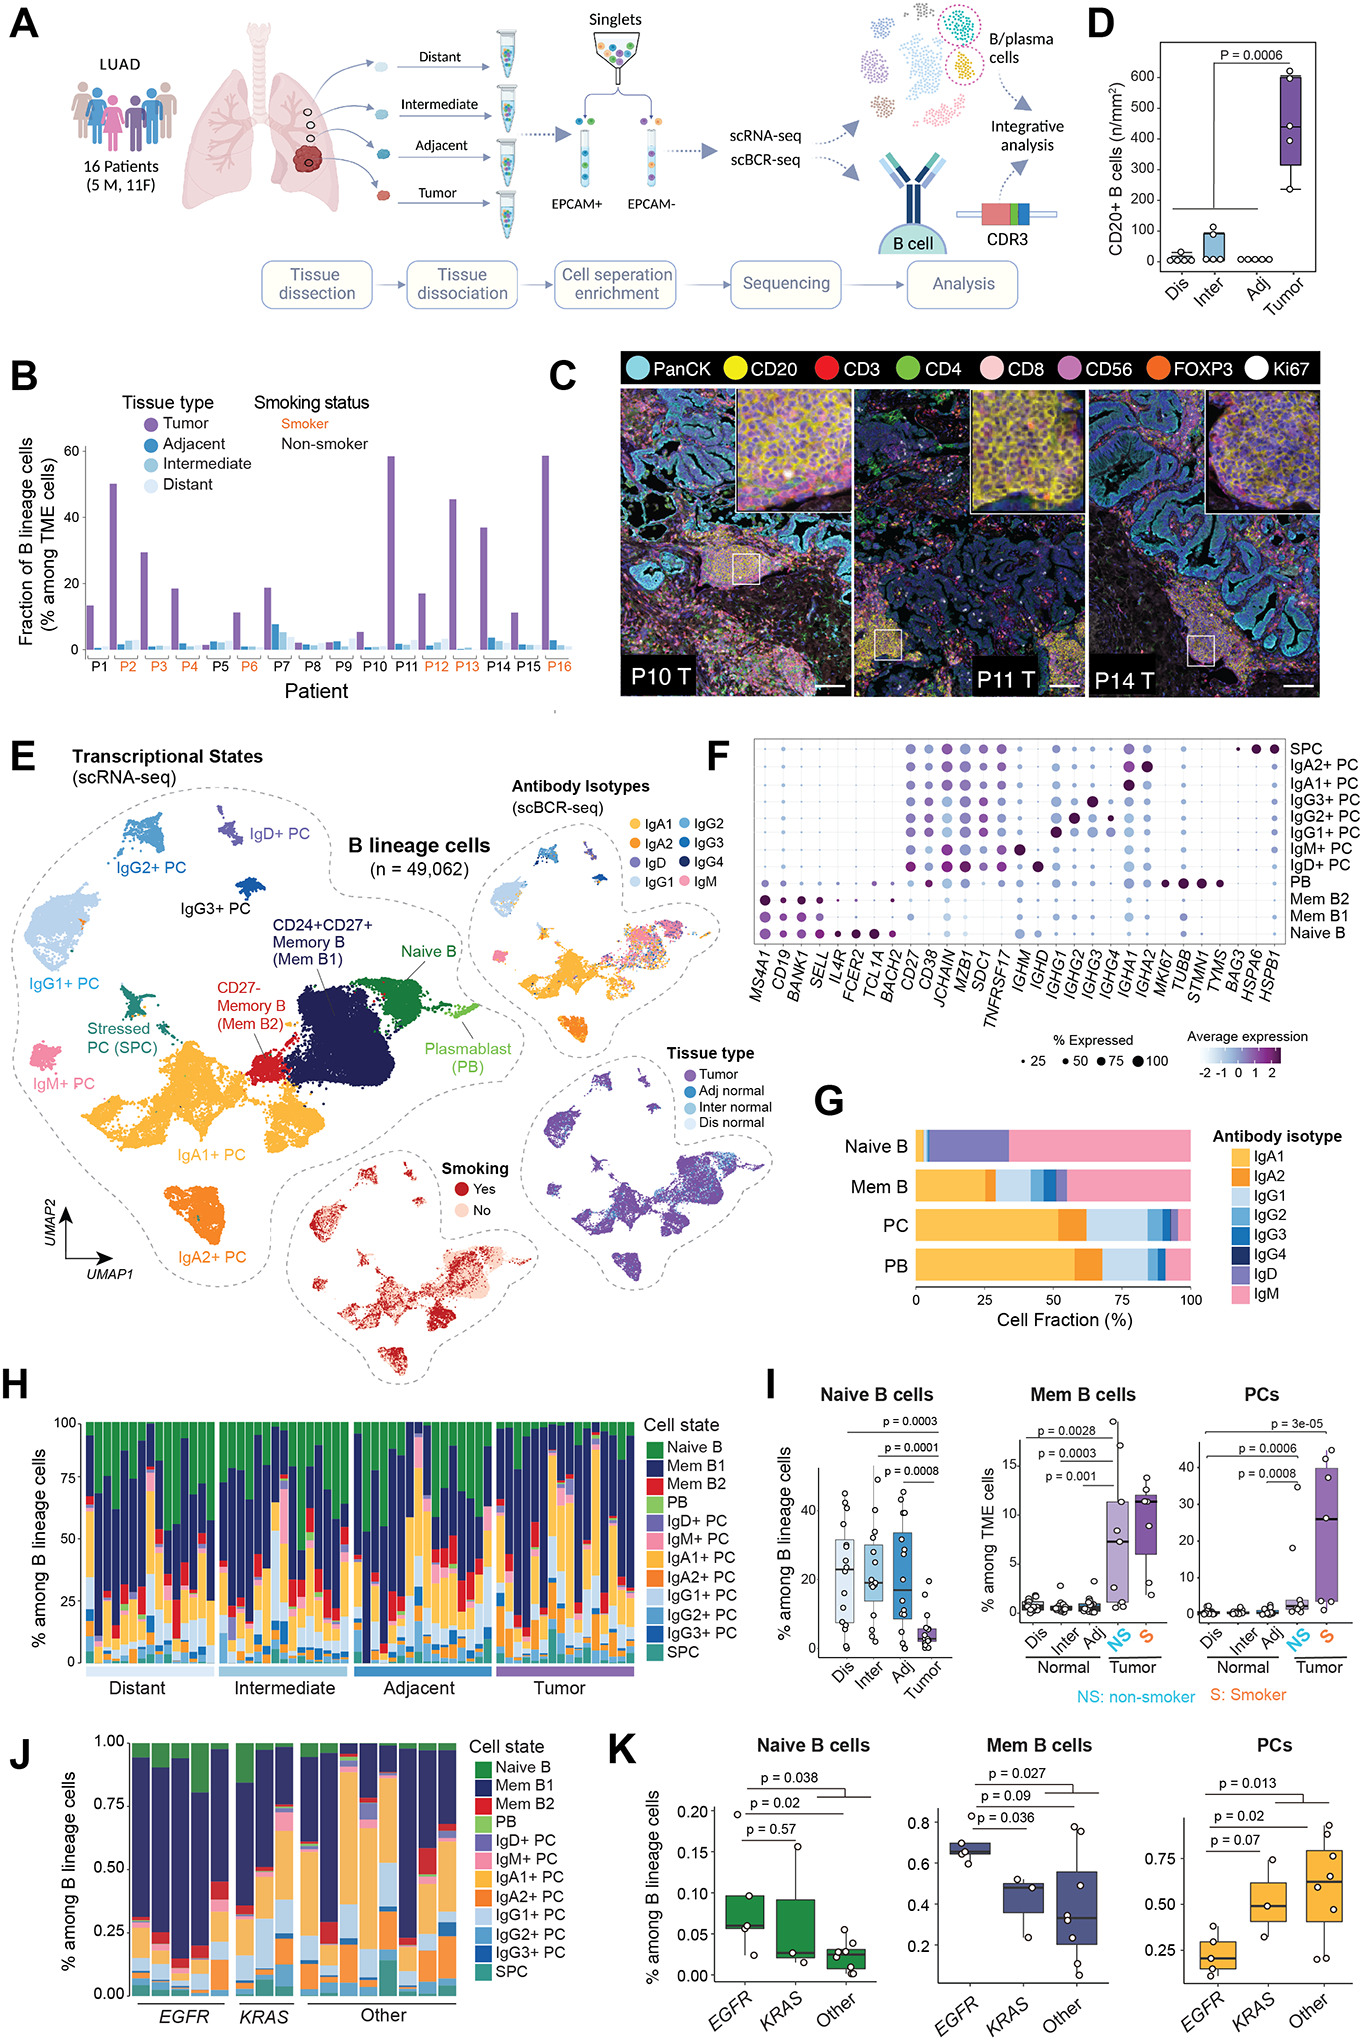
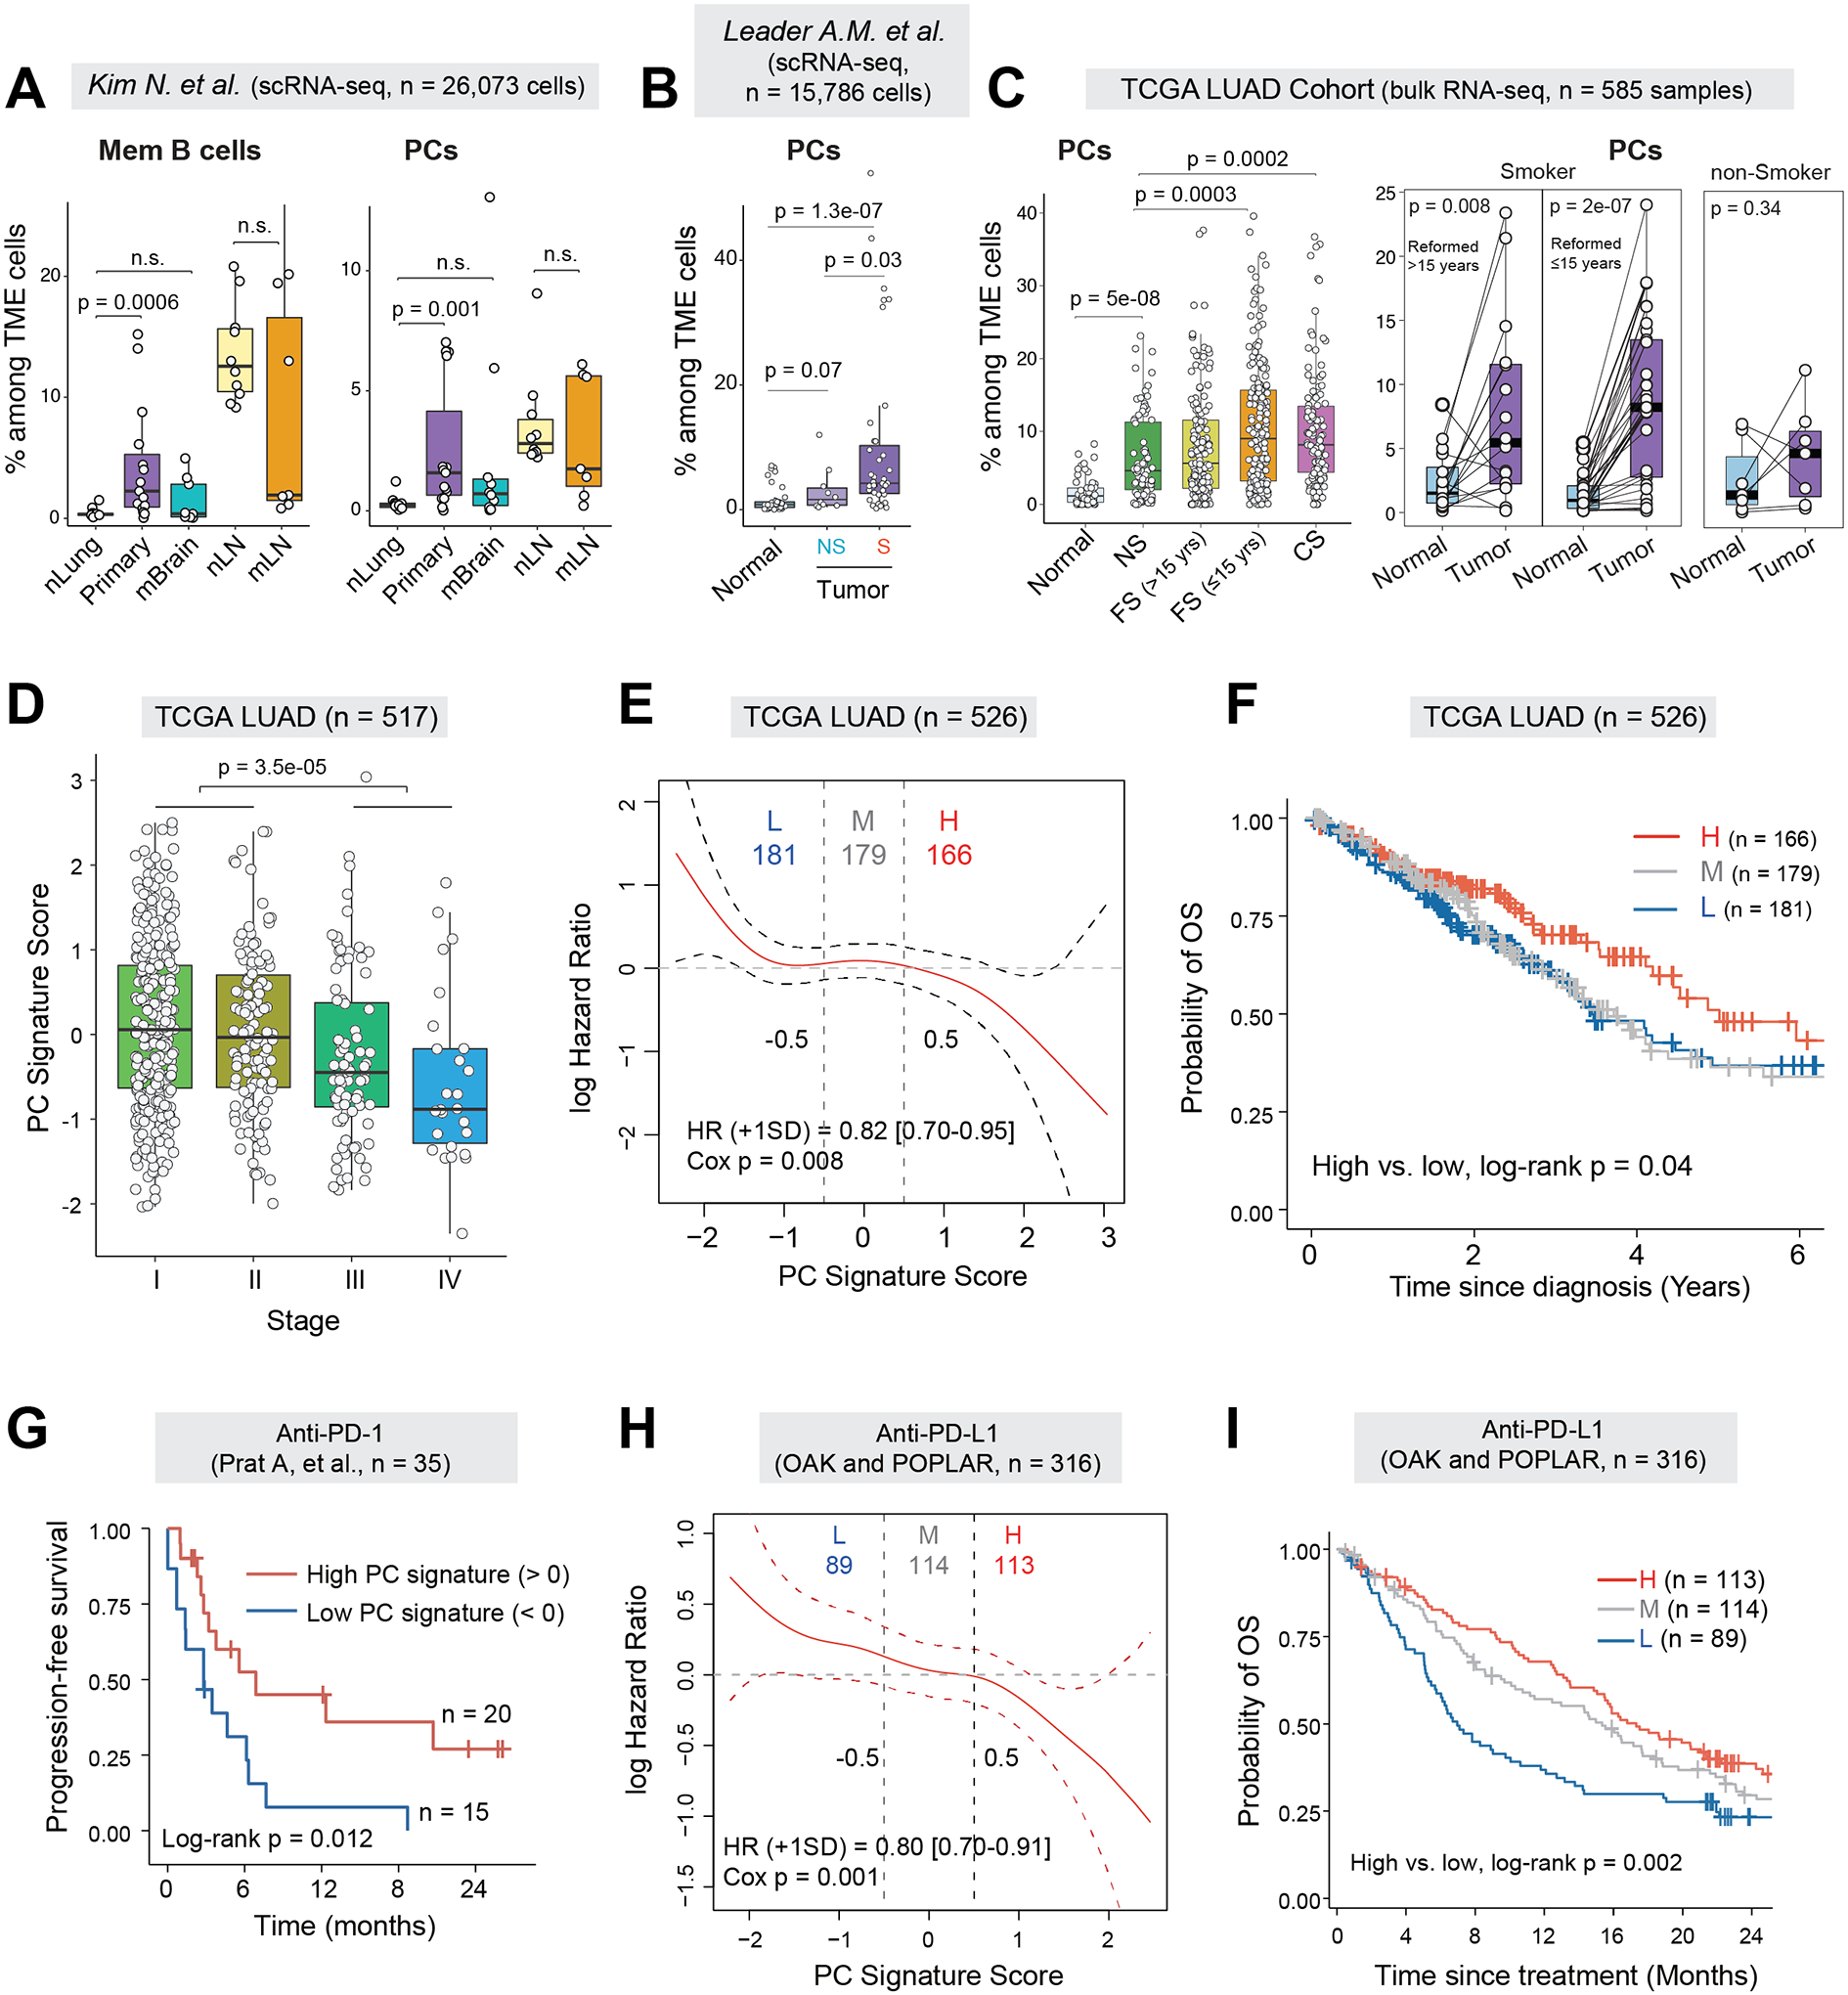
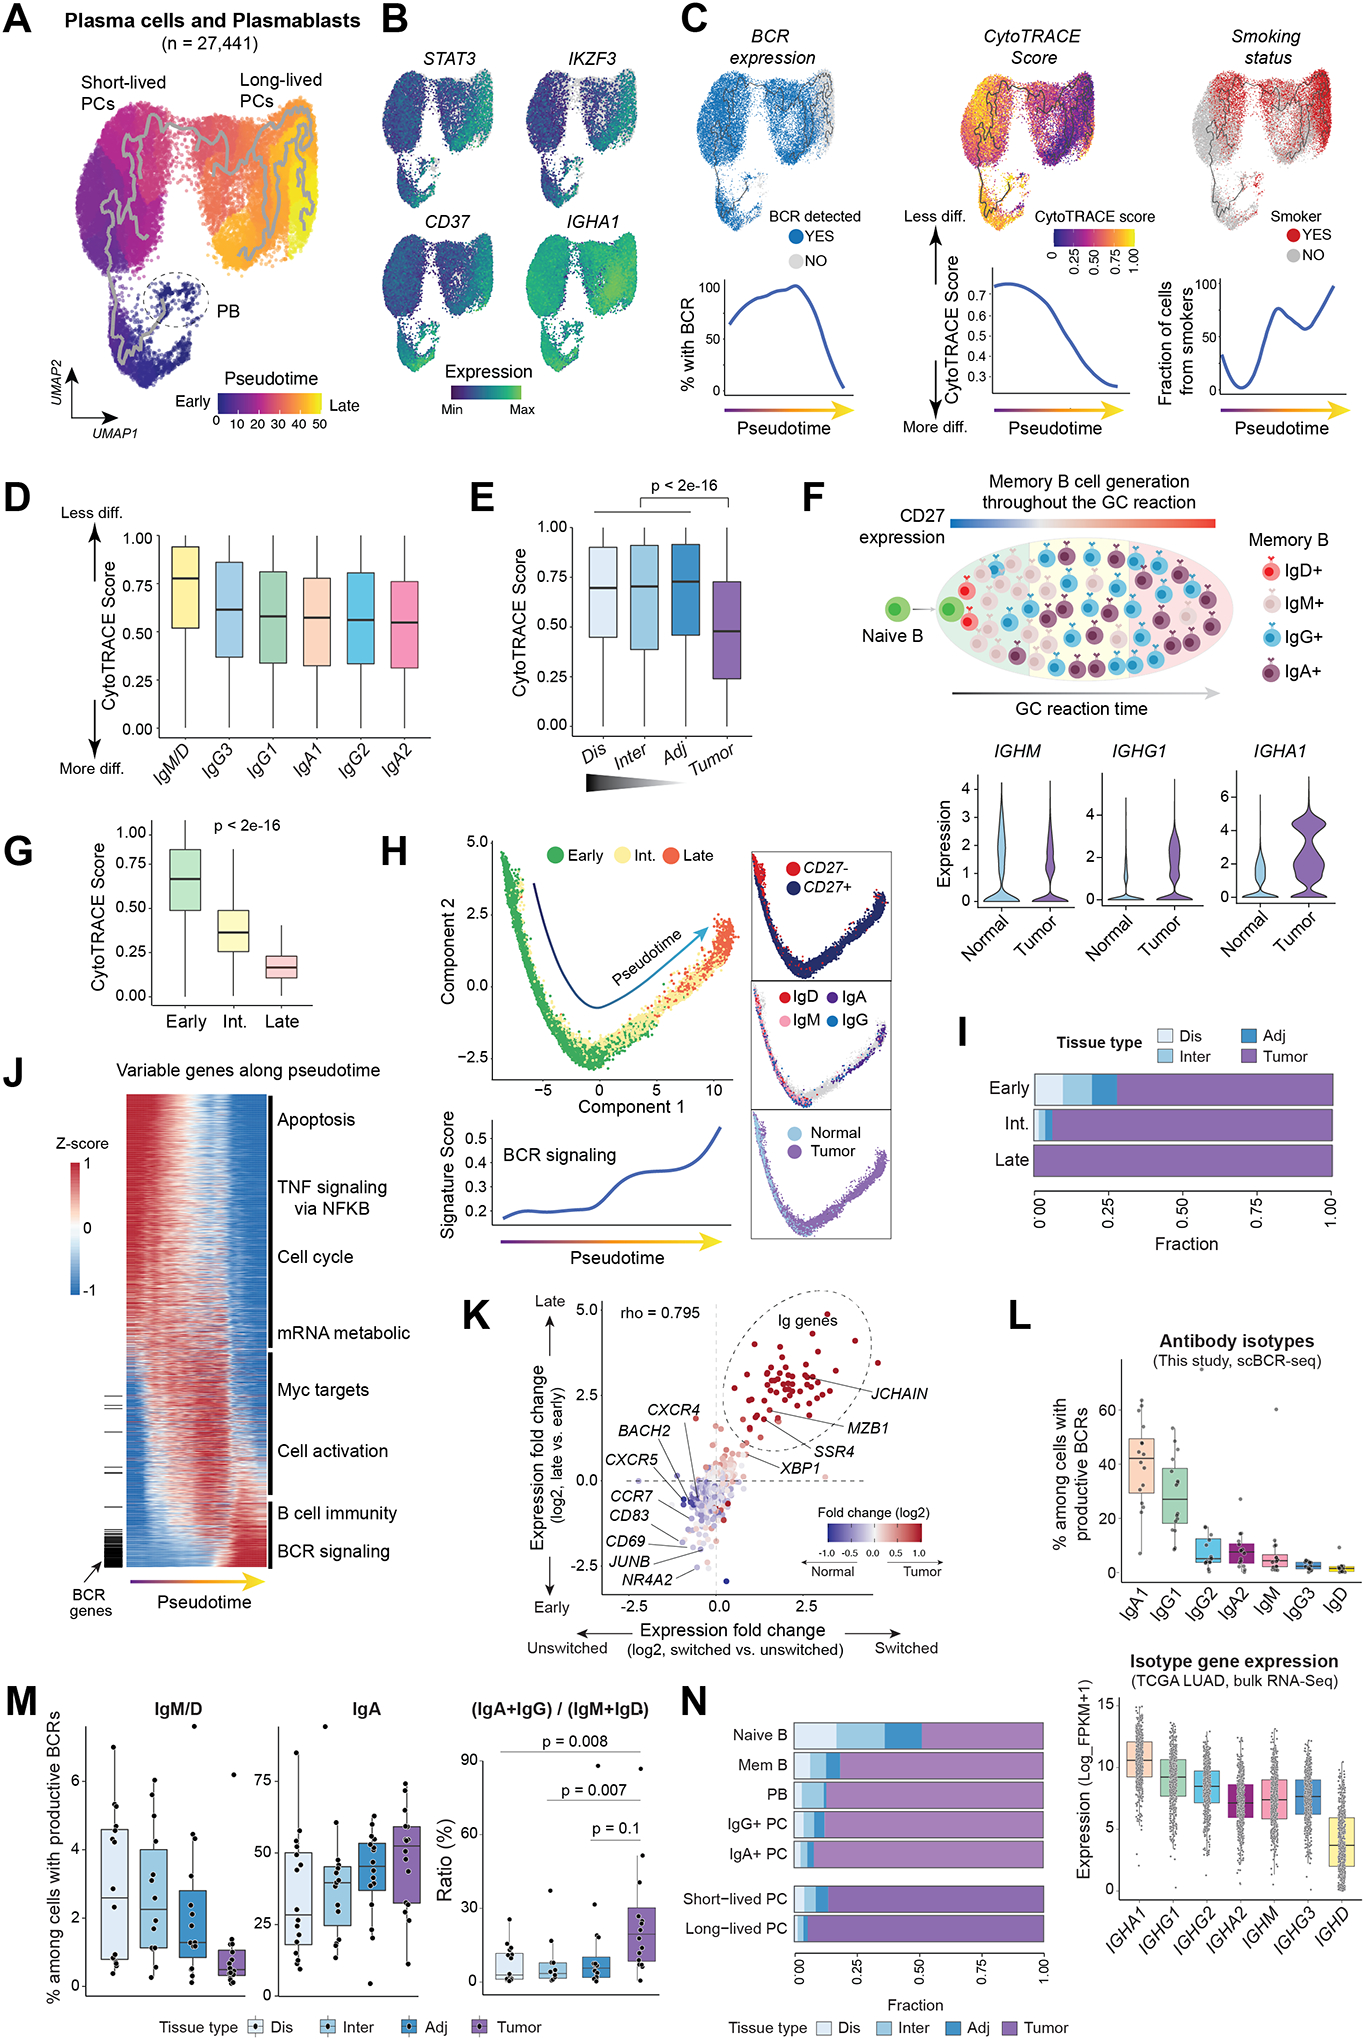
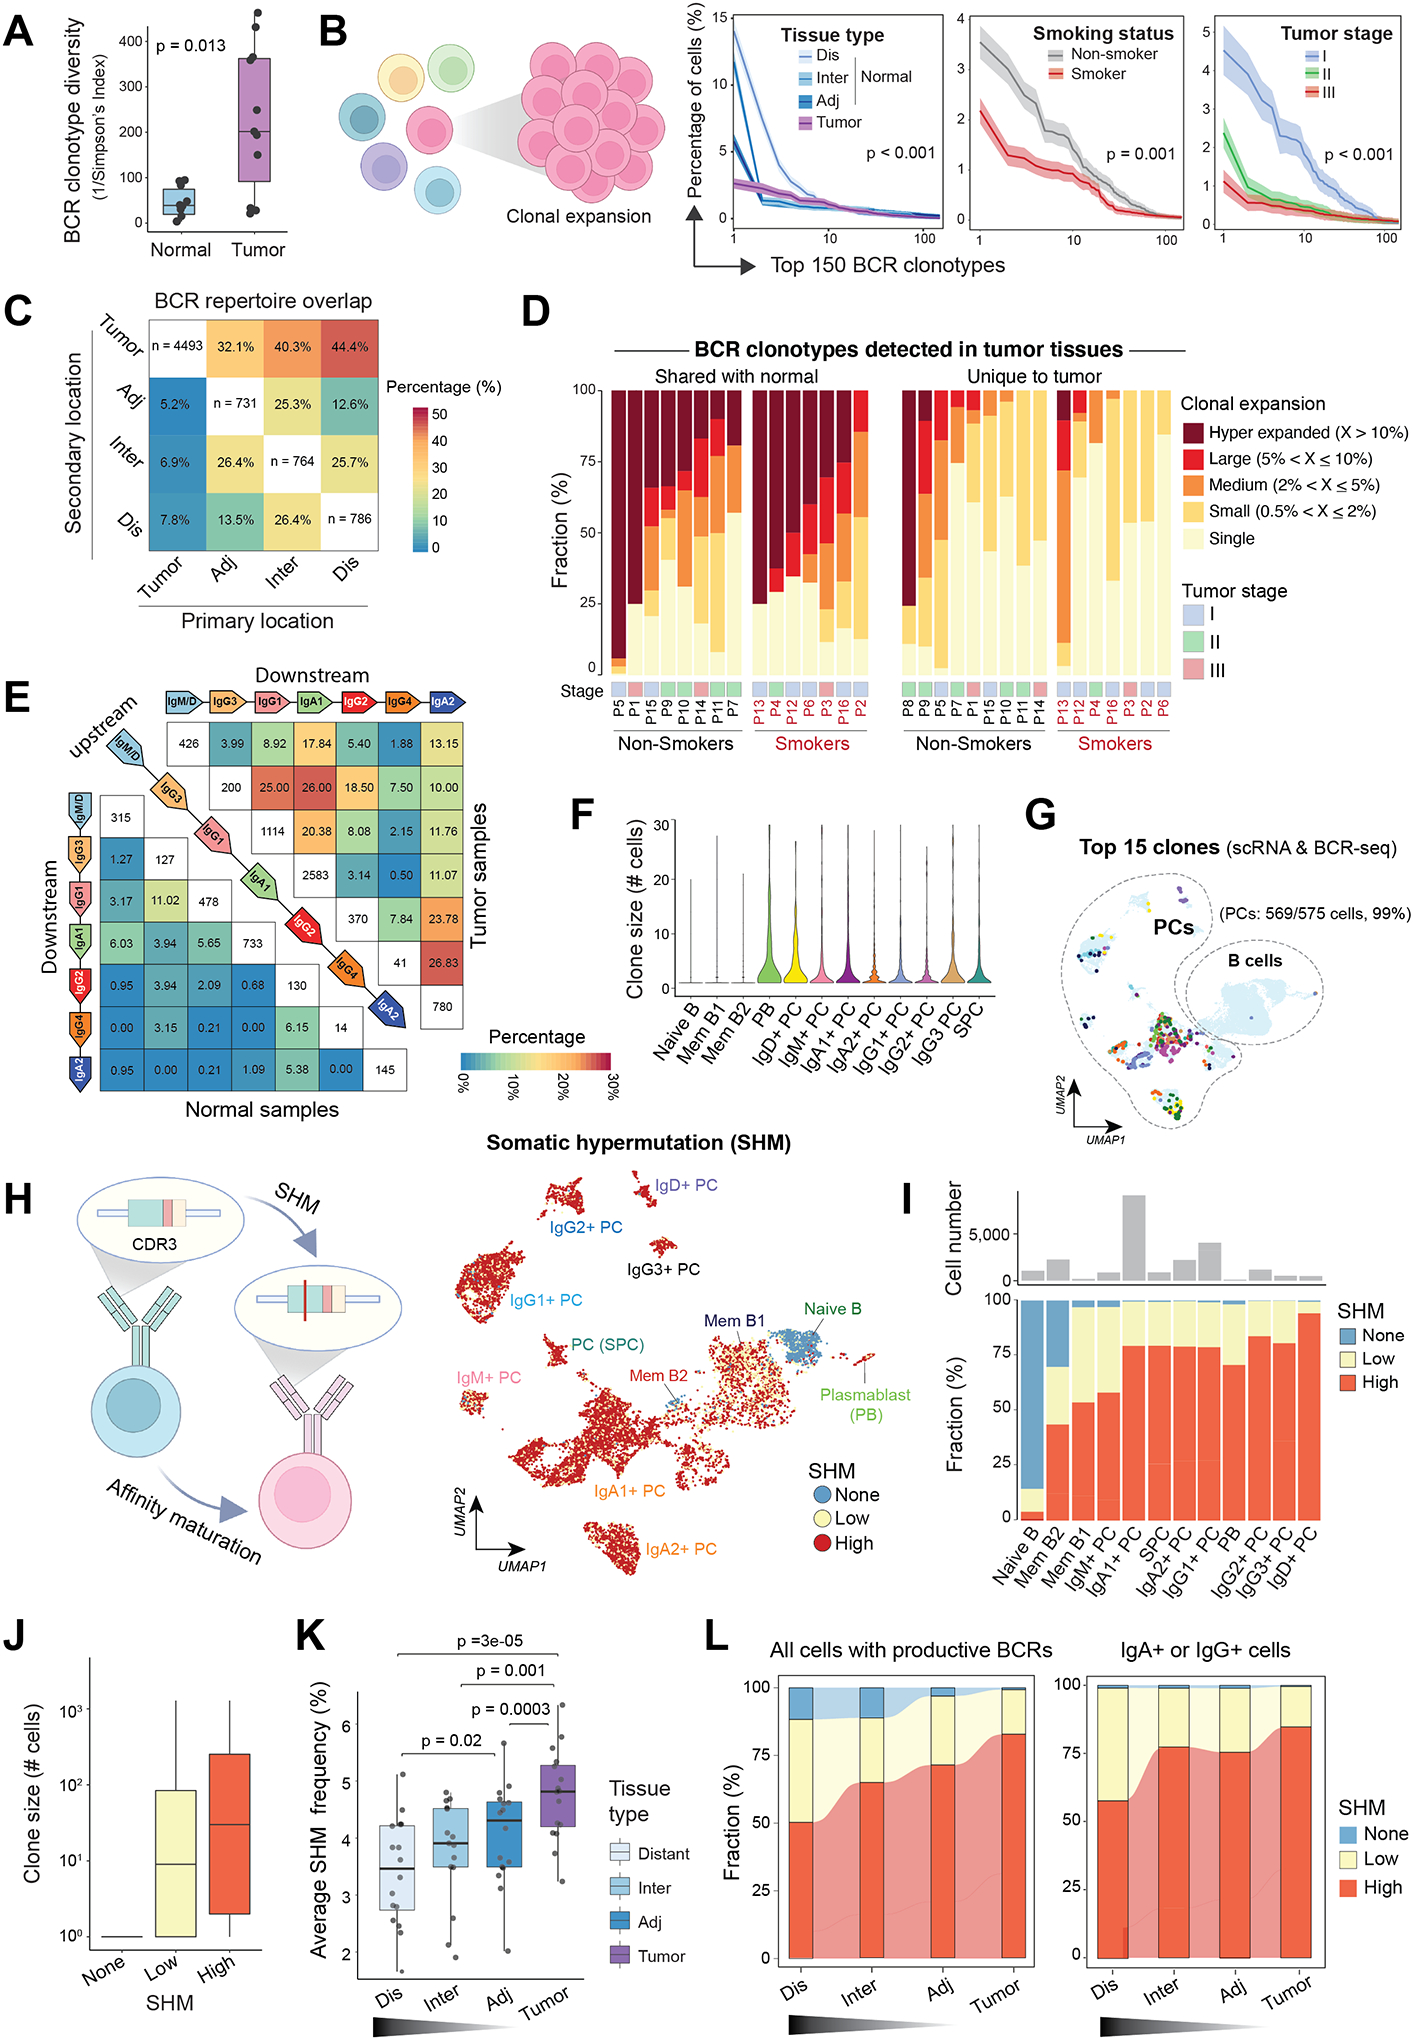
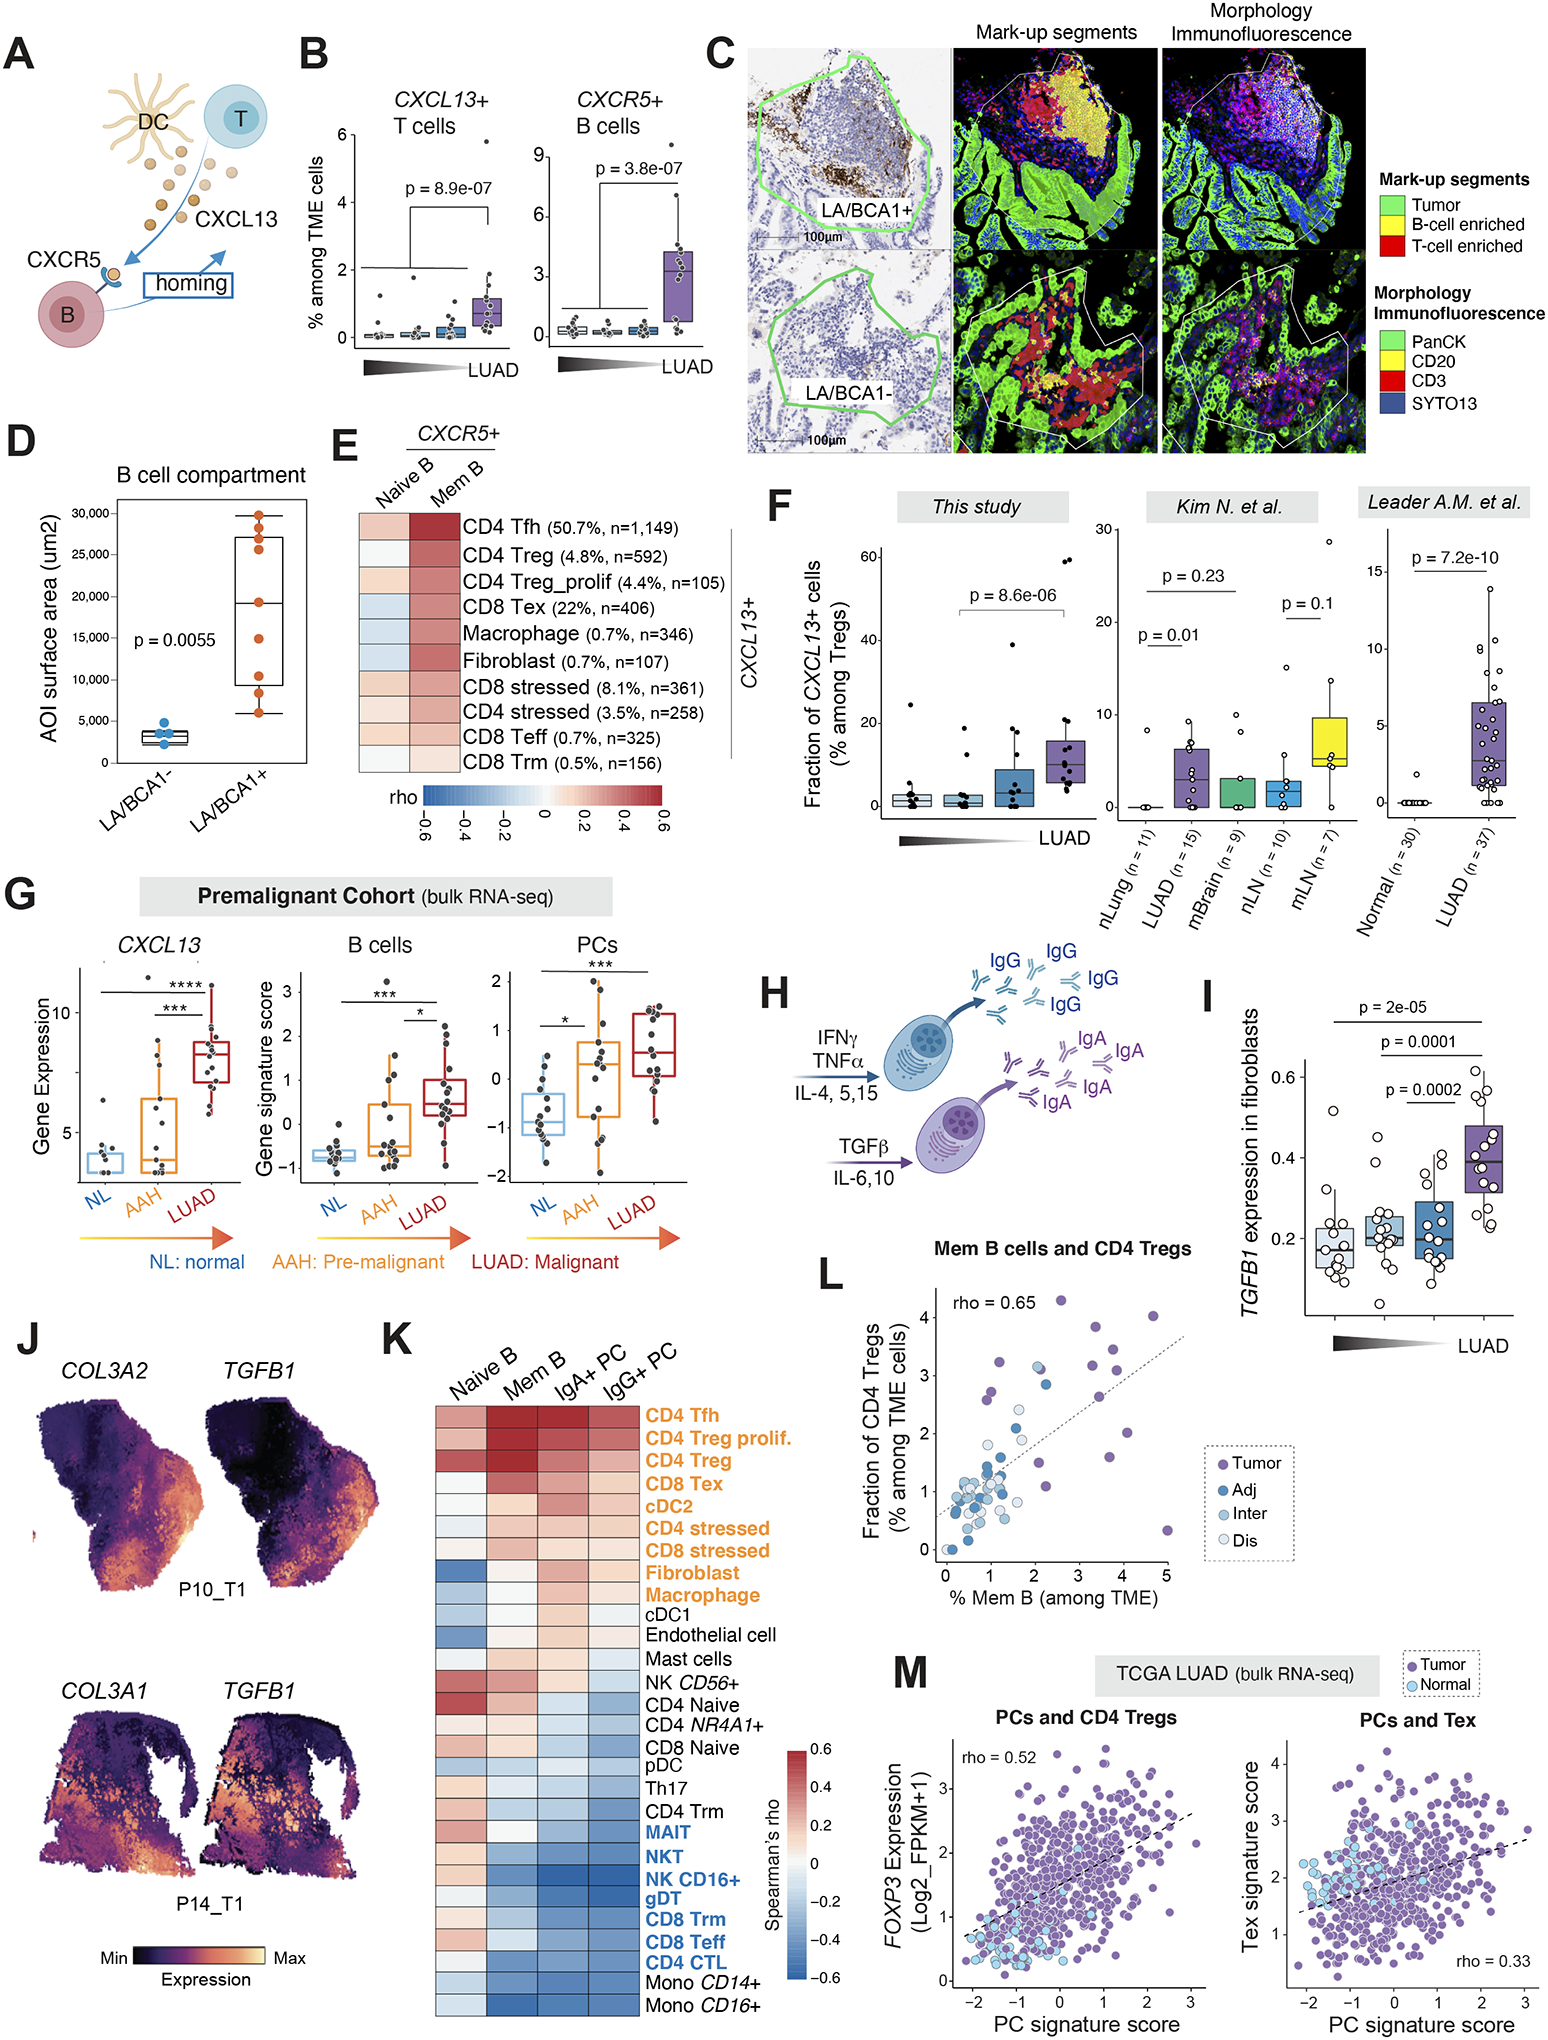
Tumor-infiltrating B and plasma cells (TIB) are prevalent in lung adenocarcinoma (LUAD); however, they are poorly characterized. We performed paired single-cell RNA and B-cell receptor (BCR) sequencing of 16 early-stage LUADs and 47 matching multiregion normal tissues. By integrative analysis of ∼50,000 TIBs, we define 12 TIB subsets in the LUAD and adjacent normal ecosystems and demonstrate extensive remodeling of TIBs in LUADs. Memory B cells and plasma cells (PC) were highly enriched in tumor tissues with more differentiated states and increased frequencies of somatic hypermutation. Smokers exhibited markedly elevated PCs and PCs with distinct differentiation trajectories. BCR clonotype diversity increased but clonality decreased in LUADs, smokers, and with increasing pathologic stage. TIBs were mostly localized within CXCL13+ lymphoid aggregates, and immune cell sources of CXCL13 production evolved with LUAD progression and included elevated fractions of CD4 regulatory T cells. This study provides a spatial landscape of TIBs in early-stage LUAD.

Significance: While TIBs are highly enriched in LUADs, they are poorly characterized. This study provides a much-needed understanding of the transcriptional, clonotypic states and phenotypes of TIBs, unraveling their potential roles in the immunopathology of early-stage LUADs and constituting a road map for the development of TIB-targeted immunotherapies for the treatment of this morbid malignancy. This article is highlighted in the In This Issue feature, p. 2483.


Figures

Figure 1.
Figure 1.. Single-cell profiling of B lineage cells in tumor and matched multi-regional normal lung tissues in 63 samples from 16 patients with early-stage LUADs.
(A) A schematic view of the experimental design, created with BioRender.com. Single-cell RNA sequencing (scRNA-seq) and paired B cell receptor sequencing (scBCR-seq) were performed on EPCAM-negative immune and stromal cell compartments in the tumor microenvironment (TME). Single-cell data generated on B lineage cells were extracted and included in this study. (B) Bar graph showing increased fractions of B lineage cells (among TME cells, i.e., EPCAM-negative cells) in tumor tissues when compared to matched multi-regional normal lung tissues (adjacent, intermediate, distant normal) collected from the same patient (p=1.5e-08, the Mann-Whitney test). (C) Representative images of multiplex immunofluorescence (mIF) showing CD20+ lymphoid aggregates adjacent to areas of PanCK+ tumor cells. mIF was done with a panel of 8 markers on available tissues (n = 20) from 5 of the 16 patients. Scale bar: 100 μm. The inserts are zoomed-in view of CD20+ lymphoid aggregates. (D) Quantification of CD20+ B cells in tumor and multi-region normal lung tissue using mIF. (E) Uniform manifold approximation and projection (UMAP) embeddings of the 49,062 B lineage cells that passed quality control. Cells are color coded by their inferred cell types/states based on transcriptional profiles (left), antibody isotypes using scBCR-seq data (top right), their corresponding spatial location (middle right), and patient smoking status (bottom right). PC, plasma cell; Mem, memory; PB, plasmablast; SPC, stressed plasma cell; adj, adjacent normal; inter, intermediate normal; dis normal, distant normal (same as in panel A). (F) Bubble plot showing proportions and average expression levels of select marker genes for 12 B cell and PC clusters as defined in panel E. More information on cluster-specific marker genes are provided in the Supplementary Table S2. Bubble size indicates the percentage of cells expressing a specific gene in a given cluster, and the color depicts the average expression level of the gene in a cluster of interest and relative to all other cell clusters. (G) Bar graph showing the cellular composition of antibody isotypes in 4 major cell subsets. (H) Bar graph showing the landscape of B lineage cell compositions across all tumor and normal samples grouped by their spatially defined locations (with increasing proximity to tumor from left to right). (I) Boxplot displaying decreased relative fractions of naïve B cell (left, among B lineage cells) and increased fractions of memory B cells (middle) and plasma cells (right) among TME cells in tumor tissues when compared to multi-region normal lung tissues. In the two plots on the right, tumor samples were stratified by patient’s smoking status. NS, non-smoker; S, smoker. P values were determined by Mann-Whitney tests. (J) Bar graph showing the landscape of B lineage cell compositions across all tumor (LUAD) samples grouped by mutation status of LUAD driver gene (e.g., KRAS, EGFR). (K) Boxplots comparing the relative fractions of major B cell subtypes within tumor samples grouped by driver gene mutations. KRAS and EGFR drive mutations were identified using whole-exome sequencing. Mem B, memory B cells; PCs, plasma cells.
Figure 2.
Figure 2.. PC signature in LUADs predicts better survival and response to immunotherapy.
(A) Boxplots comparing cellular fractions of memory B cells (left) and plasma cells (right) among total TME cells in a public scRNA-seq dataset from Kim N. et al (10). P values were determined by Mann-Whitney tests. nLung, normal lung; Primary, primary LUAD; mBrain, brain metastases; nLN, normal lymph node (LN); mLN, lymph node metastases; n.s., not statistically significant. (B) Box plots showing the relative fractions of PCs among the TME cells in the NSCLC scRNA-seq dataset from Leader AM et.al. Only LUAD patients were included in analysis. (C) Boxplots comparing the estimated cell fractions of PCs between tumor and normal lung tissues from the TCGA LUAD cohort (left) and in a subset of patients with tumor-normal pairs (n = 52) (right). Samples were stratified by patient smoking status. NS, non-smoker; FS, former smoker; CS, current smoker. (D) Boxplot showing the expression of PC signature scores across different pathological stages of LUAD in the TCGA LUAD cohort. (E) Estimates for the dependence of all-time risk of death on plasma cell abundance in tumor (expression of plasma cell signature) in TCGA LUAD cohort. The solid curve (red) was generated using the Cox proportional hazards model and the dotted curves indicate the 95% CI of log hazard ratio. (F) Kaplan-Meier curves displaying differences in overall survival (OS) probability between TCGA LUAD patients whose tumors had high (H), medium (M) or low (L) levels of PC gene signature. (G) Kaplan-Meier curves displaying differences in progression-free survival (PFS) between patients whose pre-treatment tumors had high or low levels of PC gene signature in the Prat A et al. cohort receiving anti-PD-1 treatment (14). (H) Estimates for the dependence of all-time risk of death on plasma cell abundance in tumor of combined cohorts of OAK and POPLAR receiving anti-PD-L1 treatment. The solid curve (red) was generated using the Cox proportional hazards model and the dotted curves indicate the 95% CI of log hazard ratio. (I) Kaplan-Meier curves displaying differences in OS probability between anti-PD-L1 treated patients whose pre-treatment tumors had high, medium and low levels of PC gene signature in the combined cohorts.
Figure 3.
Figure 3.. Inference of cell differentiation states and antibody isotypes of PCs and memory B cells in LUADs and matched normal lung tissues.
(A) Monocle 3 pseudotime trajectory analysis of PCs revealed different states of PC differentiation and maturation. PB, plasmablasts. UMAP is colored by inferred pseudotime. (B) The same UMAP as in (A) but with cells color-coded according to gene expression levels of four markers associated with long-lived PCs. (C) (top) The same UMAP as in (A) but with cells color-coded (from left to right) by their BCR expression, corresponding CytoTRACE score, and patient smoking status, respectively. CytoTRACE scores were computed using scRNA-seq data and BCR expression was dichotomized based on the presence of productive BCR clonotype by analyzing scBCR-seq data. Loess smooth curves (bottom) showing (from left to right) fractions of cells with productive BCR, the distribution of CytoTRACE scores, and fractions of smokers, respectively, by pseudotime. Less diff., less differentiated; More diff., more differentiated. (D) Box plots displaying the distribution of CytoTRACE scores across PCs with different antibody isotypes defined using paired scBCR-seq and scRNA-seq data. (E) Comparison of CytoTRACE scores across LUADs and multi-region normal tissues with differing spatial proximities from the tumors (as in Fig. 1A). P value was determined by Mann-Whitney test. (F) A schematic illustration (top) of memory B cell generation in a germinal center (GC) and violin plots (bottom) showing differences in the expression levels of IgH isotypes between LUADs and normal lung tissues. (G) The distribution of CytoTRACE scores in memory B cells at 3 different developmental stages. P value was calculated using the Mann-Whitney test. Int., intermediate. (H) Monocle 3 trajectory reconstruction analysis of B cell differentiation (left). Cells are color-coded by developmental stage, CD27 expression, IgH isotypes, or tissue type (right, top to bottom). A regression line was fitted along pseudotime by a generalized additive model for signature scores of BCR signaling (bottom left). (I) Bar graph showing the difference in tissue compositions across memory B cells at 3 different developmental stages. (J) Pseudotime heatmap ordering of the top 3,000 highly variable genes along the trajectory of memory B cell differentiation. Locations of BCR genes are indicated as a segment (in black) on the left and enriched pathways are labelled on the right. (K) Scatter plot showing gene expression fold change (log2) between late- and early-stage memory B cells (y axis) against the corresponding values of switched and unswitched memory B cells (x axis). Each dot indicates a gene and is color-coded by its corresponding expression fold change between LUADs and normal lung tissues. (L) (top) Box plot showing cellular fractions of antibody isotypes among all B lineage cells with productive V(D)J rearrangements based on paired scBCR-seq data. Each dot indicates a LUAD sample. (bottom) Relative abundances of immunoglobin heavy chain (IgH) isotypes in the TCGA LUAD cohort inferred from bulk RNA-seq data based on the normalized expression levels of each IgH gene. (M) Cellular fractions of IgM+/D+, IgA+ cells (left and middle, respectively) and ratios of IgA+IgG to IgM+IgD abundance (right) across tumor and normal samples. P values were calculated using paired t-tests. (N) Bar graph showing differences in tissue compositions across 7 defined B cell and PC subsets.
Figure 4.
Figure 4.. Characterization of BCR clonotype diversity, clonality, and somatic hypermutations in lung tissues based on proximity from primary LUADs.
(A) Boxplots showing differences in B cell receptor (BCR) clonotype diversity scores between LUADs and matched normal lung tissues. Each dot indicates a LUAD patient. P value was determined by the Mann-Whitney test. (B) (left) A schematic illustration of B cell clonal expansion. (right) The clone size distribution of BCR repertoire across groups of different (from left to right) tissue types (location), smoking status, or tumor stages. The top 150 BCR clonotypes are shown. Kolmogorov–Smirnov tests were used for pairwise comparisons. (C) BCR repertoire overlap across spatially defined locations. A BCR clonotype was defined as shared if it was detected in B cells from two or more different samples collected from the same patient. Heatmap showing how the BCR repertoire in samples from a given geospatial location (i.e., the primary location on x axis) overlap with that from another location (i.e., the secondary location on y axis). (D) The landscape of BCR clonal expansion in all patients, stratified by their tissue specificity, i.e., whether a BCR clonotype detected in LUADs shared with their matched normal lung (left) or unique to tumor tissues (right). BCR clonotypes were classified into 5 categories, namely, hyper-expanded, large, medium, small, and single based on their corresponding clonotype size, and their sample-level compositions are shown in bar graphs. Patient number, smoking status, and tumor stage are annotated at the bottom. (E) BCR repertoire overlap across groups of cells with different antibody isotypes for LUAD (top right) and normal lung tissues (bottom left). Groups are ordered according to the genomic coordinates (5’ to 3’) of Ig subclass (i.e., IgG3, IgG1, IgA1, IgG2, IgG4 and IgA2) coding genes. Heatmap showing the fractions of BCR clonotypes belonging to an upstream isotype (each row) that are shared with a downstream isotype (columns). (F) Violin plot showing the distribution of BCR clonotype size across 12 B cell and PC states as defined in Figure 1E. (G) The same UMAP as in Figure 1E showing B cells and PCs with the 15 most expanded BCR clonotypes (same colors as in panel F). Cells with both scRNA-seq and scBCR-seq data were analyzed. (H) (left) A schematic illustration of BCR somatic hypermutation (SHM). (right) The same UMAP as in Figure 1E but cells are color-coded by levels of SHM in their corresponding BCRs. None, germline sequence with no detected SHM. Cells with both scRNA-seq and scBCR-seq data are shown. (I) Distribution of SHM frequencies across 12 B cell and PC subsets as defined in Figure 1E. (J) Box plot showing the distribution of BCR clonotypes size across 3 groups of cells with different SHM frequencies in their corresponding BCRs. (K) Box plot showing average SHM frequencies in tumor and normal tissues with spatially defined locations. P values were determined by paired t tests. (L) Alluvial plots showing the distribution of cells with different SHM frequencies across spatially defined locations, among all cells with productive BCRs based on scBCR-seq data (left) or among IgA+ or IgG+ cells only (right). Panels B and H were created with BioRender.com.
Figure 5.
Figure 5.. Interplay between TIBs and other TME cells in LUADs.
(A) A schematic illustration of B cell recruitment via the CXCL13-CXCR5 axis. (B) Fractions of CXCL13+ T cells and CXCR5+ B lineage cells, respectively, among all TME cells in LUADs and the multi-region normal lung tissues with spatially defined locations. (C) Representative DSP images showing AOI segmentation strategy. Each ROI was segmented into 3 AOIs: B cell, T cell or tumor cell-enriched based on expression of the morphology markers. ROI, region of interest; AOI, area of illumination. (D) Comparative analysis of B cell abundance between CXCL13 (BCA1)-positive and -negative lymphoid aggregates (LAs). B cell abundance in each ROI was quantified by measuring the AOI surface area of the B cell compartment. P value was calculated by the Wilcoxon test. (E) Co-occurrence relationships between CXCR5+ naïve and memory B cells and other CXCL13+ TME subsets identified using scRNA-seq. Spearman’s correlation analysis was used to statistically evaluate co-occurrence relationships of different TME cell subsets based on their corresponding cell fractions. A heatmap was plotted based on the Spearman’s correlation coefficient (rho). Ten other TME cell subsets with >100 cells or with a fraction of CXCL13-expressing cells > 0.5% were included in the heatmap. Mem, memory. Tfh, T follicular helper cells; Treg, regulatory T cells; Tex, exhausted T cells; Teff, effector T cells; Trm, resident memory T cells. (F) Fractions of CXCL13+ cells among Tregs in this study (left) and two public scRNA-seq datasets (middle and right). (G) Gene expression levels of CXCL13 and gene signature scores of B cells and PCs in a premalignant cohort with bulk RNA-seq data. P values were determined by the Mann-Whitney test. ***, P < 0.001; ****, P < 0.0001. (H) A schematic illustration of cytokines regulating PC isotype switching and antibody secretion. (I) Increased TGFB1 expression in tumor-associated fibroblasts. Wilcoxon test was used to calculate the p values. (J) Spatial transcriptomics (ST)-based mapping of TGFB1-expressing to fibroblast-enriched regions from 2 LUAD patients using the Visium platform (10X Genomics). (K) Co-occurrence relationships between 4 TIB subsets and 27 other TME cell populations identified using scRNA-seq. Spearman’s correlation analysis was used to statistically evaluate co-occurrence relationships of different TME cell subsets based on their corresponding cell fractions. Heatmap was plotted based on the Spearman’s correlation coefficient (rho). (L) Scatter plot displaying the correlation between the fractions of CD4 Tregs and that of memory B cells in the LUADs and normal lung tissues from all 16 patients in this scRNA-seq cohort. Spearman’s correlation independent of logarithmic transformation is shown. Samples are labelled by their spatial locations. (M) Scatter plots displaying the correlation between the gene signature scores of PCs and expression levels of the Treg marker gene, FOXP3 (top), or expression levels of the T cell exhaustion related gene signature (bottom), in samples from the TCGA LUAD cohort. Samples are labelled by their tissue types (tumor or normal). Tregs, regulatory T cells; Tex, exhausted T cells. Panels A and H were created with BioRender.com.
Figure 6.
Figure 6.. Schematic highlighting key discoveries of this study.
A schematic cartoon depicts the geospatial changes (from left to right) in cellular composition of TIBs, BCR clonal diversity and clonality, frequency of BCR somatic hypermutation (SHM), and cell differentiation states of B cells and PCs, respectively, in LUADs when compared to their matched normal lung tissues. Part of this figure was created with BioRender.com.

References

    1. Goldstraw P, Ball D, Jett JR, Le Chevalier T, Lim E, Nicholson AG, et al. Non-small-cell lung cancer. Lancet 2011;378(9804):1727–40 doi 10.1016/S0140-6736(10)62101-0. - DOI - PubMed
    1. Wei SC, Levine JH, Cogdill AP, Zhao Y, Anang N-AA, Andrews MC, et al. Distinct cellular mechanisms underlie anti-CTLA-4 and anti-PD-1 checkpoint blockade. Cell 2017;170(6):1120–33. e17. - PMC - PubMed
    1. Wherry EJ, Kurachi M. Molecular and cellular insights into T cell exhaustion. Nature Reviews Immunology 2015;15(8):486–99. - PMC - PubMed
    1. Sharonov GV, Serebrovskaya EO, Yuzhakova DV, Britanova OV, Chudakov DM. B cells, plasma cells and antibody repertoires in the tumour microenvironment. Nat Rev Immunol 2020;20(5):294–307 doi 10.1038/s41577-019-0257-x. - DOI - PubMed
    1. Helmink BA, Reddy SM, Gao J, Zhang S, Basar R, Thakur R, et al. B cells and tertiary lymphoid structures promote immunotherapy response. Nature 2020;577(7791):549–55. - PMC - PubMed

Publication types