. 2022 Nov;35(5-6):680-691.
doi: 10.1007/s10548-022-00911-2. Epub 2022 Sep 13.

Levetiracetam Modulates EEG Microstates in Temporal Lobe Epilepsy

Affiliations

Levetiracetam Modulates EEG Microstates in Temporal Lobe Epilepsy

Lorenzo Ricci et al. Brain Topogr. 2022 Nov.

Abstract

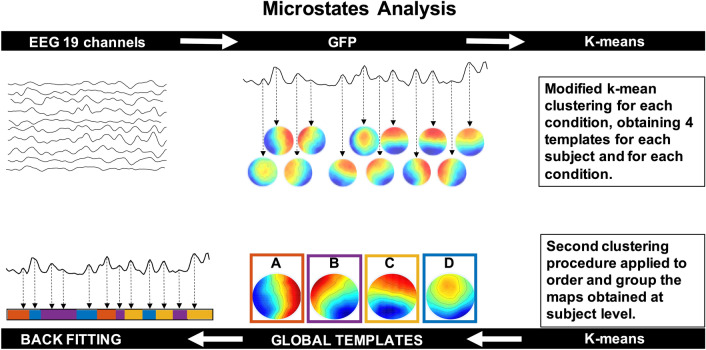
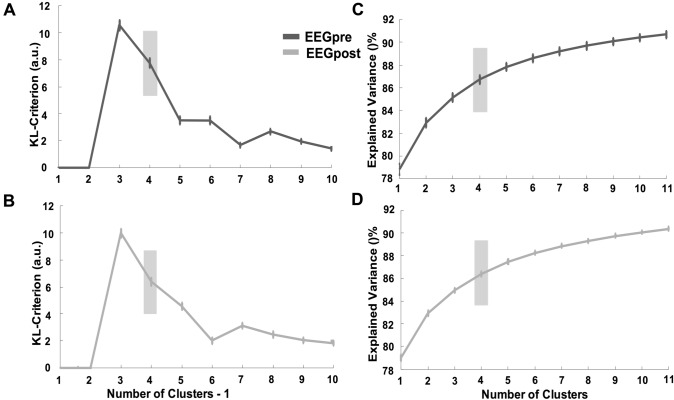
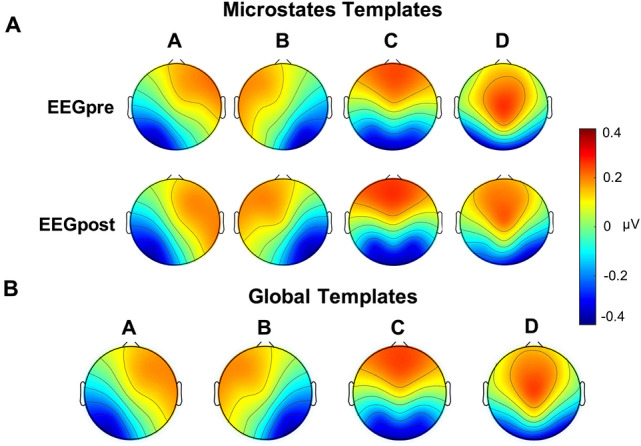
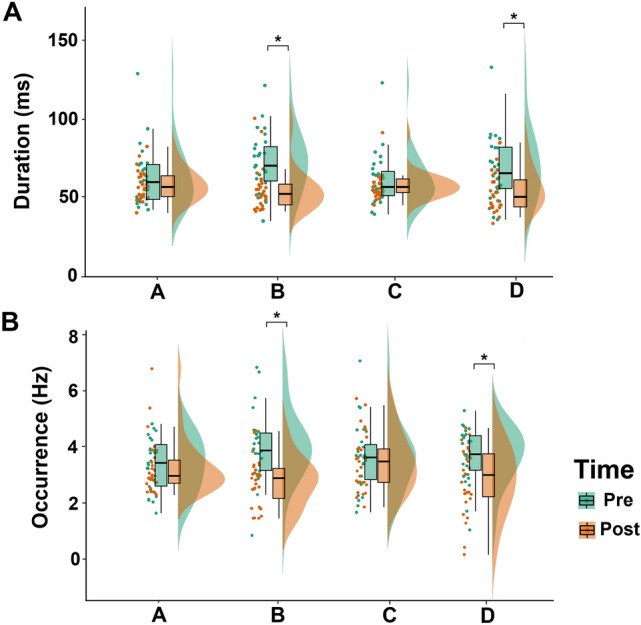
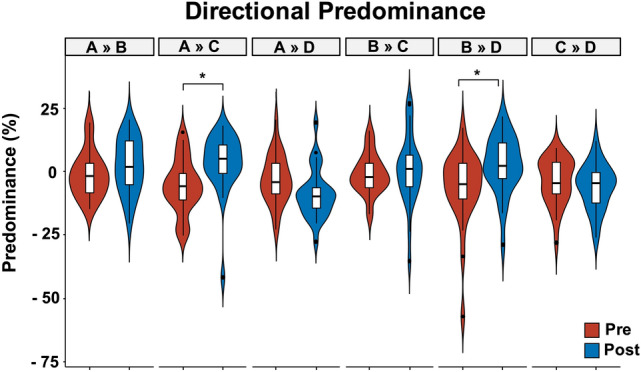
To determine the effects of Levetiracetam (LEV) therapy using EEG microstates analysis in a population of newly diagnosed Temporal Lobe Epilepsy (TLE) patients. We hypothesized that the impact of LEV therapy on the electrical activity of the brain can be globally explored using EEG microstates. Twenty-seven patients with TLE were examined. We performed resting-state microstate EEG analysis and compared microstate metrics between the EEG performed at baseline (EEGpre) and after 3 months of LEV therapy (EEGpost). The microstates A, B, C and D emerged as the most stable. LEV induced a reduction of microstate B and D mean duration and occurrence per second (p < 0.01). Additionally, LEV treatment increased the directional predominance of microstate A to C and microstate B to D (p = 0.01). LEV treatment induces a modulation of resting-state EEG microstates in newly diagnosed TLE patients. Microstates analysis has the potential to identify a neurophysiological indicator of LEV therapeutic activity. This study of EEG microstates in people with epilepsy opens an interesting path to identify potential LEV activity biomarkers that may involve increased neuronal inhibition of the epileptic network.

Keywords: Biomarkers; EEG; Levetiracetam; Microstates; Temporal lobe epilepsy.


Conflict of interest statement

None of the authors have potential conflicts of interest to be disclosed. All the authors confirm that they have read the Journal’s position on issues involved in ethical publication and affirm that this report is consistent with those guidelines.

Figures

Fig. 1
Fig. 1
Microstate analysis pipeline. Step 1: The intervals of stable topographical configurations are identified. Step 2: The global templates of the dominant microstates are calculated for the identified intervals of brain functional stability. Step 3: The identified global templates are backfitted to each noise-free EEG dataset to find the specific sequence of microstates on which metrics are calculated
Fig. 2
Fig. 2
Microstate optimal templates’ number. A and B KL criterion trend with respect to the number of clusters. The second maximum is 4 for both EEGpre and EEGpost conditions. C and D Global explained variance as a function of the number of clusters. There is no significant increase from four and up clusters. EEGpre: EEG performed before the initiation of Levetiracetam (LEV) therapy. EEGpost: EEG performed after 3 months of LEV therapy
Fig. 3
Fig. 3
Microstates (A–D) template for each condition. A EEGpre: EEG performed before the initiation of Levetiracetam (LEV) therapy. EEGpost: EEG performed after 3 months of LEV therapy. B Microstate maps (from A to D) represent the global microstate templates obtained from condition-wise microstate template
Fig. 4
Fig. 4
Microstate metrics across conditions. Raincloud plot and boxplot distribution of microstate mean duration (A) and occurrences per second (B) comparing the EEG performed before Levetiracetam (LEV) initiation (Pre) and the EEG performed after 3 months of LEV therapy (Post) across different microstate templates. Black lines represent mean values. Circles denote mean metrics value for each subject. We found a global reduction of microstate metrics in the Post condition (p < 0.05). Post-hoc tests revealed a specific reduction in microstate B and D mean duration and occurrences per second after 3 months of LEV therapy. *Bonferroni corrected p < 0.05
Fig. 5
Fig. 5
Directional Predominance. Boxplot and violin plot distributions of the directional predominance of the four microstate templates across conditions (Pre vs. Post). Circles denote values that are farther than 1.5 interquartile ranges. Pre EEG performed before the initiation of Levetiracetam (LEV) therapy. Post EEG performed after 3 months of LEV therapy
Fig. 6
Fig. 6
Microstate metrics modifications comparing right side (R) and left side (L) Temporal Lobe Epilepsy (TLE). Boxplot distributions of mean percentage of covered analysis time among patients with right-TLE (R, in blue) and left-TLE (L, in red). Circles and triangles indicate mean microstate values for each subject considering both EEGpre (before Levetiracetam) and EEGpost (after Levetiracetam) conditions. We found lower microstate D coverage values in l-TLE as opposed to r-TLE patients. *Bonferroni corrected p < 0.05
Fig. 7
Fig. 7
Directional predominance comparing right side (R) and left side (L) Temporal Lobe Epilepsy (TLE). Raincloud plot and boxplot distribution of microstate directional predominance comparing patients with right-TLE (R) and left-TLE (L) and the EEG performed before Levetiracetam (LEV) initiation (Pre) and the EEG performed after 3 months of LEV therapy (Post) among different microstate templates. Black lines represent mean values. Circles denote mean metrics value for each subject. We found reduced values of microstates’ directional predominance in left-TLE as opposed to right-TLE across all microstate pairs (p < 0.05)

Similar articles

Cited by

References

    1. Assenza G, Lanzone J, Insola A, et al. Thalamo-cortical network dysfunction in temporal lobe epilepsy. Clin Neurophysiol. 2020;131:548–554. - PubMed
    1. Britz J, Van De Ville D, Michel CM. BOLD correlates of EEG topography reveal rapid resting-state network dynamics. Neuroimage. 2010;52:1162–1170. - PubMed
    1. Brodie MJ, Barry SJE, Bamagous GA, et al. Patterns of treatment response in newly diagnosed epilepsy. Neurology. 2012;78:1548–1554. - PMC - PubMed
    1. Brunet D, Murray MM, Michel CM. Spatiotemporal analysis of multichannel EEG: CARTOOL. Comput Intell Neurosci. 2011 doi: 10.1155/2011/813870. - DOI - PMC - PubMed
    1. Cantero JL, Atienza M, Salas RM, Gómez CM. Brain spatial microstates of human spontaneous alpha activity in relaxed wakefulness, drowsiness period, and REM sleep. Brain Topogr. 1999;11:257–263. - PubMed

Publication types

LinkOut - more resources