. 2022 Dec 2;12(12):2856-2879.
doi: 10.1158/2159-8290.CD-22-0603.

Comparative Genomics Provides Etiologic and Biological Insight into Melanoma Subtypes

Affiliations

Comparative Genomics Provides Etiologic and Biological Insight into Melanoma Subtypes

Felicity Newell et al. Cancer Discov. .

Abstract

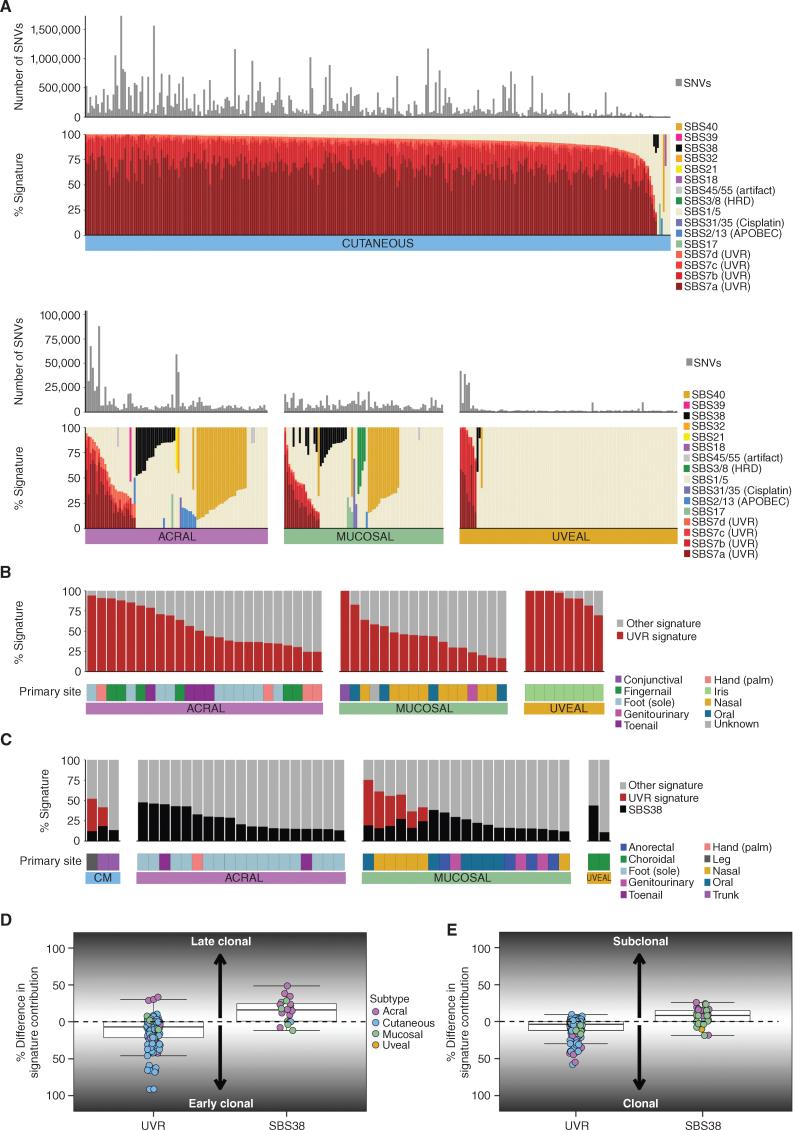
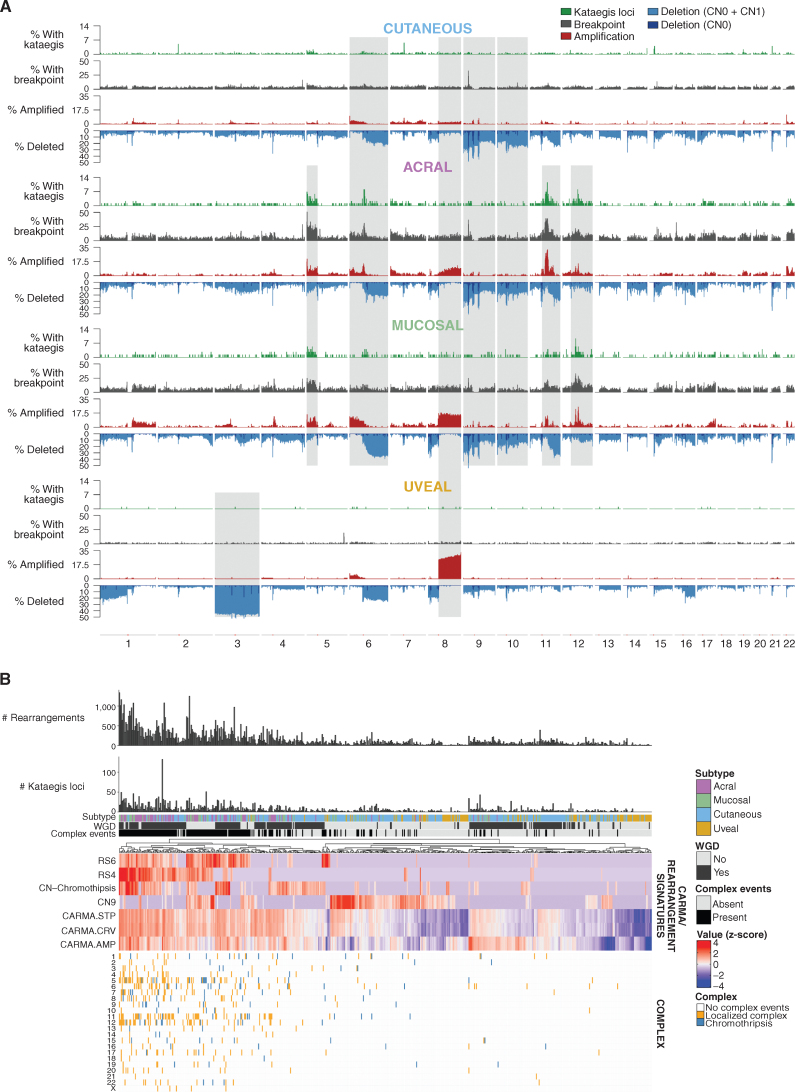
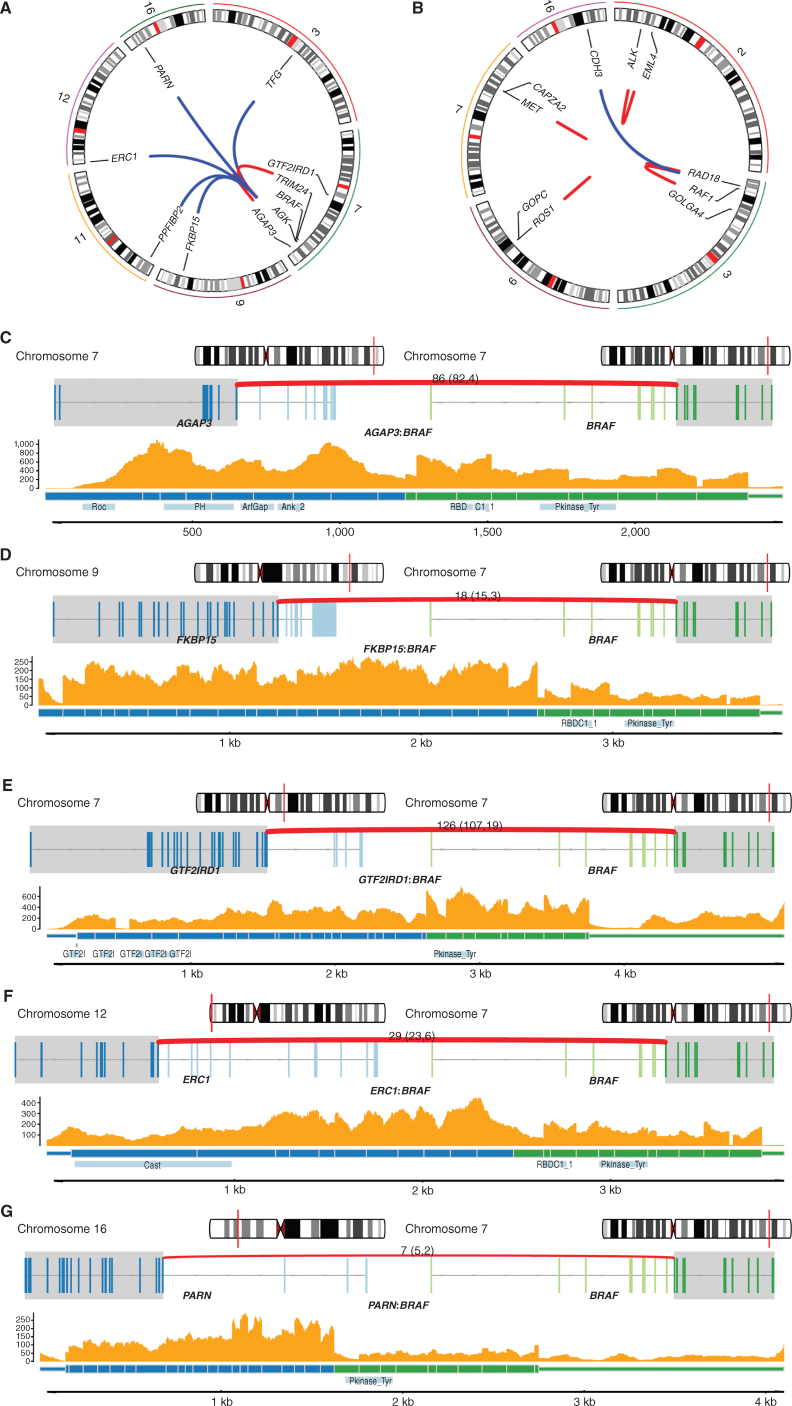
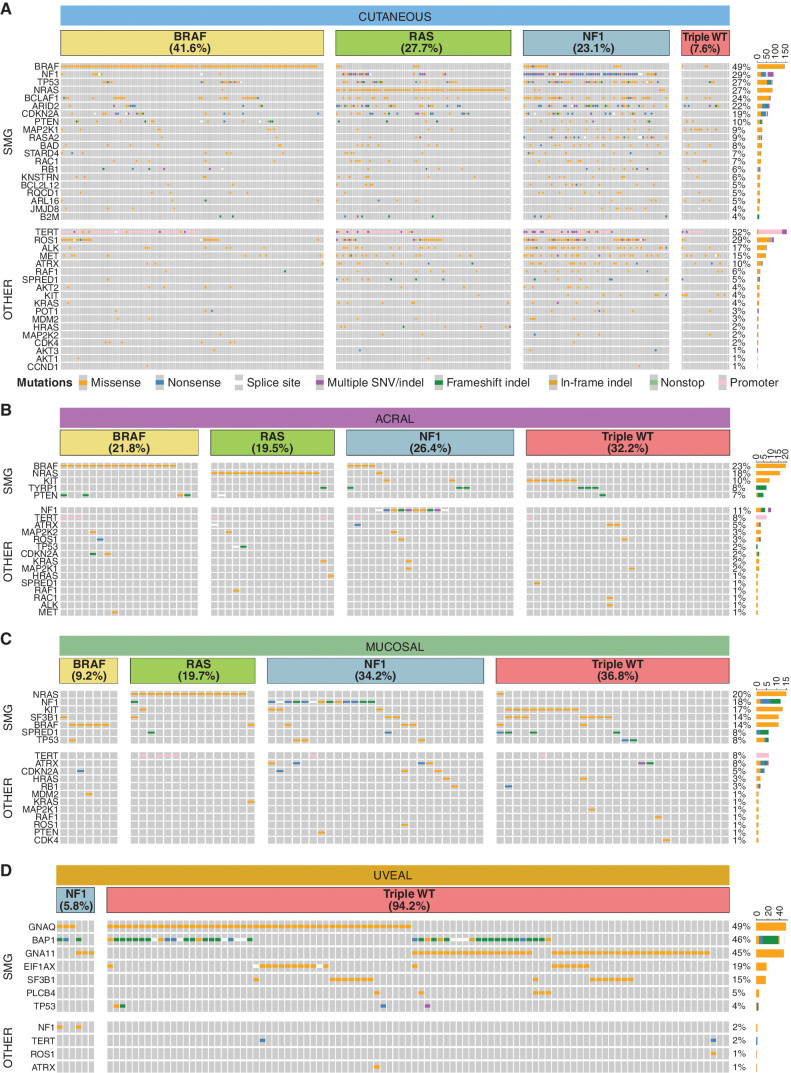
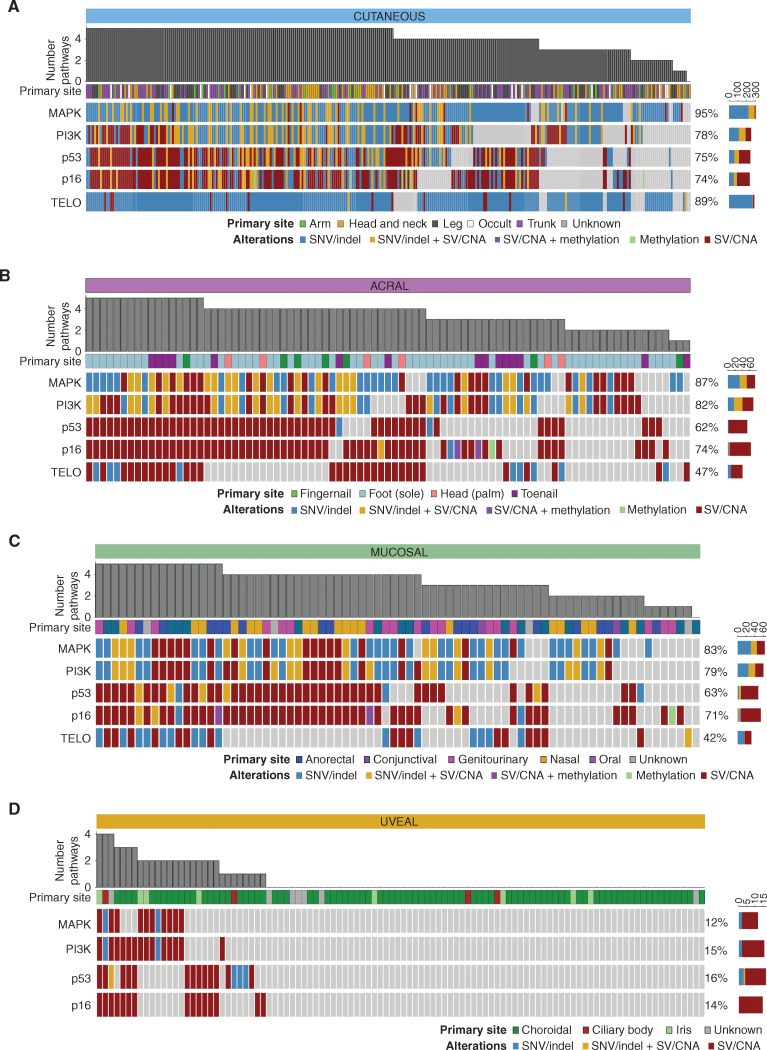
Melanoma is a cancer of melanocytes, with multiple subtypes based on body site location. Cutaneous melanoma is associated with skin exposed to ultraviolet radiation; uveal melanoma occurs in the eyes; mucosal melanoma occurs in internal mucous membranes; and acral melanoma occurs on the palms, soles, and nail beds. Here, we present the largest whole-genome sequencing study of melanoma to date, with 570 tumors profiled, as well as methylation and RNA sequencing for subsets of tumors. Uveal melanoma is genomically distinct from other melanoma subtypes, harboring the lowest tumor mutation burden and with significantly mutated genes in the G-protein signaling pathway. Most cutaneous, acral, and mucosal melanomas share alterations in components of the MAPK, PI3K, p53, p16, and telomere pathways. However, the mechanism by which these pathways are activated or inactivated varies between melanoma subtypes. Additionally, we identify potential novel germline predisposition genes for some of the less common melanoma subtypes.

Significance: This is the largest whole-genome analysis of melanoma to date, comprehensively comparing the genomics of the four major melanoma subtypes. This study highlights both similarities and differences between the subtypes, providing insights into the etiology and biology of melanoma. This article is highlighted in the In This Issue feature, p. 2711.


Figures

Figure 1. Genomic overview of the cohort. A, Distribution of the melanoma subtypes in the cohort. B, Mutations per megabase of SNVs and indels (top) and number of structural rearrangements (bottom) in each subtype. Each point represents a tumor, with the black line and number representing the median for each subtype. C, Overview of the genomic alterations within each tumor sample. Patients are grouped into separate plots based on melanoma subtype (cutaneous, acral, mucosal, and uveal). The upper plot shows the mutation burden of SNVs/DNVs/TNVs and indels as mutations per megabase across the entire genome. The patients within each subtype plot are ordered from highest to lowest mutation burden. The second plot from the top shows the number of structural rearrangements per tumor, including the predicted type of rearrangements: deletion, duplication, tandem duplication, inversion, foldback inversion, amplified inversion, intrachromosomal, or translocation. The third plot shows the percentage of the genome affected by CNAs including deletion (copy number 0: CN0), loss of 1 copy (loss CN1), copy number 2 (CN2), copy-neutral loss of heterozygosity (LOH), copy-number gain with 3 to 5 copies (CN3–5), and copy-number gain (CN ≥6). Next, tumor purity in each tumor is shown, followed by the presence of WGD per tumor. Finally, the primary site of each tumor is shown.
Figure 1.
Genomic overview of the cohort. A, Distribution of the melanoma subtypes in the cohort. B, Mutations per megabase of SNVs and indels (top) and number of structural rearrangements (bottom) in each subtype. Each point represents a tumor, with the black line and number representing the median for each subtype. C, Overview of the genomic alterations within each tumor sample. Patients are grouped into separate plots based on melanoma subtype (cutaneous, acral, mucosal, and uveal). The upper plot shows the mutation burden of SNVs/DNVs/TNVs and indels as mutations per megabase across the entire genome. The patients within each subtype plot are ordered from highest to lowest mutation burden. The second plot from the top shows the number of structural rearrangements per tumor, including the predicted type of rearrangements: deletion, duplication, tandem duplication, inversion, foldback inversion, amplified inversion, intrachromosomal, or translocation. The third plot shows the percentage of the genome affected by CNAs including deletion (copy number 0: CN0), loss of 1 copy (loss CN1), copy number 2 (CN2), copy-neutral loss of heterozygosity (LOH), copy-number gain with 3 to 5 copies (CN3–5), and copy-number gain (CN ≥6). Next, tumor purity in each tumor is shown, followed by the presence of WGD per tumor. Finally, the primary site of each tumor is shown.
Figure 2. Mutational signatures. A, The number of SNVs and proportion of SBS signatures in each melanoma subtype. If the etiology for a signature is known, this is listed in parentheses after the signature name. HRD, homologous repair defect. B, The contribution of UVR signature and tumor primary site in non-CM tumors that have a UVR signature present (>0% UVR contribution). C, The contribution of SBS38 in each subtype in tumors that have an SBS38 signature present (>0% SBS38 contribution). D, Difference per tumor between the percentage of early and late clonal mutations attributed to UVR or SBS38 mutational signatures. E, Difference per tumor between the percentage of clonal and subclonal mutations attributed to UVR or SBS38 mutational signatures.
Figure 2.
Mutational signatures. A, The number of SNVs and proportion of SBS signatures in each melanoma subtype. If the etiology for a signature is known, this is listed in parentheses after the signature name. HRD, homologous repair defect. B, The contribution of UVR signature and tumor primary site in non-CM tumors that have a UVR signature present (>0% UVR contribution). C, The contribution of SBS38 in each subtype in tumors that have an SBS38 signature present (>0% SBS38 contribution). D, Difference per tumor between the percentage of early and late clonal mutations attributed to UVR or SBS38 mutational signatures. E, Difference per tumor between the percentage of clonal and subclonal mutations attributed to UVR or SBS38 mutational signatures.
Figure 3. Rearrangements, CNAs, and complex rearrangement events. A, Distribution of (top to bottom) the percentage of tumors with kataegis loci (green), a rearrangement breakpoint (gray), a CNA with amplifications (red), and deletions (CN0 + CN1, blue) in 100-kb regions across the genome in each melanoma subtype. Regions of similarity and difference in the pattern of kataegis, breakpoints, and CNA between subtypes are shaded gray. B, Complex events in each tumor. From top to bottom: number of rearrangements, number of kataegis loci, melanoma subtype, presence of WGD, presence of complex rearrangement events, heat map of measures of complexity, and presence of complex events in each chromosome in each tumor. For the heat map of measures of complexity, tumors were clustered using various measures that indicate the presence of complex structural rearrangements and chromosomal instability, including chromothripsis-related CN signatures (CN chromothripsis: CN5 + CN6 + CN7 + CN8), diploid chromosomal instability CN signature CN9, clustering rearrangement signatures (RS4 and RS6), and CARMA features of amplification (AMP) and complexity (STP and CRV). For clustering, z-score–transformed values for each factor were used.
Figure 3.
Rearrangements, CNAs, and complex rearrangement events. A, Distribution of (top to bottom) the percentage of tumors with kataegis loci (green), a rearrangement breakpoint (gray), a CNA with amplifications (red), and deletions (CN0 + CN1, blue) in 100-kb regions across the genome in each melanoma subtype. Regions of similarity and difference in the pattern of kataegis, breakpoints, and CNA between subtypes are shaded gray. B, Complex events in each tumor. From top to bottom: number of rearrangements, number of kataegis loci, melanoma subtype, presence of WGD, presence of complex rearrangement events, heat map of measures of complexity, and presence of complex events in each chromosome in each tumor. For the heat map of measures of complexity, tumors were clustered using various measures that indicate the presence of complex structural rearrangements and chromosomal instability, including chromothripsis-related CN signatures (CN chromothripsis: CN5 + CN6 + CN7 + CN8), diploid chromosomal instability CN signature CN9, clustering rearrangement signatures (RS4 and RS6), and CARMA features of amplification (AMP) and complexity (STP and CRV). For clustering, z-score–transformed values for each factor were used.
Figure 4. Cancer gene fusions A, Circos plot showing the nine BRAF gene fusion events and the corresponding fusion gene partner. Only chromosomes containing the genes involved in the gene fusions are shown. B, Circos plot showing RAF1, ALK, MET, and ROS1 gene fusion events of interest and the corresponding fusion gene partner. Only chromosomes containing the genes involved in the gene fusions are shown. C–G, BRAF fusion genes in tumors with RNA-seq available. For each fusion gene, the top plot shows the location in the chromosome of each fusion gene partner; the middle plot shows the exons involved in each gene (transcripts are collapsed). The bottom plot shows the read depth of both fusion gene partners by RNA-seq, predicted fusion protein, and the protein domains (including BRAF kinase domain) involved. C, AGAP3–BRAF fusion; D, FKBP15–BRAF fusion; E, GTF2IRD1–BRAF fusion; F, ERC1–BRAF fusion; G, PARN–BRAF fusion.
Figure 4.
Cancer gene fusions A, Circos plot showing the nine BRAF gene fusion events and the corresponding fusion gene partner. Only chromosomes containing the genes involved in the gene fusions are shown. B, Circos plot showing RAF1, ALK, MET, and ROS1 gene fusion events of interest and the corresponding fusion gene partner. Only chromosomes containing the genes involved in the gene fusions are shown. C–G, Examples of BRAF fusion genes in tumors with RNA-seq available. For each fusion gene, the top plot shows the location in the chromosome of each fusion gene partner, and the middle plot shows the exons involved in each gene (transcripts are collapsed). The bottom plot shows the read depth of both fusion gene partners by RNA-seq, predicted fusion protein, and the protein domains (including BRAF kinase domain) involved. C and D,AGAP3:BRAF fusion and FKBP15:BRAF fusion, respectively. E–G,GTF2IRD1:BRAF fusion, ERC1:BRAF fusion, and PARN:BRAF fusion, respectively.
Figure 5. SMGs. Oncoplots of SMGs (top) and other melanoma genes (other, bottom) in (A) cutaneous tumors, (B) acral tumors, (C) mucosal tumors, and (D) uveal tumors. Each subtype is separated into TCGA molecular categories. Oncoplots show SNV and indels only. Tumors without an SNV or indel in a TCGA category gene that were assigned to that TCGA category had other structural alterations of the gene, e.g., a BRAF fusion.
Figure 5.
SMGs. Oncoplots of SMGs (top) and other melanoma genes (other, bottom) in cutaneous (A), acral (B), mucosal (C), and uveal (D) tumors. Each subtype is separated into TCGA molecular categories. Oncoplots show SNVs and indels only. Tumors without an SNV or indel in a TCGA category gene that were assigned to that TCGA category had other structural alterations of the gene (e.g., a BRAF fusion).
Figure 6. Decision tree predicting TMB in CM. Starting with CM tumors in the root node (top left), the variable that had the highest correlation with TMB was identified, e.g., NF1 mutation status. In the branching node, the correlation (Kendall's tau) with TMB and associated Bonferroni corrected P value is displayed. The branching node splits the cohort into two groups with size (in brackets) and median TMB is displayed in the daughter nodes. The splitting is repeated recursively until no more significant variables can be found. For each leaf node in the decision tree, the distribution of TMB is displayed on the right-hand side in the form of box-and-whisker plots with whiskers from minimum to maximum. Medians are displayed as a line within the box defined by the quartiles.
Figure 6.
Decision tree predicting TMB in CM. Starting with CM tumors in the root node (top left), the variable that had the highest correlation with TMB was identified (i.e., NF1 mutation status). In the branching node, the correlation (Kendall's tau) with TMB and associated Bonferroni corrected P value is displayed. The branching node splits the cohort into two groups with size (in brackets), and median TMB is displayed in the daughter nodes. The splitting is repeated recursively until no more significant variables can be found. For each leaf node in the decision tree, the distribution of TMB is displayed on the right-hand side in the form of box-and-whisker plots with whiskers from minimum to maximum. Medians are displayed as a line within the box defined by the quartiles.
Figure 7. Pathways important in melanoma development. Genomic aberrations are shown in five signaling pathways that are important in melanoma development: MAPK; PI3K, p53, p16–CDK–RB (p16), and telomere maintenance (TELO). Included genes and aberrations for each pathway are listed in Supplementary Table S8. Oncoplots show the type of aberration(s) in a gene within each pathway, and plots are grouped by subtype: A, cutaneous tumors; B, acral tumors; C, mucosal tumors; and D, uveal tumors. The number of pathways mutated and the primary site of the tumor are shown. The color sidebars show the percentage of melanomas with the aberrant pathway.
Figure 7.
Pathways important in melanoma development. Genomic aberrations are shown in five signaling pathways that are important in melanoma development: MAPK, PI3K, p53, p16–CDK–RB (p16), and telomere maintenance (TELO). Included genes and aberrations for each pathway are listed in Supplementary Table S8. Oncoplots show the type of aberration(s) in a gene within each pathway, and plots are grouped by subtype. Cutaneous tumors (A) and acral tumors (B), respectively. Mucosal tumors (C) and uveal tumors (D), respectively. The number of pathways mutated and the primary site of the tumor are shown. The color sidebars show the percentage of melanomas with the aberrant pathway.

Comment in

  • doi: 10.1158/2159-8290.CD-12-12-ITI

References

    1. Pleasance ED, Cheetham RK, Stephens PJ, McBride DJ, Humphray SJ, Greenman CD, et al. A comprehensive catalogue of somatic mutations from a human cancer genome. Nature 2010;463:191–6. - PMC - PubMed
    1. Cancer Genome Atlas Network. Genomic classification of cutaneous melanoma. Cell 2015;161:1681–96. - PMC - PubMed
    1. Krauthammer M, Kong Y, Ha BH, Evans P, Bacchiocchi A, McCusker JP, et al. Exome sequencing identifies recurrent somatic RAC1 mutations in melanoma. Nat Genet 2012;44:1006–14. - PMC - PubMed
    1. Hayward NK, Wilmott JS, Waddell N, Johansson PA, Field MA, Nones K, et al. Whole-genome landscapes of major melanoma subtypes. Nature 2017;545:175–80. - PubMed
    1. Wilmott JS, Johansson PA, Newell F, Waddell N, Ferguson P, Quek C, et al. Whole genome sequencing of melanomas in adolescent and young adults reveals distinct mutation landscapes and the potential role of germline variants in disease susceptibility. Int J Cancer 2019;144:1049–60. - PubMed

Publication types