. 2022 Nov 1;132(21):e151363.
doi: 10.1172/JCI151363.

R-spondin/YAP axis promotes gastric oxyntic gland regeneration and Helicobacter pylori-associated metaplasia in mice

Affiliations

R-spondin/YAP axis promotes gastric oxyntic gland regeneration and Helicobacter pylori-associated metaplasia in mice

Anne-Sophie Fischer et al. J Clin Invest. .

Abstract

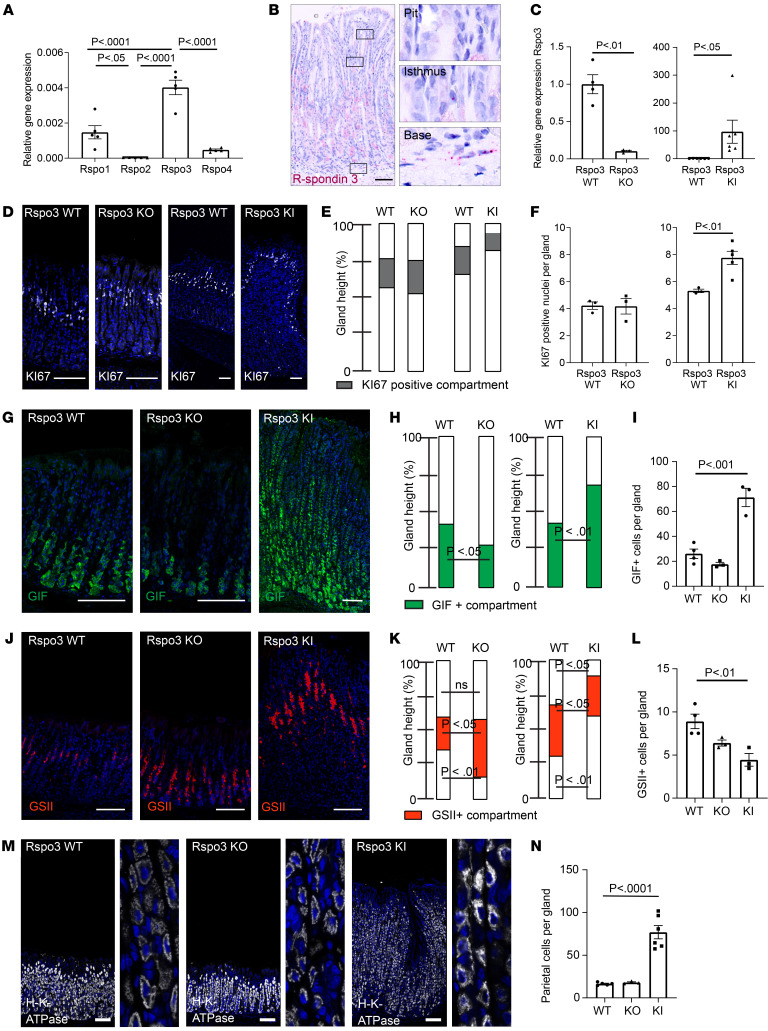
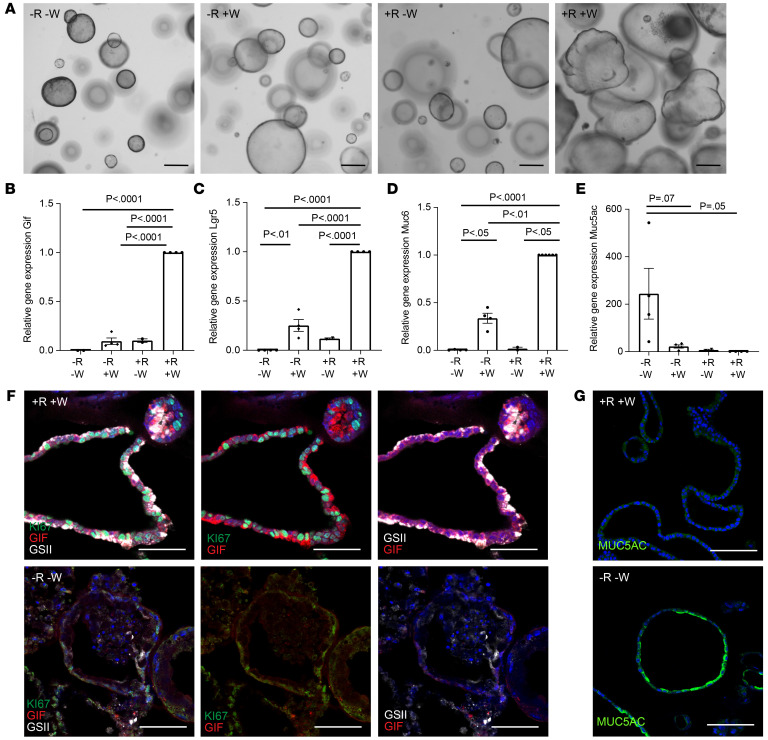
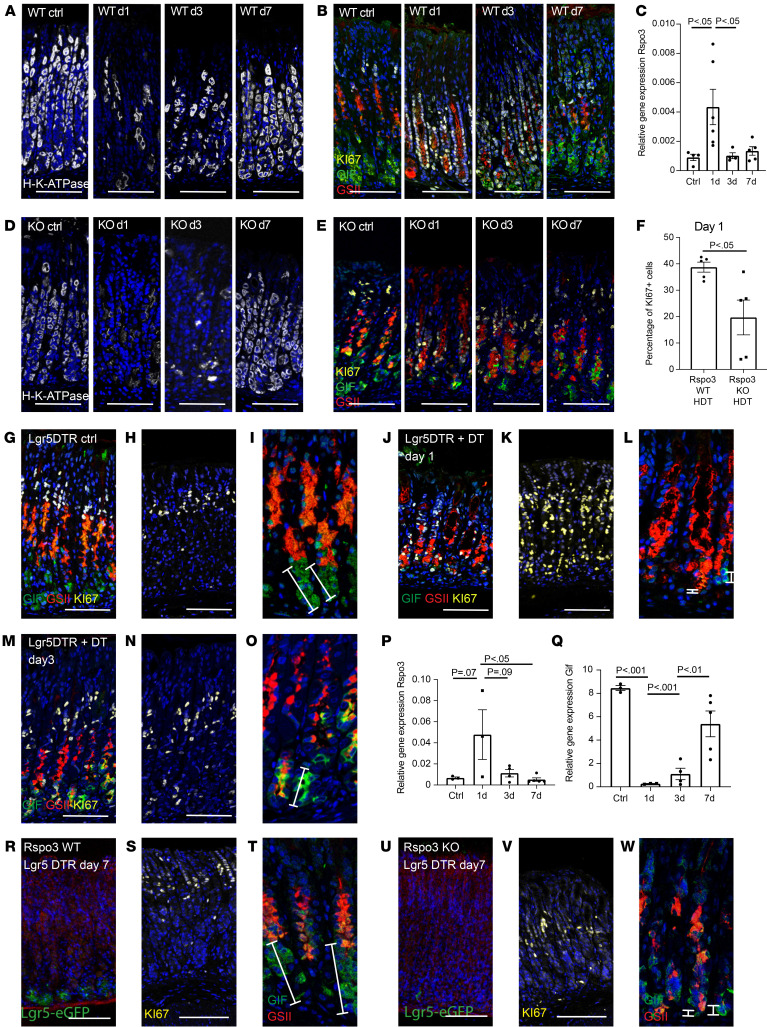
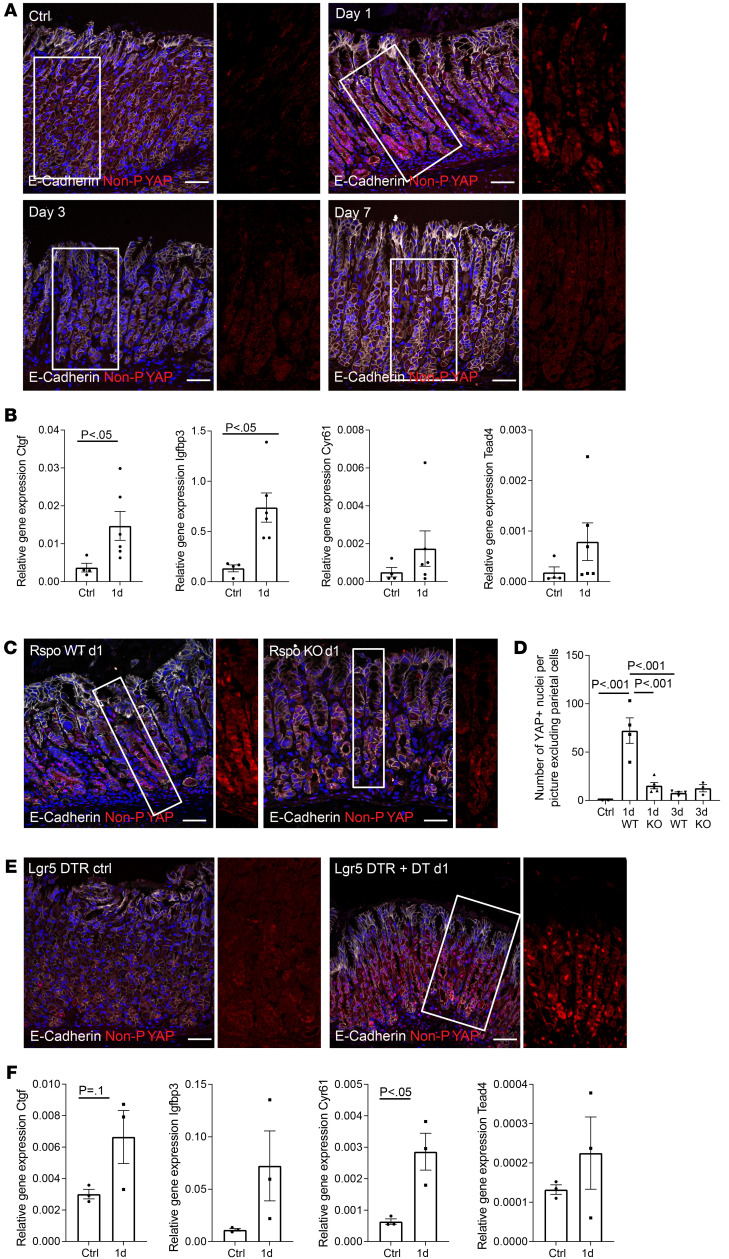
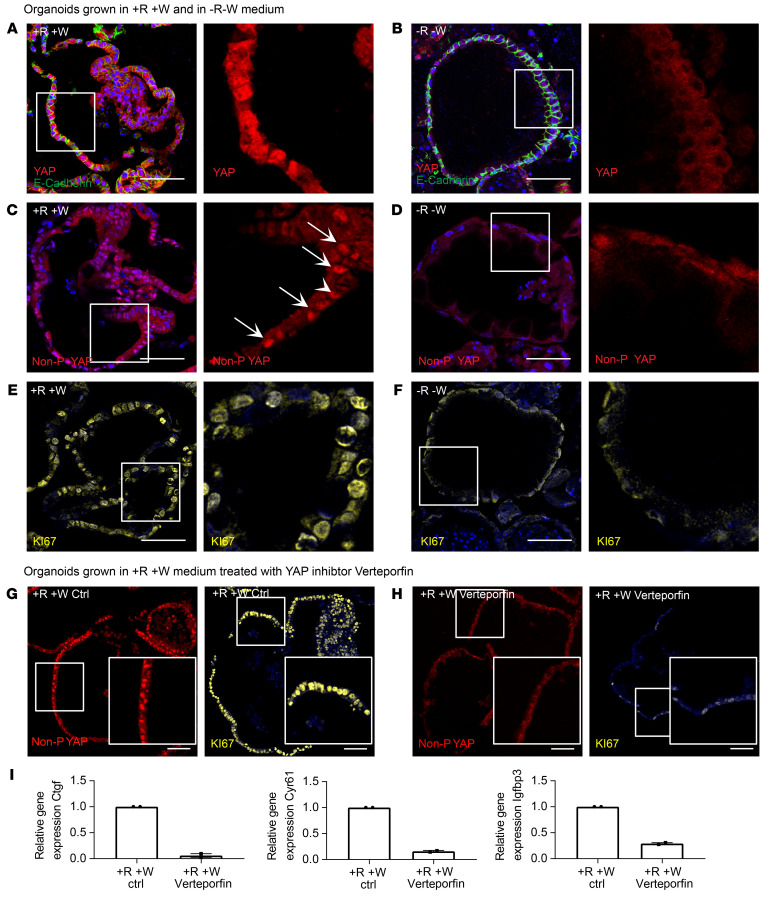
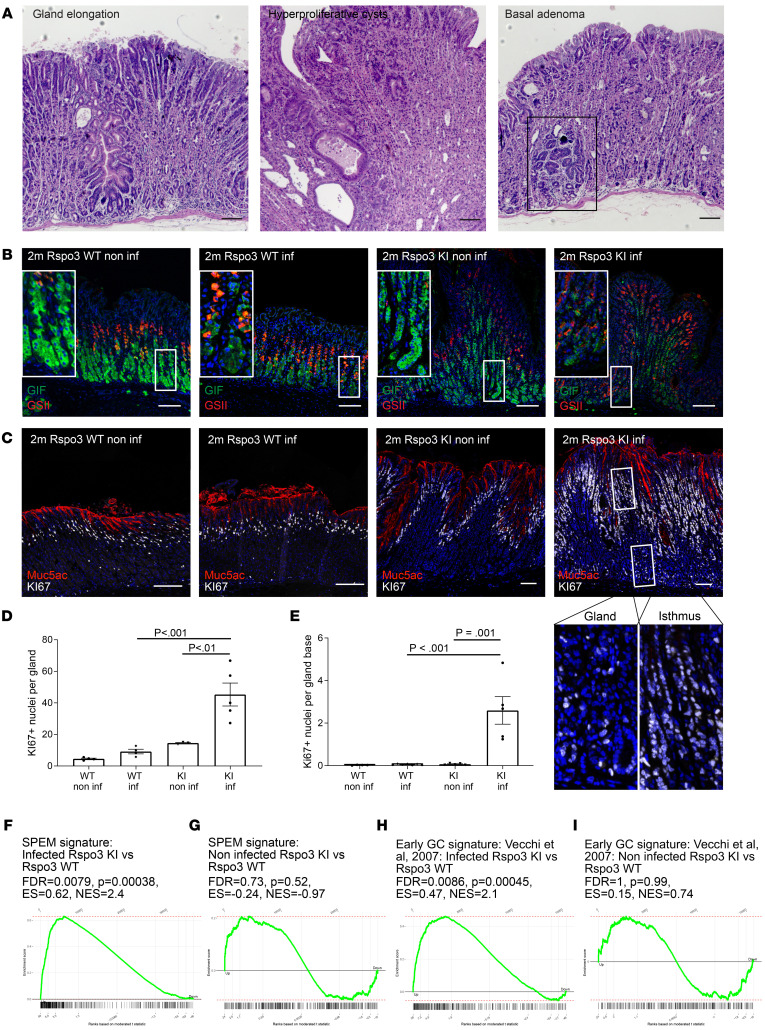
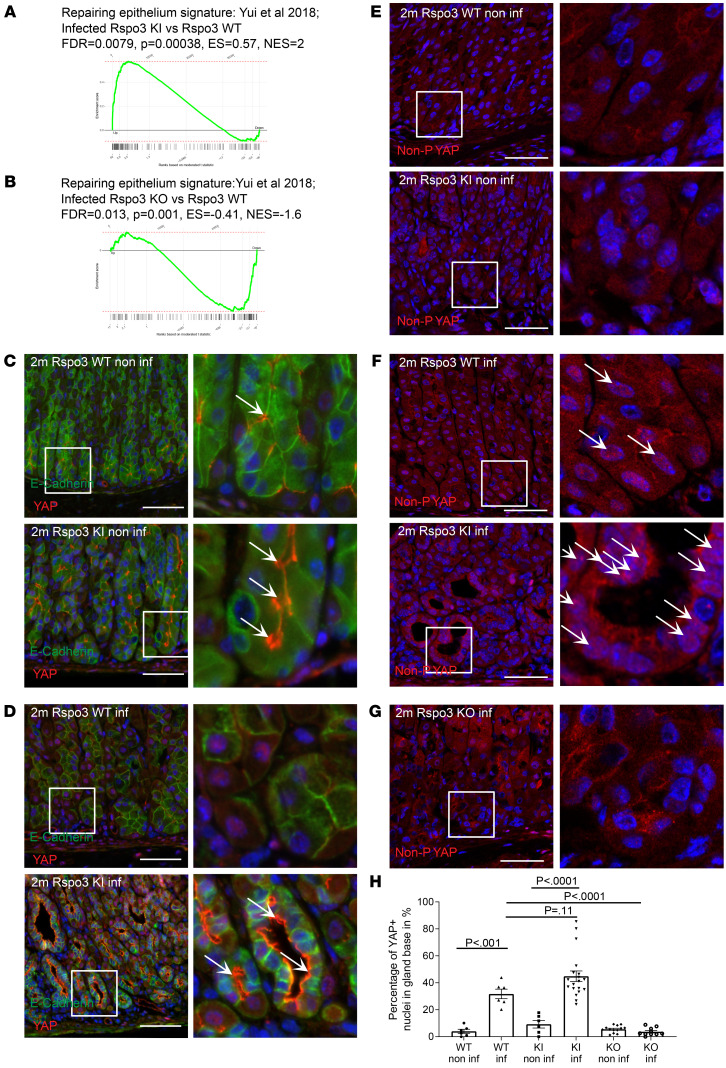
The stomach corpus epithelium is organized into anatomical units that consist of glands and pits. Mechanisms that control the cellular organization of corpus glands and enable their recovery upon injury are not well understood. R-spondin 3 (RSPO3) is a WNT-signaling enhancer that regulates stem cell behavior in different organs. Here, we investigated the function of RSPO3 in the corpus during homeostasis, upon chief and/or parietal cell loss, and during chronic Helicobacter pylori infection. Using organoid culture and conditional mouse models, we demonstrate that RSPO3 is a critical driver of secretory cell differentiation in the corpus gland toward parietal and chief cells, while its absence promoted pit cell differentiation. Acute loss of chief and parietal cells induced by high dose tamoxifen - or merely the depletion of LGR5+ chief cells - caused an upregulation of RSPO3 expression, which was required for the initiation of a coordinated regenerative response via the activation of yes-associated protein (YAP) signaling. This response enabled a rapid recovery of the injured secretory gland cells. However, in the context of chronic H. pylori infection, the R-spondin-driven regeneration was maintained long term, promoting severe glandular hyperproliferation and the development of premalignant metaplasia.

Keywords: Adult stem cells; Bacterial infections; Gastric cancer; Gastroenterology; Stem cells.


Conflict of interest statement

Conflict of interest: The authors have declared that no conflict of interest exists.

Figures

Figure 1
Figure 1. RSPO3 controls secretory cell differentiation in corpus glands.
(A) qPCR for expression of Rspo1–4 in Bl6 mice (n = 4). (B) ISH of Rspo3 (red) in corpus tissue of a nontreated MYH11-CreERT2; Rspo3WT/WT control mouse. (C) qPCR for Rspo3 expression in Rspo3-KO mice (n = 3) versus littermate controls (n = 4) and MYH11CreERT2-Rosa26CagRspo3 (Rspo3 KI) (n = 6) versus littermate controls (n = 6). (D) Immunofluorescence labeling for Ki67 (white) representative of Rspo3-KO and Rspo3-KI mice and littermate controls. (E) Location and relative size of the Ki67-positive gland compartment. (F) Quantification of the number of Ki67+ nuclei per gland in Rspo3-KO and Rspo3-KI mice and corresponding littermate controls (n = 3 mice per group). (G) Immunofluorescence labeling for GIF (green) representative of Rspo3-KO and Rspo3-KI mice and littermate controls. (H) Location and relative size of GIF-positive gland compartment. (I) Quantification of the number of GIF+ cells per gland in Rspo3-KO and Rspo3-KI mice and corresponding littermate controls (n = 3 mice per group). (J) Immunofluorescence labeling for GSII (red) representative of Rspo3-KO and Rspo3-KI mice and littermate controls. (K) Location and relative size of the GSII-positive gland compartment. (L) Quantification of the number of GSII+ cells per gland in Rspo3-KO and Rspo3-KI mice and corresponding littermate controls (n = 3 mice per group). (M) Immunofluorescence images of H/K-ATPase labeling (gray) in sections representative of Rspo3-KO and Rspo3-KI mice and corresponding littermate controls. (N) Quantification of parietal cells per gland in Rspo3-KO and Rspo3-KI mice and corresponding littermate controls (n = 3 mice per group). Mice were treated with tamoxifen 2 weeks before euthanasia. Scale bars: 100 μm. Enlargements in M equal 8:1 magnification. Unpaired parametric t test (C, E, F, H, and K); 1-way ANOVA with Tukey’s multiple-comparison test (A, I, and L).
Figure 2
Figure 2. RSPO3 induces glandular cell differentiation in organoids.
All organoids were grown from the murine corpus and kept in 10% RSPO1-conditioned medium. (A) Representative images of organoids grown in –R–W, –R+W, +R–W, and +R+W conditioned media. Scale bars: 500 μm. (BE) qPCR data showing expression of (B) GIF, (C) LGR5, (D) Muc6, and (E) Muc5ac in organoids grown in –R–W (4 replicates from 2 mice), –R+W (4 replicates from 2 mice), +R–W (2 replicates from 2 mice), and +R+W media (4 replicates from 2 mice). (F) Representative images of sections from organoids grown in +R+W and –R–W media stained for Ki67 (green), GIF (red), and GSII (white). (G) Representative images of sections from organoids grown in +R+W and –R–W media stained for MUC5AC (green). Scale bars: 50 μm. One-way ANOVA with Tukey’s multiple-comparison test.
Figure 3
Figure 3. RSPO3 is upregulated upon HDT-driven gland injury and upon depletion of LGR5+ chief cells and promotes glandular regeneration.
(A, B, D, E) Representative images of sections from (A and B) Rspo3-WT and (D and E) Rspo3-KO mice treated with HDT and sacrificed 1, 3, or 7 days later and nontreated controls stained for (A and D) H/K-ATPase (white) and (B and E) GIF (green), GSII (red), and Ki67 (yellow). (C) qPCR for Rspo3 expression in Rspo3-WT mice treated with HDT and sacrificed on day 1 (n = 6), 3 (n = 4), or 7 (n = 4) versus controls (n = 4). (F) Percentage of Ki67+ cells/gland in Rspo3-WT (n = 5) versus Rspo3-KO mice (n = 5) on day 1 after HDT-induced injury. (GL) LGR5DTR mice were treated with (GI) PBS or (JL) DT for 3 days and sacrificed 24 hours after treatment. Immunofluorescence labeling for (G and J) GIF (green), GSII (red), Ki67 (yellow), (H and K) Ki67, and (I and L) GIF and GSII on sections from PBS-treated mice. (MO) LGR5DTR mice were treated with DT for 3 days and sacrificed 3 days after treatment. Immunofluorescence labeling for (M) GIF (green), GSII (red), Ki67 (yellow), (N) Ki67, and (O) GIF and GSII. (P and Q) qPCR for (P) Rspo3 or (Q) GIF expression of DT-treated LGR5DTR mice sacrificed on day 1 (n = 5), 3 (n = 4), or 7 (n = 4 mice) versus controls (n = 4). (RW) Mice were treated with tamoxifen and DT 7 days before euthanasia. (R and U) EGFP expression of agarose sections from (R) LGR5-DTR/EGFP;MYH11-CreERT2;RspoWT/WT and (U) LGR5-DTR/EGFP;MYH11-CreERT2;Rspo3fl/fl mice. (S, T, V, and W) Representative images of sections from (S and T) LGR5-DTR/EGFP;MYH11-CreERT2;RspoWT/WT and (V and W) LGR5-DTR/EGFP;MYH11-CreERT2;Rspo3fl/ft mice stained for (S and V) Ki67 (yellow) and (T and W) GIF (green) and GSII (red). Scale bars: 100 μm. Enlargements in I, L, O, T, and W equal 2:1 magnification. Unpaired parametric t test (F), 1-way ANOVA with Tukey’s multiple-comparison test (C, P, and Q).
Figure 4
Figure 4. Glandular regeneration after HDT and upon chief cell loss is mediated through YAP.
(A) Immunofluorescence costaining for nonphosphorylated YAP (red) and E-cadherin (white) in Rspo3-WT mice treated with HDT for 2 days and sacrificed on day 1, 3, or 7 after treatment and nontreated control. (B) qPCR data showing expression of YAP target genes Ctgf, Igfbp3, and Cyr61 and the transcription factor Tead4 in the corpus of Rspo3-WT mice treated with HDT for 2 days and sacrificed on day 1 (n = 6) versus nontreated controls (n = 4). (C) Immunofluorescence staining for nonphosphorylated YAP (red) and E-cadherin (white) in Rspo3-WT and Rspo3-KO mice treated with HDT for 2 days and sacrificed on day 1 after treatment. (D) Quantification of YAP+ nuclei per image excluding parietal cells in Rspo3-WT and Rspo3-KO mice treated with HDT for 2 days and sacrificed on day 1 or day 3 after treatment and nontreated control. (E) Immunofluorescence costaining for nonphosphorylated YAP (red) and E-cadherin (white) in LGR5DTR mice treated with DT on 3 consecutive days and sacrificed on day 1 after treatment and nontreated littermates. (F) qPCR data showing expression of YAP target genes Ctgf, Igfbp3, and Cyr61 and the transcription factor Tead4 in the corpus of LGR5DTR mice (n = 3) treated with DT on 3 consecutive days and sacrificed on day 1 after treatment versus nontreated littermate controls (n = 3). Scale bars: 50 μm. Unpaired parametric t test (B and F); 1-way ANOVA with Tukey’s multiple-comparison test (D).
Figure 5
Figure 5. Proliferation in organoids is dependent on RSPO3-driven YAP expression.
All organoids were grown from the murine corpus and kept in 10% RSPO1 conditioned medium. (A and B) Representative immunofluorescence images of costaining for YAP (red) and E-cadherin (green) in sections from organoids grown in (A) +R+W and (B) –R–W media. (C and D) Representative immunofluorescence images of staining for nonphosphorylated (active nuclear) YAP (red) in sections from organoids grown in (C) +R+W and (D) –R–W media. (E and F) Representative immunofluorescence images of costaining for Ki67 (yellow) in sections from organoids grown in (E) +R+W and (F) –R–W media. Arrows highlight YAP-positive nuclei. (G) Representative immunofluorescence images of staining for nonphosphorylated (active nuclear) YAP (red) and Ki67 (yellow) in sections from organoids grown in full medium. (H) Representative immunofluorescence images of staining for nonphosphorylated (active nuclear) YAP (red) and Ki67 (yellow) of sections from organoids grown in full medium and treated with verteporfin for 24 hours. (I) qPCR data showing expression of YAP target genes Ctgf, Cyr61, and Igfbp3 of organoids grown in full medium and treated with verteporfin for 24 hours and nontreated control organoids (n = 2 per group). Scale bars: 50 μm.
Figure 6
Figure 6. RSPO3 causes glandular proliferation upon H. pylori infection.
(A) H&E staining of 2-month–infected Rspo3-KI mice. (B) Representative immunofluorescence images of costaining for GSII (red) and GIF (green) of sections from noninfected and 2-month–infected Rspo3-WT and Rspo3-KI mice. (C) Representative immunofluorescence images of Ki67 staining (white) and MUC5AC (red) of sections from noninfected and 2-month infected Rspo3-WT and Rspo3-KI mice. (D) Quantification of Ki67+ cells per gland of infected Rspo3-WT (n = 4 mice) and Rspo3-KI mice (n = 5) and noninfected littermate controls (n = 3–4). (E) Quantification of proliferating cells per gland base of infected Rspo3-WT (n = 7) and Rspo3-KI mice (n = 5) and noninfected littermate controls (n = 4–5). (F and H) GSEA of microarray data comparing the expression profile of the corpus tissue from 2-month–infected Rspo3-KI mice and infected littermate controls treated with tamoxifen 2 months before euthanasia with a published data set for (F) SPEM (28). (H) Early gastric cancer (GC) signature (29). (G and I) GSEA of microarray data comparing the expression profile of the corpus tissue from noninfected Rspo3-KI mice and noninfected littermate controls treated with tamoxifen 14 days before euthanasia with a published data set for (G) SPEM (28). (I) Early gastric cancer signature (29). ES, enrichment score; NES, normalized enrichment score. For GSEA, n = 2 mice per group. Scale bars: 100 μm. One-way ANOVA with Tukey’s multiple-comparison test.
Figure 7
Figure 7. Gland cells express YAP, which upon infection with H. pylori, is translocated to the nucleus.
(A and B) GSEA of microarray data comparing the expression profile of the corpus tissue from (A) 2-month–infected Rspo3-KI mice and infected littermate controls treated with tamoxifen 2 months before euthanasia, (B) 2-month–infected Rspo3-KO mice and infected littermate controls treated with tamoxifen 2 months before euthanasia with a published data set for repairing epithelium signature (22). (C and D) Representative immunofluorescence images of costaining for YAP (red) and E-cadherin (green) of sections from (C) noninfected and (D) infected Rspo3-KI and Rspo3-WT mice. Arrows show cytoplasmatic YAP. (EG) Representative immunofluorescence images of nonphosphorylated (=active nuclear) YAP (red) of sections from (E) noninfected, (F) infected Rspo3-WT, and Rspo3-KI mice, and (G) infected Rspo3-KO mice. (H) Percentage of epithelial YAP+ nuclei (costained with E-cadherin) in the gland bases of sections from noninfected and 2-month–infected Rspo3-KI, Rspo3-KO, and Rspo3-WT mice. For GSEA, n = 2 mice per group. Scale bars: 50 μm. One-way ANOVA with Tukey’s multiple-comparison test.

Comment in

References

    1. Demitrack ES, et al. NOTCH1 and NOTCH2 regulate epithelial cell proliferation in mouse and human gastric corpus. Am J Physiol Gastrointest Liver Physiol. 2017;312(2):G133–G144. doi: 10.1152/ajpgi.00325.2016. - DOI - PMC - PubMed
    1. Matsuo J, et al. Identification of stem cells in the epithelium of the stomach corpus and antrum of mice. Gastroenterology. 2017;152(1):218–231. doi: 10.1053/j.gastro.2016.09.018. - DOI - PubMed
    1. Karam SM, et al. Defining epithelial cell progenitors in the human oxyntic mucosa. Stem Cells. 2003;21(3):322–336. doi: 10.1634/stemcells.21-3-322. - DOI - PubMed
    1. Quante M, et al. TFF2 mRNA transcript expression marks a gland progenitor cell of the gastric oxyntic mucosa. Gastroenterology. 2010;139(6):2018–2027. doi: 10.1053/j.gastro.2010.08.003. - DOI - PMC - PubMed
    1. Mills JC, Shivdasani RA. Gastric epithelial stem cells. Gastroenterology. 2011;140(2):412–424. doi: 10.1053/j.gastro.2010.12.001. - DOI - PMC - PubMed

Publication types

Substances