. 2022 Oct 24;7(20):e153471.
doi: 10.1172/jci.insight.153471.

Single-cell transcriptomics reveals skewed cellular communication and phenotypic shift in pulmonary artery remodeling

Affiliations

Single-cell transcriptomics reveals skewed cellular communication and phenotypic shift in pulmonary artery remodeling

Slaven Crnkovic et al. JCI Insight. .

Abstract

A central feature of progressive vascular remodeling is altered smooth muscle cell (SMC) homeostasis; however, the understanding of how different cell populations contribute to this process is limited. Here, we utilized single-cell RNA sequencing to provide insight into cellular composition changes within isolated pulmonary arteries (PAs) from pulmonary arterial hypertension and donor lungs. Our results revealed that remodeling skewed the balanced communication network between immune and structural cells, in particular SMCs. Comparative analysis with murine PAs showed that human PAs harbored heterogeneous SMC populations with an abundant intermediary cluster displaying a gradient transition between SMCs and adventitial fibroblasts. Transcriptionally distinct SMC populations were enriched in specific biological processes and could be differentiated into 4 major clusters: oxygen sensing (enriched in pericytes), contractile, synthetic, and fibroblast-like. End-stage remodeling was associated with phenotypic shift of preexisting SMC populations and accumulation of synthetic SMCs in neointima. Distinctly regulated genes in clusters built nonredundant regulatory hubs encompassing stress response and differentiation regulators. The current study provides a blueprint of cellular and molecular changes on a single-cell level that are defining the pathological vascular remodeling process.

Keywords: Hypertension; Pulmonology; Vascular Biology.


Figures
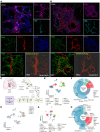
Figure 1
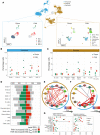
Figure 1. Pulmonary artery niche is composed of diverse structural and immune cell populations.
(A and B) Representative 3-dimensional (3D) images of precision-cut human lung slices (200 μm thickness, n = 5) from donor (A) and idiopathic pulmonary arterial hypertension (IPAH) patient (B) stained against endothelial cells (VWF, cyan), smooth muscle cells (ACTA2, red), fibroblasts (DCN, magenta), and immune cells (CD45, green). DAPI, nuclei (blue, top panel). 3D rendering of the smooth muscle cells (red) and immune cells embedded in the arterial wall (yellow). Scale bar = 200 μm. (C) Scheme of human pulmonary artery (PA) processing for single-cell RNA sequencing (scRNA-Seq). (D) Uniform manifold approximation and projection (UMAP) of the PA scRNA-Seq data of donor (n = 3) and pulmonary arterial hypertension (PAH) samples (n = 3). (E) Annotated UMAP of human PA scRNA-Seq. (F) Sunburst plot representing human PA cell populations’ proportions. (G) Annotated UMAP of scRNA-Seq captured from normoxia (n = 3) and 3 weeks’ hypoxia (n = 3) murine PAs. (H) Sunburst plot representing murine PA cell populations’ proportions. Fibro, fibroblasts; SMC1, smooth muscle cells 1; SMC 2/pericyte, smooth muscle cells 2 and pericytes; Endo 1,2,3/EC1,2, endothelial cells 1,2,3; Epithelial 1,2/Epit1,2, epithelial cells 1,2; Mono/Macs 1,2,3, monocytes and macrophages 1,2,3; prolif T cells, proliferating T cells; RBC, red blood cells; DC, dendritic cells.
Figure 2
Figure 2. Vascular remodeling alters intercellular signaling in human pulmonary artery.
(A) Uniform manifold approximation and projection (UMAP) of pulmonary artery (PA) single-cell RNA sequencing (scRNA-Seq) from donors (n = 3) and pulmonary arterial hypertension (PAH) patients (n = 3) annotated and subdivided into structural, immune, and epithelial cell types. Endo 1,2, endothelial cells 1,2; Fibro, fibroblasts; SMC 1,2, smooth muscle cells 1,2; DC, dendritic cells; Mono/Macs, monocytes and macrophages. (B and C) Cell population percentage of (B) structural and (C) immune cell types in donor (green) and PAH (red) samples. T test, *P < 0.05. (D) Bar plot representing differentially expressed gene (DEG) analysis performed on PA cell populations. Wilcoxon rank sum test with Bonferroni adjustment, P < 0.05. Gray bars indicate the total number of DEG terms highlighted from the analysis while colored part indicates the proportion of DEG terms significantly enriched in PAH (red) and donor (green). Ligand-receptor interactions performed on (E) donor and (F) PAH PA structural and immune cell types using FANTOM5 project with added weights according to STRING database. Thickness of arrows is relative to total number of found interaction pairs; color-coding depicts gradient of significant interactions. Permutation test (number of permutations = 100,000), P < 0.05. (G) Scheme representing differential expression of ligand-receptor pairs in donor (green) and PAH (red) PA. Gray dots represent ligands or receptors not detected in the analysis. Score assessed as the sum of the total ligand or receptor weights associated with every cell population.
Figure 3
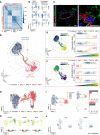
Figure 3. Human pulmonary artery possesses a specific smooth muscle cell–fibroblast intermediary cluster.
(A) Hierarchical clustering heatmap of top 10 genes enriched in smooth muscle cell (SMC) and fibroblast clusters. Wilcoxon rank sum test with Bonferroni adjustment, P < 0.05 and |log2(fold change)| > 0.25. (B) Uniform manifold approximation and projection (UMAP) expression plots of ACTA2, TAGLN, MYH11 and PDGFRA, and DCN and COL1A1. The color gradient represents the average expression across the fibroblasts and SMC clusters. (C) Representative immunofluorescence staining of ACTA2 (red, medial layer), PDGFRA (green, adventitial layer), VWF (gray, intima layer), and DAPI (blue, nuclei) in human formalin-fixed, paraffin-embedded (FFPE) lung tissue. Scale bar = 20 μm (n = 5 vessels). (D) Trajectory inference overlaid on 3-dimensional (3D) UMAP of the extracted SMC and fibroblast clusters. (E and F) Color-coded pseudotime calculation overlaid on 3D UMAP of the extracted SMC and fibroblast subset using fibroblasts (E) and SMC1 (F) as root nodes (left panel). Scatterplots illustrating the different expression of canonical markers for fibroblasts (DCN), SMC2 (VCAN), and SMC (ACTA2) going along with the increase of pseudotime along the trajectory from fibroblast to SMC1 (E, right panel) or from SMC1 to fibroblast (F, right panel). (G) RNA velocity overlaid on UMAP of the extracted SMC and fibroblast subset. RNA velocity analysis identified 317 velocity genes across the data set. (H) RNA velocity of canonical markers for SMC (ACTA2), SMC2 (VCAN), and fibroblasts (DCN). (I) Integration of human and murine pulmonary artery single-cell RNA-Seq data set, showing the extracted fibroblast-SMC subset (left) with associated bar plot depicting cell composition (Fibroblasts, SMC1,2,3,4, right) in the 2 data sets. (J) UMAP expression plots of CFH and VCAN in integrated human and mouse fibroblast-SMC data set. The color gradient represents the average expression across the extracted fibroblast and SMC subset.
Figure 4
Figure 4. Pulmonary artery pericytes represent a minor group of ACTA2-positive cells.
(A) Uniform manifold approximation and projection (UMAP) expression plots of PDGFRB and NDUFA4L2. Color gradient represents the average expression across the fibroblasts and smooth muscle cell (SMC) clusters. (B) UMAP of the extracted fibroblast, SMC, and pericyte subsets. (C) Dot plot of the top 8 genes from the pericyte cluster (NDUFA4L2, GJA4, APOLD1, HIGD1B, LGI4, COX4I2, FABP4, and PDGFRB). Dot size represents percentage of cells expressing the gene; color gradient represents the average expression across the data set. (D) UMAP gene expression plot of NDUFA4L2. The color gradient represents the average expression across the entire pulmonary artery (PA) data set. (E) Representative immunofluorescence staining of the expression of NDUFA4L2-positive cells (in gray) embedded in different locations of the PA medial layer in human formalin-fixed, paraffin-embedded (FFPE) lung tissue (ACTA2, red; VWF, green; and DAPI, blue). Scale bar = 20 μm (n = 4). (F) UMAP of the extracted SMC subset resulting in 4 subclusters (SMC1,2,3,4, smooth muscle cell 1,2,3,4). (G) Hierarchical clustering heatmap of the top 50 marker genes across the SMC subset. Wilcoxon rank sum test with Bonferroni adjustment, P < 0.05. (H) Gene Ontology (GO) analysis performed on cluster-enriched genes. Fisher’s exact test with Benjamini-Hochberg adjustment, P < 0.05. (I) GO-based new nomenclature of the 4 SMC clusters (contractile, oxygen sensing, synthetic, fibroblast-like) with associated violin plot of 5 most enriched genes per cluster (ACTG2, CNN1, RAMP1, RGS5, TPM2 for contractile; APOE, FBLN1, LUM, TIMP1, VCAN for synthetic; FABP4, MT1M, MT2A, RGS16, SOCS3 for oxygen sensing; APOD, CFD, DCN, LUM, S100A10 for fibroblast-like).
Figure 5
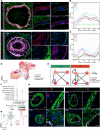
Figure 5. Pulmonary artery smooth muscle heterogeneity is shared between different human vascular beds but not conserved in murine pulmonary artery.
(A) Uniform manifold approximation and projection (UMAP) expression plots of markers RGS5, DCN, RGS16, and VCAN in the 4 smooth muscle cell (SMC) clusters. The color gradient for each marker 1 and marker 2 represents the average expression across the human pulmonary artery (PA) data set. (B) Representative immunofluorescence staining of the expression of different SMC population-designated markers in the medial layer of PAs (ACTA2 in cyan, RGS5 in green, RGS16 in yellow, DCN in magenta, VCAN in red, and DAPI as nuclear counterstain in blue). Scale bar = 50 μm (n = 5). (C) UMAP of the integration of the human PA single-cell RNA-sequencing (scRNA-Seq) data set and the human coronary artery (CA) scRNA-Seq data set. (D) Box plot representing the SMC cluster score in the 7 identified populations of the PA and CA integrated scRNA-Seq data set. SMC cluster scoring was inferred by calculating the average expression of the subpopulation-specific gene query (top 100 cluster-specific genes) and then subtracting the average expression of an equivalent set of randomly selected control genes across the data set. (E) UMAP expression plot of the SMC cluster scores in each of the data sets included in the PA and CA integrated scRNA-Seq data set. The color gradient for each score represents the average expression across the entire PA-CA data set. (F) UMAP of the integration of the human PA scRNA-Seq data set and the murine PA scRNA-Seq data set. (G) UMAP expression plot of the SMC cluster scores in each of the data sets included in the human and murine PA scRNA-Seq data set. The color gradient for each score represents the average expression across the entire human-murine PA data set.
Figure 6
Figure 6. Vascular remodeling causes phenotypic shift among pulmonary artery smooth muscle cell clusters.
(A) Representative immunofluorescence staining of 4 smooth muscle cell (SMC) clusters in donors (n = 4; pulmonary artery, PA, n = 7) and idiopathic pulmonary arterial hypertension (IPAH, n = 5; PA, n = 7) patients (RGS5 in red, DCN in green, COX4I2 in cyan, VCAN in magenta, ACTA2 in gray, DAPI in blue). Scale bar = 20 μm. Representative intensity (mean fluorescence intensity [arbitrary units]) histograms of the distribution of SMC cluster markers in donor (B) and IPAH (C) PA. (D) RNA velocity calculation overlaid on uniform manifold approximation and projection (UMAP) of the SMC subset. RNA velocity analysis identified 219 velocity genes across the data set. (E) Ligand-receptor analysis between SMC clusters in donor and PAH PAs. Permutation test (n = 100,000), P < 0.05. Arrows’ thickness is relative to total number of interaction pairs. (F) Dot plot of 8 proliferation-related genes. Dot size represents percentage of cells expressing the gene; color gradient represents the average expression across the SMC data set. (G) Representative immunofluorescence staining of MKI67 (n = 3 donors/5 PA; n = 5 IPAH/16 PA) and PCNA (n = 4 donors or IPAH, 21 PAs from donors or IPAH) in PA from donor and IPAH tissue samples (ACTA2 in green, MKI67 or PCNA in red, VWF in gray, and DAPI in blue). Scale bar = 20 μm. (H) UMAP of cell cycle scoring for G1, G2M, and S phase in the extracted SMC data set from donor and PAH PAs.
Figure 7
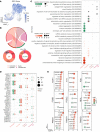
Figure 7. Smooth muscle cells feature cluster-distinct regulation of gene expression upon pulmonary vascular remodeling.
(A) Uniform manifold approximation and projection (UMAP) with overlay counting of the differentially expressed genes (DEGs) in healthy and remodeled pulmonary arteries (PAs) in each smooth muscle cell (SMC) cluster. Wilcoxon rank sum test with Bonferroni adjustment, P < 0.05 and |log2(fold change)| > 0.25. (B) Chord diagram and associated pie charts of DEGs upon vascular remodeling in each SMC cluster. (C) Gene ontology (GO) enrichment analysis resulting from down- and upregulated DEGs upon vascular remodeling in each SMC cluster. Dot size depicts number of genes included in each specific GO term; color-coding corresponds to significance. Fisher’s exact test with Benjamini-Hochberg adjustment, P < 0.05. (D) Dot plot representing DEGs enriched in specific transcription factors in donor (green) and PAH (red) from ChEA3. (E) Dot plot depicting regulation (log2 fold change) for several manually selected genes in contractile and synthetic SMC clusters and their putative transcription factor regulator.

References

    1. Stacher E, et al. Modern age pathology of pulmonary arterial hypertension. Am J Respir Crit Care Med. 2012;186(3):261–272. doi: 10.1164/rccm.201201-0164OC. - DOI - PMC - PubMed
    1. Nathan SD, et al. Pulmonary hypertension in chronic lung disease and hypoxia. Eur Respir J. 2019;53(1):1801914. doi: 10.1183/13993003.01914-2018. - DOI - PMC - PubMed
    1. Guazzi M, Naeije R. Pulmonary hypertension in heart failure: pathophysiology, pathobiology, and emerging clinical perspectives. J Am Coll Cardiol. 2017;69(13):1718–1734. doi: 10.1016/j.jacc.2017.01.051. - DOI - PubMed
    1. Hoffmann J, et al. Distinct differences in gene expression patterns in pulmonary arteries of patients with chronic obstructive pulmonary disease and idiopathic pulmonary fibrosis with pulmonary hypertension. Am J Respir Crit Care Med. 2014;190(1):98–111. doi: 10.1164/rccm.201401-0037OC. - DOI - PubMed
    1. Hoffmann J, et al. Compartment-specific expression of collagens and their processing enzymes in intrapulmonary arteries of IPAH patients. Am J Physiol Lung Cell Mol Physiol. 2015;308(10):L1002–L1013. doi: 10.1152/ajplung.00383.2014. - DOI - PMC - PubMed

Publication types