. 2022 Nov 1;132(21):e159579.
doi: 10.1172/JCI159579.

Immune dysfunction signatures predict outcomes and define checkpoint blockade-unresponsive microenvironments in acute myeloid leukemia

Affiliations

Immune dysfunction signatures predict outcomes and define checkpoint blockade-unresponsive microenvironments in acute myeloid leukemia

Sergio Rutella et al. J Clin Invest. .

Abstract

BackgroundImmune exhaustion and senescence are dominant dysfunctional states of effector T cells and major hurdles for the success of cancer immunotherapy. In the current study, we characterized how acute myeloid leukemia (AML) promotes the generation of senescent-like CD8+ T cells and whether they have prognostic relevance.METHODSWe analyzed NanoString, bulk RNA-Seq and single-cell RNA-Seq data from independent clinical cohorts comprising 1,896 patients treated with chemotherapy and/or immune checkpoint blockade (ICB).ResultsWe show that senescent-like bone marrow CD8+ T cells were impaired in killing autologous AML blasts and that their proportion negatively correlated with overall survival (OS). We defined what we believe to be new immune effector dysfunction (IED) signatures using 2 gene expression profiling platforms and reported that IED scores correlated with adverse-risk molecular lesions, stemness, and poor outcomes; these scores were a more powerful predictor of OS than 2017-ELN risk or leukemia stem cell (LSC17) scores. IED expression signatures also identified an ICB-unresponsive tumor microenvironment and predicted significantly shorter OS.ConclusionThe IED scores provided improved AML-risk stratification and could facilitate the delivery of personalized immunotherapies to patients who are most likely to benefit.TRIAL REGISTRATIONClinicalTrials.gov; NCT02845297.FUNDINGJohn and Lucille van Geest Foundation, Nottingham Trent University's Health & Wellbeing Strategic Research Theme, NIH/NCI P01CA225618, Genentech-imCORE ML40354, Qatar National Research Fund (NPRP8-2297-3-494).

Keywords: Cancer immunotherapy; Cellular senescence; Hematology; Leukemias.


Figures
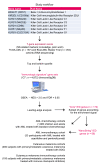
Figure 1
Figure 1. Study workflow.
Immune Signature Data Base (100); IED, immune effector dysfunction; NES, normalized enrichment score; FDR, false discovery rate; SOC, standard of care.
Figure 2
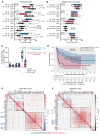
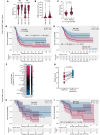
Figure 2. Markers of T cell senescence correlate with impaired T cell killing and poor clinical outcomes.
(A) Flow-sorted AML blasts were cocultured with autologous, patient-derived CD8+ T cells (n = 13 patients) for 5 days. Data were compared using the Kruskal-Wallis test. TW = Transwell insert; BL = AML blasts; Mono = monocytes. (B) Flow-sorted healthy-donor monocytes were cocultured with patient-derived CD8+ T cells (n = 9 patients) for 5 days. (C) In vitro killing of primary CD33+ CD34+ AML blasts (n = 10 patients) after 48-hour culture with autologous, flow-sorted T cells in the presence of anti-CD33/CD3 and control bispecific T cell engager (BiTE) antibody constructs (effector/target ratio = 1:5). T cell cytotoxicity was determined by flow cytometry, as detailed in the Supplemental Methods. (D) Kaplan-Meier estimates of OS in patients (JHU1 cohort, n = 43 patients) with senescent T cells above and below the optimal cut point, which was computed using the maxstat package in R. Survival curves were compared using a log-rank test. Median OS is indicated (color-coded by the optimal cut point of the proportion of CD3+CD8+CD57+KLRG1+ T cells). (E and F) Correlograms showing coexpression of NK and T cell markers in (E) TCGA-AML and (F) Beat-AML cases. The correlation matrix was reordered using the hclust function. Rectangles were drawn based on the results of hierarchical clustering (Euclidean distance, complete linkage). Inhibitory receptors (CD244, BTLA, CD160, TIGIT, LAG3, and PDCD1) are highlighted in red. NK cell, T cell, monocyte-macrophage (CD14, CD68, and CD163), and AML-associated markers (CD34, IL3RA, KIT, and THY1) were selected by integrating knowledge from multiple publications (10, 25, 101).
Figure 3
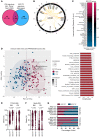
Figure 3. Signatures of immune effector dysfunction correlate with immune infiltration and with adverse-risk molecular features in the TCGA-AML and Beat-AML cohorts.
(A) Overlap between the IED172 signature genes from this study and published signatures that predict chemotherapy refractoriness as well as response to bispecific T cell engagers (2). IFN, interferon; IED, Immune effector dysfunction. (B) Semantic similarity between the IED172 genes in the context of their chromosomal location (XGR [eXploring Genomic Relations] web tool [ref. 102]). The degree of similarity between genes is visualized by the color of the links, with light yellow representing a low degree of similarity and red representing more. The chromosomal locus of each gene is indicated by the numbers and colors along the outer rim of the diagram. GO:MF, gene ontology molecular functions. (C) Correlation between the IED172 score and previously published immune traits (n = 45) (2, 42) in TCGA-AML (n = 157 patients). Signature scores are available through the original publications. (D) Correlation between the IED172 score and previously published immune traits and PARADIGM scores (n = 68; downloaded from the UCSC Xena data portal [https://xenabrowser.net/datapages/]; refs. 40, 44). The principal component analysis (PCA) plot was generated using the ggfortify and ggplot2 R packages. The top contributors to the first and second PC (n = 20) are shown as a bar graph. The dotted reference line in the bar graph indicates the expected value if the contribution were uniform. Any feature above the reference line can be considered as important in contributing to the dimension. (E) IED172 scores and percentage of blasts at diagnosis in TCGA-AML cases. Data were compared using the Mann-Whitney U test for unpaired determinations. PB = peripheral blood. (F) IED172 scores and leukemia burden at diagnosis in Beat-AML cases (n = 264). Data were compared using the Mann-Whitney U test for unpaired determinations. (G) Stacked bar graph showing the proportion of IED172hi and IED172lo cases harboring mutations of TP53, RUNX1, ASXL1, DNMT3A, NPM1, and FLT3–internal tandem duplication (ITD). Mut, mutated.
Figure 4
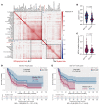
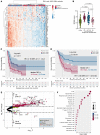
Figure 4. Covarying gene programs of immune effector dysfunction and stemness in the TCGA-AML cohort.
(A) Pairwise correlation between transcriptomic traits of immune infiltration and LSC17/IED172 scores. Nonsignificant P values are shown as blank boxes. Modules, including traits that are densely connected (hubs), are identified based on hierarchical clustering (Euclidean distance, complete linkage) and are shown in black boxes. The IED172 and LSC17 scores are highlighted in red. IED, Immune effector dysfunction. (B) LSC17 score in IED172hi and IED172lo TCGA cases (n = 157; median split). Data were compared using the Mann-Whitney U test for unpaired determinations. (C) Inferred relative frequency of hematopoietic stem cells (HSCs) in patients with IED172hi or IED172lo, as estimated by xCELL (54). Precalculated TCGA scores were downloaded from https://xcell.ucsf.edu/ (D) Kaplan-Meier estimates of overall survival (OS) in patients with IED172hi with above-median and below-median LSC17 scores. Survival curves were compared using a log-rank test. HR, hazard ratio. (E) Kaplan-Meier estimates of OS in patients with IED172lo with above-median and below-median LSC17 scores.
Figure 5
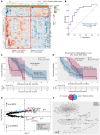
Figure 5. Predictive ability of immune effector dysfunction gene programs in the TCGA-AML cohort.
(A) Area under the receiver operating characteristic (AUROC) curve measuring the predictive ability of the prognostic index (PI24) genes for overall survival (n = 157 TCGA cases). (B) Forest plot (ggforest function in survminer package in R) of pretreatment features (WBC count at diagnosis, percentage of bone marrow blasts, FLT3-ITD and NPM1 mutational status, patient age at diagnosis), and RNA-based scores associated with survival in multivariate Cox proportional hazard analyses (PI24, LSC17, and IFN scores; refs. 2, 47, 52). HR = hazard ratio for death. (C) Kaplan-Meier estimates of relapse-free survival (RFS) in patients with TCGA-AML with above-median and below-median PI24 scores, which were calculated using β values from Cox regression analyses of gene expression and patient survival (56). Survival curves were compared using the log-rank test. (D) Kaplan-Meier estimates of OS in TCGA-AML patients with above-median and below-median PI24 scores. Survival curves were compared using the log-rank test.
Figure 6
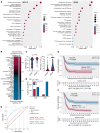
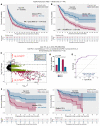
Figure 6. Immune effector dysfunction scores correlate with immune infiltration, stemness, primary induction failure, and patient outcome in an external AML cohort.
(A) Bubble plot depicting enriched REACTOME pathways (https://reactome.org/) in IED172 and IED68 signature genes (clusterProfiler package in R), which were ranked based on the gene ratio (gene count divided by set size). IED, immune effector dysfunction. (B) Correlation between the IED68 score and previously published immune traits (n = 45; refs. 2, 42) in the PMCC cohort (n = 290 patients). Signature scores are available in the original publications. (C) Correlation between IED68 scores and leukemia burden at diagnosis in the PMCC cohort. Data were compared using the Mann-Whitney U test for unpaired determinations. BM, bone marrow; PB, peripheral blood. (D) Response to induction chemotherapy in patients with above-median and below-median prognostic index (PI20) scores in the PMCC cohort. PIF, primary induction failure following a standard 1 or 2 cycles of induction chemotherapy. CR, complete remission (defined as <5% BM blasts). (E) Kaplan-Meier estimates of relapse-free survival (RFS) in PMCC patients with above-median and below-median PI20 scores. Survival curves were compared using a log-rank test. HR, hazard ratio. (F) Kaplan-Meier estimates of overall survival (OS) in PMCC patients with higher than median and lower-than-median PI20 scores. Survival curves were compared using a log-rank test. (G) Area under the receiver operating characteristic (AUROC) curve measuring the predictive ability of the PI20 and the ELN cytogenetic risk classifier for OS. CI, confidence interval.
Figure 7
Figure 7. Immune effector dysfunction scores correlate with immune infiltration and separate survival in pediatric AML cohorts.
(A) Leukemia burden in COG-TARGET AML cases (n = 145) with above-median and below-median IED172 scores. Data were compared using the Mann-Whitney U test for unpaired determinations. BM, bone marrow; PB, peripheral blood; IED, immune effector dysfunction. (B) WBC count at diagnosis in COG-TARGET AML cases with above-median and below-median IED172 scores. Data were compared using the Mann-Whitney U test for unpaired determinations. (C) IED172 scores at time of AML diagnosis and response assessment (bulk RNA-Seq data from matched BM samples available in 31 COG-TARGET AML cases). (D) Kaplan-Meier estimate of relapse-free survival (RFS) in patients from the COG-TARGET AML cohort with above-median and below-median prognostic index (PI24) scores. Survival curves were compared using a log-rank test (survminer package in R). HR, hazard ratio. (E) Kaplan-Meier estimate of overall survival (OS) in patients from the COG-TARGET AML cohort with above-median and below-median PI24 scores. (F) Correlation between the IED68 score and previously published immune traits (n = 45) in the CHOP AML series (n = 40). Signature scores are available through the original publications (2, 42). (G) IED68 scores in samples from the CHOP AML series collected at time of diagnosis and response assessment (n = 14 matched BM samples). Data were compared using the Wilcoxon’s matched-pairs signed-rank test. (H) Kaplan-Meier estimates of RFS in patients from the CHOP AML cohort with above-median and below-median PI20 scores. (I) Kaplan-Meier estimate of OS in patients from the CHOP cohort with above-median and below-median PI20 scores.
Figure 8
Figure 8. Immune effector dysfunction scores increase at time of response assessment and predict outcomes in additional external AML cohorts.
(A) Expression of the IED68 genes in patients from the SAL and JHU cohorts (n = 183 BM samples from 90 patients). The heatmap annotation track shows sample collection time points (baseline and post-chemotherapy response assessment). (B) IED68 score at time of diagnosis and response assessment (Kruskal-Wallis test with correction for multiple comparisons). Nonsignificant P values are not shown. CR = complete remission; PIF = primary induction failure; ER = early relapse (<6 months after the achievement of CR); LR = late relapse (>6) months after the achievement of CR); IED = immune effector dysfunction. (C) Kaplan-Meier estimate of relapse-free survival (RFS; data available in 56 subjects) in higher-than-median and lower-than-median PI20 groups. HR = hazard ratio. (D) Kaplan-Meier estimate of overall survival (OS; data available in 90 subjects) in higher-than-median and lower-than-median PI20 groups. (E) Volcano plot showing differentially expressed genes (DEGs) between samples collected at baseline and post-chemotherapy (post-CT) response assessment (EnhancedVolcano package in R). Genes discussed in the paper are named. (F) Graphical summary of over-representation analysis (clusterProfiler package in R) showing the overlap between DEGs (post-chemotherapy versus baseline) and curated cell type signature gene sets (C8 collection), which were retrieved from the MSigDB (http://www.gsea-msigdb.org/gsea/index.jsp). Gene ratio = gene count divided by set size.
Figure 9
Figure 9. Immune effector dysfunction scores predict response to AZA+Pembro in clinical trial NCT02845297.
(A) Differentially expressed genes (DEGs) at baseline associated with complete response (CResp) to AZA+Pembro (n = 33 patients). The heatmap annotation track shows the prognostic index (PI20) group and response status (complete remission [CR] and nonresponder [NR]) after 2 cycles of azacitidine and pembrolizumab. Complete response was defined as CR, CR with partial hematologic recovery (CRh), CR with incomplete hematologic recovery (CRi), or morphological leukemia-free state (MLFS) at the end of cycle 2. Patients with partial response (PR; >50% decrease in bone marrow blasts from baseline to 5%–25% at the end of cycle 1) were categorized as NRs. C, cluster. (B) Area under the receiver operating characteristic (AUROC) curve measuring the predictive ability of IED68 genes for response to AZA+Pembro. CI, confidence interval. (C) Kaplan-Meier estimate of overall survival (OS) in patients with above-median and below-median PI20. Survival curves were compared using the Gehan-Breslow-Wilcoxon’s test, a generalization of the Wilcoxon’s rank-sum test that attributes more weight to deaths at early time points. HR, hazard ratio. (D) Kaplan-Meier estimate of OS in patients with above-median and below-median IFN scores, which were computed as previously published (2). Survival curves were compared using the Gehan-Breslow-Wilcoxon’s test. (E) Volcano plot showing DEGs between baseline and end-of-cycle 2 (EO2) bone marrow samples. The top 20 DEGs are named. (F) The overlap between DEGs post-reatment versus baseline in the chemotherapy (CT; SAL and JHU2) and AZA+Pembro patient series is shown as a Venn diagram. Nonredundant, enriched gene ontologies in DEGs between the CT and AZA+Pembro cohorts were visualized as a network diagram (cnetplot) with color nodes using the cnetplot function of the GOSemSim package in R (67).
Figure 10
Figure 10. Immune effector dysfunction (IED) scores predict immunotherapy response in melanoma.
(A) Progression-free survival (PFS) in 427 patients with melanoma from the TCGA Pan-Cancer Atlas profiling project. Participants were stratified based on an optimal cut point of the prognostic index (PI24) (value, 0.862). Survival curves were compared using a log-rank test. RNA-Seq and outcomes data were retrieved through the cBioPortal for Cancer Genomics (https://www.cbioportal.org/). HR, hazard ratio. (B) Overall survival (OS) in patients with melanoma from the TCGA Pan-Cancer Atlas cohort. (C) Volcano plot showing differentially expressed genes (DEGs) between patients with PI24hi or PI24lo in the PRJEB23709 immunotherapy cohort (73 participants with melanoma treated with standard-of-care single-agent nivolumab or pembrolizumab (n = 41) or combination anti–PD-1 + anti–CTLA-4 (n = 32; Supplemental Table 10). RNA-Seq and outcome data were retrieved through the original publication (72) and the Tumor Immune Dysfunction and Exclusion (TIDE) portal (http://tide.dfci.harvard.edu/login/) (58). The top 15 DEGs are named. (D) Number of responders and nonresponders with above-median and below-median PI24 scores in the PRJEB23709 immunotherapy cohort. Fisher’s exact test. CR = complete response; PR, partial response. In the original publication (72), responders are defined as individuals with complete response, partial response, or stable disease of greater than 6 months with no progression, whereas nonresponders are defined as progressive disease or stable disease for less than or equal to 6 months before disease progression. (E) AUROC curve measuring the predictive ability of PI24 genes for response to ICB-based therapies in the PRJEB23709 cohort. CI, confidence interval. (F) PFS and OS in patients with melanoma in the PRJEB23709 immunotherapy cohort. Patients were dichotomized based on an optimal cut point of PI24 values (0.12 and 0.344 for PFS and OS, respectively).

Comment in

References

    1. Dohner H, et al. Diagnosis and management of AML in adults: 2017 ELN recommendations from an international expert panel. Blood. 2017;129(4):424–447. doi: 10.1182/blood-2016-08-733196. - DOI - PMC - PubMed
    1. Vadakekolathu J, et al. Immune landscapes predict chemotherapy resistance and immunotherapy response in acute myeloid leukemia. Sci Transl Med. 2020;12(546):eaaz0463. doi: 10.1126/scitranslmed.aaz0463. - DOI - PMC - PubMed
    1. Vago L, Gojo I. Immune escape and immunotherapy of acute myeloid leukemia. J Clin Invest. 2020;130(4):1552–1564. doi: 10.1172/JCI129204. - DOI - PMC - PubMed
    1. Zeidner JF, et al. Immunomodulation with pomalidomide at early lymphocyte recovery after induction chemotherapy in newly diagnosed AML and high-risk MDS. Leukemia. 2020;34(6):1563–1576. doi: 10.1038/s41375-019-0693-4. - DOI - PMC - PubMed
    1. Daver N, et al. Efficacy, safety, and biomarkers of response to azacitidine and nivolumab in relapsed/refractory acute myeloid leukemia: a nonrandomized, open-label, phase II study. Cancer Discov. 2019;9(3):370–383. doi: 10.1158/2159-8290.CD-18-0774. - DOI - PMC - PubMed

Publication types

Associated data