. 2022 Sep 23;50(17):9948-9965.
doi: 10.1093/nar/gkac741.

Lamin A/C impairments cause mitochondrial dysfunction by attenuating PGC1α and the NAMPT-NAD+ pathway

Affiliations

Lamin A/C impairments cause mitochondrial dysfunction by attenuating PGC1α and the NAMPT-NAD+ pathway

Scott Maynard et al. Nucleic Acids Res. .

Abstract

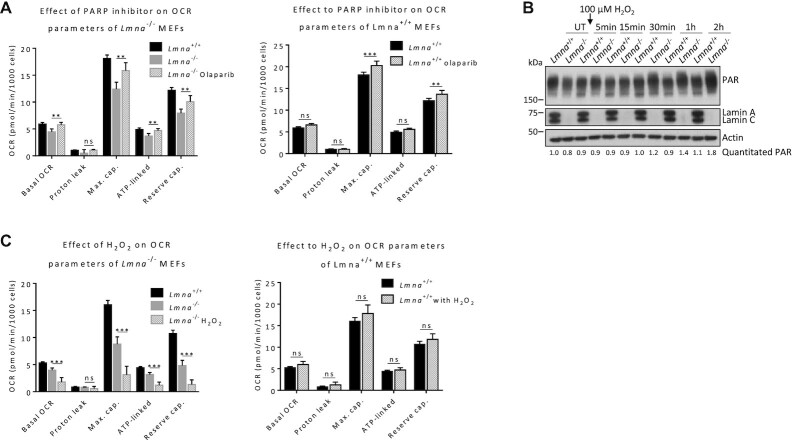
Mutations in the lamin A/C gene (LMNA) cause laminopathies such as the premature aging Hutchinson Gilford progeria syndrome (HGPS) and altered lamin A/C levels are found in diverse malignancies. The underlying lamin-associated mechanisms remain poorly understood. Here we report that lamin A/C-null mouse embryo fibroblasts (Lmna-/- MEFs) and human progerin-expressing HGPS fibroblasts both display reduced NAD+ levels, unstable mitochondrial DNA and attenuated bioenergetics. This mitochondrial dysfunction is associated with reduced chromatin recruitment (Lmna-/- MEFs) or low levels (HGPS) of PGC1α, the key transcription factor for mitochondrial homeostasis. Lmna-/- MEFs showed reduced expression of the NAD+-biosynthesis enzyme NAMPT and attenuated activity of the NAD+-dependent deacetylase SIRT1. We find high PARylation in lamin A/C-aberrant cells, further decreasing the NAD+ pool and consistent with impaired DNA base excision repair in both cell models, a condition that fuels DNA damage-induced PARylation under oxidative stress. Further, ATAC-sequencing revealed a substantially altered chromatin landscape in Lmna-/- MEFs, including aberrantly reduced accessibility at the Nampt gene promoter. Thus, we identified a new role of lamin A/C as a key modulator of mitochondrial function through impairments of PGC1α and the NAMPT-NAD+ pathway, with broader implications for the aging process.


Figures

Figure 1.
Figure 1.
Lamin A/C knockout MEFs exhibit impaired mitochondrial respiration and reduced NAD+ biosynthesis. All measurements were performed on Lmna−/− MEFs and control (Lmna+/+) MEFs. (A) Seahorse mitochondrial flux analysis. The measurements were used to generate the OCR profile (left) and to calculate OCR parameters (right). (B) NAD+ levels were measured using an NAD+/NADH Assay Kit (Colorimetric). As a positive control, NAD+ was added into the medium of the Lmna+/+ MEFs at 2 mM for 24 h (labeled as Lmna+/+ NAD+). (C) Western blotting using antibodies against SIRT1, PGC1α and the NAD+ salvage pathway enzyme NAMPT. The NAMPT levels were significantly reduced and band quantification of its abundance is shown. (D) Nampt mRNA levels, determined by quantitative RT-PCR. Data are presented as mean ± SD (n = 3). All P values were calculated using two-sided, unpaired Student's t-test; ***P ≤ 0.001, **P ≤ 0.01, *P ≤ 0.05; ns, non-significant; cap., capacity.
Figure 2.
Figure 2.
Lamin A/C knockout results in reduced SIRT1 deacetylase activity (higher p53-lysine382 acetylation) and impaired PGC1α-chromatin interaction. (A) Western blotting for p53 acetylation in lysates prepared from Lmna−/− MEFs and control (Lmna+/+) MEFs. (B) Western blotting to assess the effect of oxidative stress (H2O2 at 800 μM for 5 h) on p53 acetylation. The relative abundance of acetyl (K382) p53/p53 corrected for actin is written below the image. (C) MEFs were treated with the SIRT1 inhibitor selisistat (2 μM for 24 h) and then lysates prepared and immunoblotted for p53 acetylation. The relative p53 acetylation was determined as a ratio of acetylated p53 to normal p53. (D) Immunoblotting of whole cell extracts and chromatin-enriched fractions of Lmna−/− and Lmna+/+ MEFs to assess levels of PGC1α in these fractions. The SIRT1 inhibitor was included to enable assessment of SIRT1 dependence. Data are presented as mean ± SD (n = 3). Replicates refer to lysates prepared from three separate experiments. All P values were calculated using two-sided, unpaired Student's t-test; **P ≤ 0.01, *P ≤ 0.05; ns, non-significant.
Figure 3.
Figure 3.
The effect of lamin A/C knockout on ROS levels, mitochondrial mass, OXPHOS components, mtDNA stability and mitophagy. (A) Flow cytometry analysis was performed on MEFs (Lmna+/+, Lmna−/−). Mitochondrial ROS was estimated from the DHE signal (superoxide indicator). Cellular ROS was estimated from the DCF signal (H2DCFDA, indicator of total cellular ROS). Total mitochondria mass was determined using MitoTracker green (MTG), and membrane potential was determined using TMRM. Membrane potential was calculated as TMRM/MTG. Data are presented as mean ± SD (n = 3). (B) Western blotting was performed using total OXPHOS antibody cocktail to determine the levels of subunits of each of the five OXPHOS complexes (CI-CV). Identity of subunits of each complex: CI = NDUFB8 (NADH dehydrogenase [ubiquinone] 1 beta subcomplex subunit 8), CII = SDHB (Succinate dehydrogenase [ubiquinone] iron-sulfur subunit), CIII = UQCRC2 (Cytochrome b-c1 complex subunit 2), CIV = MTCO1 (mitochondrially encoded cytochrome c oxidase I), CV = vATP5A (ATP synthase, H + transporting, mitochondrial F1 complex, alpha 1). Data are presented as mean ± SD (n = 3). Replicates refer to lysates prepared from three separate experiments. (C) High content imaging was performed to determine mitochondrial mass, nucleoid area, and nucleoid counts in Lmna+/+ MEFs (n = 6263 cells) and Lmna−/− MEFs (n = 10418 cells); mean ± SEM. Cells were fixed and stained with an antibody for mitochondrial outer membrane marker TOM20 for mitochondrial mass estimate, and with anti-dsDNA antibody for detection of nucleoid area and nucleoid counts. (D) Mitophagy rate was calculated by subtracting the % of TOM20 co-localizing with LC3 in control (PBS-treated) cells from % of TOM20 co-localizing with LC3 in chloroquine (CQ)-treated cells. Results are shown as the averages ± SEM of 3 independent experiments. All P values were calculated using two-sided, unpaired Student's t-test; ***P ≤ 0.001, **P ≤ 0.01, *P ≤ 0.05; ns, non-significant.
Figure 4.
Figure 4.
Effect of PARP1 inhibition and oxidative stress on mitochondrial bioenergetic parameters in Lmna−/− and Lmna−/− MEFs. (A) Cells were treated with 2 μM of PARP1 inhibitor olaparib for 2 h and analyzed by the Seahorse flux analyzer. The calculated bioenergetic parameters are shown. (B) Cells were treated with 100 μM H2O2 for 1 h, medium replaced with H2O2-free medium, and lysates collected at the indicated time points for western blotting; the blots were probed with the antibody against poly(ADP-ribose) (PAR). The relative abundance of PAR corrected for actin is written below the image. (C) Cells were treated with 100 μM H2O2 for 2 h and analyzed by the Seahorse flux analyzer. The calculated bioenergetic parameters are shown. Data are presented as mean ± SD (n = 6). All P values were calculated using two-sided, unpaired Student's t-test; ***P ≤ 0.001, **P ≤ 0.01; ns, non-significant; cap., capacity; UT, Untreated.
Figure 5.
Figure 5.
Chromatin accessibility is altered by lamin A/C depletion. (A) Bubble plots, showing the relative frequencies of ATAC-seq peaks with combinations of ATAC-seq changes (Y-axis) and transcriptional changes (X-axis), in Lmna−/− compared to Lmna+/+ MEFs, relative to the frequencies expected by change if ATAC-seq and transcriptional changes are unrelated. Bubble sizes illustrate -log10 P values Benjamini-Hochberg adjusted for multiple testing, and the color reflects the number of observed peaks in each category log2 normalized to the expected number. (B) Volcano plots, showing differences (X-axis) and significance (Y-axis) between ATAC-seq signal in Lmna−/− compared to Lmna+/+ MEFs. The color reflects the density of peaks with a given combination of change and P value. (C) Donut plots, showing the genome-wide localization of different subtypes of peaks relative to gene features and enhancers. A peak was assigned as ‘promotor’ if it was located within 1 kb of a TSS, ‘intragenic’ if it overlapped with any gene body, or ‘enhancer’, if it was located less than 1 kb from an enhancer midpoint in prioritized order. Peaks that were not assigned to any of these categories were assigned as ‘intergenic’. (D) Genome-browser tracks of ATAC-seq signal in Lmna−/− and Lmna+/+ MEFs at the Nampt locus. Values are FPKM normalized and the four replicates from each condition are rendered transparent and superimposed. ATAC-seq experiments were done on four biological replicates, and P values are Benjamini–Hochberg corrected for multiple testing.
Figure 6.
Figure 6.
HGPS fibroblasts exhibit impaired mitochondrial respiration, attenuation of NAD+ biosynthesis, reduced levels of specific OXPHOS components and lower PGC1α abundance. All measurements were performed on dermal fibroblasts from the indicated HGPS patients and normal counterparts (parent). (A) Seahorse mitochondrial flux analysis was performed; the calculated bioenergetic parameters are shown. Data are presented as mean ± SD (n = 3). (B) NAD+ levels were measured using an NAD+/NADH Assay Kit (Colorimetric). Data are presented as mean ± SD (n = 3). (C) Western blotting using antibodies against SIRT1, PGC1α and the NAD+ salvage pathway enzyme NAMPT. The PGC1α levels were significantly reduced and NAMPT levels enhanced, as shown graphically as the mean all three Normal/HGPS pairs (mean ± SD). (D) Western blotting was performed using total OXPHOS antibody cocktail to determine the levels of subunits of each of the five OXPHOS complexes (CI-CV). Identity of subunits of each complex: CI = NDUFB8 (NADH dehydrogenase [ubiquinone] 1 beta subcomplex subunit 8), CII = SDHB (Succinate dehydrogenase [ubiquinone] iron-sulfur subunit), CIII = UQCRC2 (Cytochrome b-c1 complex subunit 2), CIV = MTCO1 (mitochondrially encoded cytochrome c oxidase I), CV = vATP5A (ATP synthase, H + transporting, mitochondrial F1 complex, alpha 1). (E) High content imaging was performed to determine mitochondrial mass, nucleoid area, and nucleoid counts in HGPS fibroblasts (n = 359 cells for HGPS-1, 1183 cells for HGPS-2 and 302 cells for HGPS-3) and in normal fibroblasts (n = 613 cells for Normal-1, 250 cells for Normal-2 and 446 cells for Normal-3). Cells were fixed and stained with antibody for mitochondrial outer membrane marker TOM20 to enable an estimate of mitochondrial mass, and with anti-dsDNA antibody for detection of nucleoid area and nucleoid counts. Representative images are shown for Normal-2/HGPS-2 fibroblasts. Data are presented as mean ± SEM. All P values were calculated using two-sided, Student's t-test (unpaired except for part C which used paired analysis); ***P ≤ 0.001, **P ≤ 0.01, *P ≤ 0.05; ns, non-significant; cap., capacity.
Figure 7.
Figure 7.
HGPS fibroblasts are defective in DNA base excision repair. (A) Comet assays were performed on two pairs of HGPS and normal counterpart fibroblasts, as indicated. The cells were treated with 100 μM H2O2 for 1 h, the medium replaced with H2O2-free medium, and cells collected at the indicated time points for comet assay. The FPG enzyme, which cleaves at oxidative lesions, was incorporated into the assay to enable detection of FPG-sensitive sites (estimation of oxidative DNA damage). DNA repair efficiency was expressed as percent of FPG-sensitive sites remaining, at the indicated repair times, relative to 5 min of repair, after correction for the FPG-sensitive sites in untreated cells (n = 100 comet tails, mean ± SEM). P values were calculated using two-sided, unpaired Student's t-test. (B) Normal-1/HGPS-1 and Normal-2/HGPS-2 fibroblasts were treated with 100 μM H2O2 for 1 h, then the medium replaced with H2O2-free medium, and then lysates collected at the indicated time points and western blotting performed. The blot was probed with the antibody against poly(ADP-ribose) (PAR). The relative abundance of PAR corrected for actin is written below the image. (C) Survival assays were performed on HGPS-2 and its counterpart fibroblasts Normal-2. Oxidative DNA damage was induced and sustained by treatment for 6 h with hydrogen peroxide or 2 h with menadione; WST-1 cell proliferation and viability reagent was used to enable visualization of relative cell viability by absorbance readings (450 nm minus 630 nm). For survival assays, data are presented as mean ± SD (n = 6) and statistical significance was determined by two-way ANOVA Sidak's multiple comparisons test. In all cases, ***P ≤ 0.001, **P ≤ 0.01, *P ≤ 0.05; ns, non-significant; UT, Untreated.
Figure 8.
Figure 8.
Model depicting the effects of lamin A/C knockout (Lmna−/− MEFs) or endogenous progerin expression (HGPS fibroblasts) on mitochondrial function. The grey fill indicates occurrence in both Lmna−/− MEFs and in HGPS fibroblasts. The green fill indicates impaired NAD+ and PGC1α found in HGPS; specifically, reduced NAD+ levels as with Lmna−/− MEFs but without accompanying reduction in NAMPT levels, and unlike Lmna−/− MEFs the PGC1α protein level was reduced. Both high mitophagy and low SIRT1 activity likely contribute to the observed lower mitochondrial mass we observe in Lmna−/− MEFs. Impaired chromatin accessibility at the Nampt promoter may contribute to the low Nampt mRNA observed in Lmna−/− MEFs.

References

    1. Burke B., Stewart C.L.. The nuclear lamins: flexibility in function. Nat. Rev. Mol. Cell Biol. 2013; 14:13–24. - PubMed
    1. Shimi T., Pfleghaar K., Kojima S., Pack C.G., Solovei I., Goldman A.E., Adam S.A., Shumaker D.K., Kinjo M., Cremer T.et al. .. The A- and B-type nuclear lamin networks: microdomains involved in chromatin organization and transcription. Genes Dev. 2008; 22:3409–3421. - PMC - PubMed
    1. Gonzalo S. DNA damage and lamins. Adv. Exp. Med. Biol. 2014; 773:377–399. - PMC - PubMed
    1. Maynard S., Keijzers G., Akbari M., Ezra M.B., Hall A., Morevati M., Scheibye-Knudsen M., Gonzalo S., Bartek J., Bohr V.A.. Lamin A/C promotes DNA base excision repair. Nucleic Acids Res. 2019; 47:11709–11728. - PMC - PubMed
    1. Dubik N., Mai S.. Lamin A/C: function in normal and tumor cells. Cancers (Basel.). 2020; 12:3688. - PMC - PubMed

Publication types

MeSH terms