. 2022 Nov 11;50(20):e119.
doi: 10.1093/nar/gkac771.

A toolkit for the identification of NEAT1_2/paraspeckle modulators

Affiliations

A toolkit for the identification of NEAT1_2/paraspeckle modulators

Haiyan An et al. Nucleic Acids Res. .

Abstract

Paraspeckles are ribonucleoprotein granules assembled by NEAT1_2 lncRNA, an isoform of Nuclear Paraspeckle Assembly Transcript 1 (NEAT1). Dysregulation of NEAT1_2/paraspeckles has been linked to multiple human diseases making them an attractive drug target. However currently NEAT1_2/paraspeckle-focused translational research and drug discovery are hindered by a limited toolkit. To fill this gap, we developed and validated a set of tools for the identification of NEAT1_2 binders and modulators comprised of biochemical and cell-based assays. The NEAT1_2 triple helix stability element was utilized as the target in the biochemical assays, and the cellular assay ('ParaQuant') was based on high-content imaging of NEAT1_2 in fixed cells. As a proof of principle, these assays were used to screen a 1,200-compound FDA-approved drug library and a 170-compound kinase inhibitor library and to confirm the screening hits. The assays are simple to establish, use only commercially-available reagents and are scalable for higher throughput. In particular, ParaQuant is a cost-efficient assay suitable for any cells growing in adherent culture and amenable to multiplexing. Using ParaQuant, we identified dual PI3K/mTOR inhibitors as potent negative modulators of paraspeckles. The tools we describe herein should boost paraspeckle studies and help guide the search, validation and optimization of NEAT1_2/paraspeckle-targeted small molecules.


Figures

Figure 1.
Figure 1.
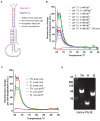
Characterisation of NEAT1_2 triple helix (TH) reconstituted in vitro. (A) Schematic representation of the NEAT1_2 TH structure. Sequences of RNA oligonucleotides ‘fragment 1’ and ‘fragment 2’ used for TH reconstitution are given in pink and blue, respectively. The apical loop adenosine excluded from the reconstituted TH is in grey. Watson–Crick base pairs are indicated with dashes, non-canonical base pairs - with dots, Hoogsteen base pairs—with Leontis-Westhof notation, and the A-minor interaction—with double dash. (B) Thermal melting curves for NEAT1_2 TH assembled in the ‘base’ buffer (20 mM Tris–HCl pH 7.0, 100 mM KCl) with different Mg2+ concentrations. Fluorescence signal of thiazole green intercalating dye added to the complex was recorded over the temperature range from 65°C to 90°C using a ramp rate of 0.5°C, and the change in the signal was plotted. Experiment was done in duplicates. (C) Thermal melting curves for NEAT1_2 TH and its structural RNA oligonucleotides (f1 and f2) prepared either by snap-cooling on ice and slow cooling at room temperature (RT, 25°C). Experiment was done in duplicates. (D) NEAT1_2 TH analysis by non-denaturing polyacrylamide electrophoresis (native PAGE). NEAT1_2 TH was reconstituted in a buffer with optimized composition (‘folding buffer’, 20 mM Tris–HCl pH 7.0, 100 mM KCl, 4 mM MgCl2) before loading on gel. L indicates RNA molecular weight marker. Representative gel is shown. Also see Supplementary Figure S1B.
Figure 2.
Figure 2.
Development of a fluorescent intercalator displacement (FID) assay for NEAT1_2 TH. (A) FID assay principle. TO-PRO, a carbocyanine dye which has negligible fluorescence becomes brightly fluorescent upon binding RNA. Four possible outcomes upon addition of a small molecule compound to the dye/RNA complexes are shown. (B) TO-PRO fluorescence intensity fold-change upon its binding to NEAT1_2 TH and A-site RNA substrates. Structures of both substrates are shown for comparison. Fluorescence was analysed at 5 min after RNA addition. Final RNA concentration was 0.5 μM. N = 3, ** P< 0.01 (Mann–Whitney U test). (C) Binding of known small molecule RNA ligands to NEAT1_2 TH and A-site RNA as measured by FID. Final concentration of both RNA substrates was 0.5 μM. N = 3, *P< 0.05, **P< 0.01, ***P< 0.001 (one way ANOVA with Dunnett's test for multiple comparisons).
Figure 3.
Figure 3.
Pilot small molecule library screen with FID assay to identify NEAT1_2 TH binders. (A) Workflow for the LOPAC®1280 library screening. Final RNA concentration was 0.25 μM. LOPAC®1280 compounds were tested at a final concentration of 10 μM in single replicates. (B) Assay quality accessed using the Z’ metric across 16 LOPAC®1280 plates. (C) LOPAC®1280 screen hit rates. (D) Normalized percent displacement (NPD) values for LOPAC®1280 compounds in this screen. For the hits, 5-, 15- and 60-min data points are given in blue, orange and green, respectively. Red data points correspond to the positive assay control (500 μM paromomycin). Red line indicates the threshold used to identify hits (70% NPD). Data points for the compounds taken into validation studies are circled.
Figure 4.
Figure 4.
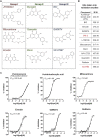
Compound chemistry grouping and dose–response analysis for LOPAC®1280 hits identified using the NEAT1_2 TH FID assay. (A) Structures of representative molecules for the three chemotype groups identified within the NEAT1_2 TH LOPAC®1280 hit-set. (B) Hits taken into validation studies and used for the secondary assay development, with their molecular weights indicated. Compounds in red failed in the concentration response studies. (C) Dose–response curves and IC50 values for selected hits determined with the primary FID assay. Paromomycin was the positive FID assay control. N = 3. See also Supplementary Figure S4.
Figure 5.
Figure 5.
Analysis of NEAT1_2 TH binding kinetics for LOPAC®1280 hits using grating-coupled interferometry (waveRAPID method). (A) Workflow for the NEAT1_2 TH binding kinetics analysis. 5′ biotin-TEG labelled NEAT1_2 TH and individual RNA oligonucleotides were immobilized on a streptavidin-coated sensor (one channel left blank) and binding of 12 LOPAC®1280 hits and 2 FID assay control compounds (paromomycin and chloramphenicol) was analysed at a single concentration of 10 μM with the waveRAPID method. Compounds were injected for 25 s total injection duration followed by 300 s dissociation. Paromomycin (green asterisks) was injected three times during the run to ensure that all compounds were tested under comparable conditions. Note that mitoxantrone produced an abnormally high peak and aurintricarboxylic acid (ATA, tested last) failed to dissociate (peaks for both compounds indicated with arrows). (B) Sensorgrams and fits for NEAT1_2 TH binding by FID assay controls paromomycin and chloramphenicol. The double-referenced response data (red) are fitted with a binding model (black lines). Raw data were analysed and fitting performed using ‘intermediate binders’ settings and one-to-one binding model. Data from a representative experiment are shown. (C) Sensorgrams and fits for selected LOPAC®1280 hits displaying different binding affinity and specificity for NEAT1_2 TH and individual RNA oligonucleotides. Note that GW5074 binds to NEAT1_2 and fragment 1 but not fragment 2; L-789106 binds to NEAT1_2 TH and fragment 2 but not fragment 1; and emodin binds to NEAT1_2 TH but not the individual fragments. Data from a representative experiment are shown.
Figure 6.
Figure 6.
Development of a cellular assay (‘ParaQuant’) for NEAT1_2/paraspeckles and its use for validation of selected LOPAC®1280 hits. (A) Paraspeckle visualisation in three stable cell lines in a 96-well format on a high-content imaging system using a commercial RNA-FISH probe. To induce NEAT1_2/paraspeckle accumulation, cells were treated with a known paraspeckle enhancer MG132 for 4 h. NEAT1_2/paraspeckles were visualized by RNA-FISH with a NEAT1_2 Stellaris® probe. Images were captured using Operetta CLS confocal system/Harmony software (40x objective lens), and maximum intensity projection images from three planes are shown. Scale bar, 20 μm. (B) Representative segmentation masks for paraspeckles and nuclei used for automated paraspeckle quantification. Raw image is a merged NEAT1_2 (Cy3) and DAPI image. Images are for HeLa cells. (C) Effect of short-term DMSO treatment on paraspeckles in three stable cell lines. Cells were exposed to increasing DMSO concentrations for 7 h; data from a representative experiment were plotted. N = 4 for all time-points and cell lines; **P< 0.01 (one-way ANOVA). Representative images of HeLa cells treated with 5.0% DMSO for 7 h are also shown. Scale bar, 20 μm. (D) Effect of prolonged DMSO treatment on paraspeckles in stable cell lines with low basal paraspeckles. Cells were exposed to increasing DMSO concentrations for 24 h; data from a representative experiment were plotted. N = 4 for all time-points; *P< 0.05, ***P< 0.001, ****P< 0.0001 (one-way ANOVA). (EF) Quantification of the MG132 effect on NEAT1_2/paraspeckles in the three cell lines used for assay development. Cells were treated with MG132 for 4 h. N = 8, 6 and 10 for SH-SY5Y, U2OS and HeLa cells, respectively; *P< 0.05, **P< 0.01; ***P< 0.001, ****P< 0.0001 (Mann–Whitney U test). Note low variability between the replicate wells and heatmap suitability for the initial analysis of the compound effect (F). (G) Z’ and signal window (SW) for the three cell lines used in the assay development for positive or negative NEAT1_2/paraspeckle modulation, with MG132 and DMSO used as positive assay controls, respectively. (H) Effect of the selected LOPAC®1280 hits on NEAT1_2/paraspeckles in HeLa cells. Cells were treated with compounds at the indicated concentration for 24 h and analysed using ParaQuant. N = 4, **P< 0.01, ****P< 0.0001 (one-way ANOVA with Dunnett's post-hoc test). Nuclei count as a measure of toxicity is also shown.
Figure 7.
Figure 7.
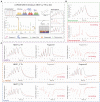
Validation of ParaQuant as a primary screening assay (HeLa cells) and identification of kinase inhibitors – negative paraspeckle modulators. (A) Plate layout and examples of heatmaps for a Cayman Chemical Kinase Library screening plate. Three assay controls were included, MG132 (6.5 μM for 4 h, paraspeckle enhancer), DMSO (5.0% for 7 h, paraspeckle inhibitor) and compound 5 (5 μM for 24 h, no effect on paraspeckles). Unused wells are indicated with asterisks. White wells were treated with the library compounds. Location of controls on the heatmaps is indicated with a bar of respective colour. Results for the library plate 2 in HeLa cells are shown. (B) Correlation plot for the paraspeckle readouts (area and number) combined, vs. nuclei count for the Cayman Chemical Kinase Library screen. Nuclei count per 10 fields of view was plotted. (C) Correlation plots for paraspeckle readouts (area and number) vs. nuclei number for the kinase library hits taken into retest as compared to assay controls (‘zoom-in’ from B). (D) Retest results for the kinase inhibitor library hits. Compounds were tested with the original assay conditions (5 μM for 24 h). N = 3–4; *P< 0.05, **P< 0.01, ***P< 0.001, ****P< 0.0001 (one-way ANOVA with Dunnett's post-hoc test). (E) Negative modulators of paraspeckles identified in HeLa cells are also active in SH-SY5Y cells. Compound data from the original kinase inhibitor library screen (Supplementary Table S3) were plotted. Nuclei count per 10 fields of view was plotted. (F) Negative modulators of paraspeckles identified in HeLa cells are able to prevent or attenuate MG132 induced paraspeckle accumulation in SH-SY5Y cells. Kinase inhibitor library hits were tested in duplicates. Cells were treated with the inhibitor (5 μM) for 20 h and subsequently subjected to MG132 (6.5 μM) for an additional 4 h, in the presence of the compound. Compounds were tested in duplicates; *P< 0.05, ****P< 0.0001 (one-way ANOVA with Dunnett's post-hoc test, as compared to MG132).
Figure 8.
Figure 8.
Characterisation of negative modulators of NEAT1_2/paraspeckles. (A) Negative modulators of paraspeckles identified in the kinase inhibitor screen act within the PI3K/mTOR signalling pathway. Hits from the screen in HeLa cells are shown in red and additional dual PI3K/mTOR inhibitors tested are given in black. (B) PI3K/mTOR/DNA-PK inhibitors but not a specific DNA-PK inhibitor downregulate NEAT1_2/paraspeckles in HeLa cells. Compounds were tested in duplicates at the indicated concentration using the ParaQuant setup. Cells were treated with the inhibitor for 24 h. ***P< 0.001, ****P< 0.0001 (one-way ANOVA with Dunnett's post-hoc test). (C) PIK-75 abolishes MG132 induced paraspeckle accumulation in SH-SY5Y cells. Cells were treated with PIK-75 for 20 h or 4 h at the indicated concentration and subsequently subjected to MG132 (6.5 μM) for an additional 4 h. ****P< 0.0001 (one-way ANOVA with Dunnett's post-hoc test, as compared to MG132). (D) PIK-75 downregulates total NEAT1 and NEAT1_2 but has limited effect on MALAT1 lncRNA as measured by qRT-PCR. SH-SY5Y cells were treated with 250 nM PIK-75 for 24 h. N = 4 or 6. *P< 0.05, **P< 0.01, ****P< 0.0001. (E) PIK-75 downregulates NEAT1_1 as measured by qRT-PCR. NEAT1_2 knockout SH-SY5Y cells (see Supplementary Figure S11) were treated with 250 nM PIK-75 for 8 or 24 h. N = 4. *P< 0.05, ***P< 0.001. (F) PIK-75 has limited effect on MALAT1/speckles. HeLa cells were treated with 25 nM PIK-75 for 24 h, and MALAT1 was detected by RNA-FISH and quantified using Spot analysis on Harmony software (N = 4). Representative images are also shown. Scale bar, 20 μm. (G) PIK-75 causes redistribution of essential paraspeckle proteins to the perinucleolar regions (SFPQ and NONO) or speckle-like territories (FUS). SH-SY5Y cells were treated with 250 nM PIK-75 for 24 h. Scale bar, 10 μm. (H) PIK-75 does not affect the levels of core paraspeckle proteins as determined by western blot. SH-SY5Y cells were treated with 250 nM PIK-75 for 24 h. (I) PIK-75 effect on NEAT1_2/paraspeckles is reversible. HeLa and SH-SY5Y cells were treated with PIK-75 at 25 or 250 nM respectively, for 24 h, followed by recovery in compound-free media for 16 h. N = 3–4, *P< 0.05, ***P< 0.001 (one-way ANOVA with Dunnett's post-hoc test).
Figure 9.
Figure 9.
Multiplexing and analysis of additional cellular phenotypes with ParaQuant assay: stress granules. (A) Simultaneous detection of paraspeckles and stress granules (SGs) in U2OS cells. Representative images of paraspeckles and SGs in cells subjected to NaAsO2 and analysed at the early and late time-points during stress (1 h stress and 3 h recovery in stressor-free media, respectively). Paraspeckle visualisation was performed as described for ParaQuant assay and SGs were visualized with CoraLite®488-conjugated anti-G3BP1 antibody. Nuclei with prominent paraspeckles are indicated with asterisks. Scale bar, 10 μm. (B) Timeline for the kinase inhibitor experiment. Stars indicate time-points for SG and NEAT1_2/paraspeckle analysis. (C) Representative segmentation mask for SGs used for automated quantification of SG area. Raw image is a merged G3BP1 and DAPI image. (D) Representative images of SG assembly in U2OS cells pre-treated with the indicated kinase inhibitors. Cells were pre-treated with the inhibitor for 2 h (5 μM) and subjected to NaAsO2 for 1 h. Scale bar, 20 μm. (EF) SG area (E) and NEAT1_2/paraspeckle area (F) analysed at the early (1 h NaAsO2) and late (3 h recovery) time-points, respectively. **P< 0.01, ****P< 0.0001 (one-way ANOVA with Dunnett's post-hoc test).

References

    1. Carninci P., Kasukawa T., Katayama S., Gough J., Frith M.C., Maeda N., Oyama R., Ravasi T., Lenhard B., Wells C.et al. .. The transcriptional landscape of the mammalian genome. Science. 2005; 309:1559–1563. - PubMed
    1. Derrien T., Johnson R., Bussotti G., Tanzer A., Djebali S., Tilgner H., Guernec G., Martin D., Merkel A., Knowles D.G.et al. .. The GENCODE v7 catalog of human long noncoding RNAs: analysis of their gene structure, evolution, and expression. Genome Res. 2012; 22:1775–1789. - PMC - PubMed
    1. Statello L., Guo C.J., Chen L.L., Huarte M.. Gene regulation by long non-coding RNAs and its biological functions. Nat. Rev. Mol. Cell Biol. 2021; 22:96–118. - PMC - PubMed
    1. Fox A.H., Nakagawa S., Hirose T., Bond C.S.. Paraspeckles: where long noncoding RNA meets phase separation. Trends Biochem. Sci. 2018; 43:124–135. - PubMed
    1. Imamura K., Imamachi N., Akizuki G., Kumakura M., Kawaguchi A., Nagata K., Kato A., Kawaguchi Y., Sato H., Yoneda M.et al. .. Long noncoding RNA NEAT1-dependent SFPQ relocation from promoter region to paraspeckle mediates IL8 expression upon immune stimuli. Mol. Cell. 2014; 53:393–406. - PubMed

Publication types

Substances