

A comprehensive review of COVID-19 detection techniques: From laboratory systems to wearable devices
- PMID: 36099862
- PMCID: PMC9433350
- DOI: 10.1016/j.compbiomed.2022.106070
A comprehensive review of COVID-19 detection techniques: From laboratory systems to wearable devices
Abstract
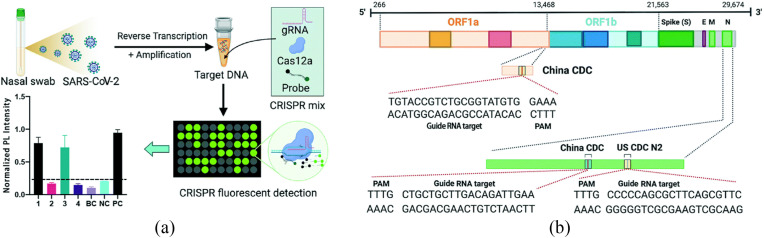
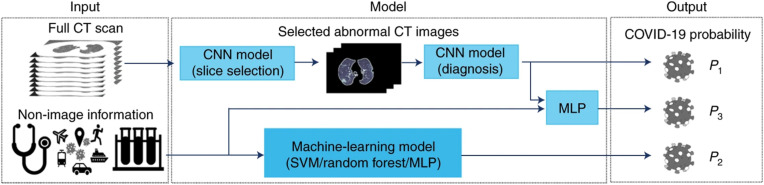
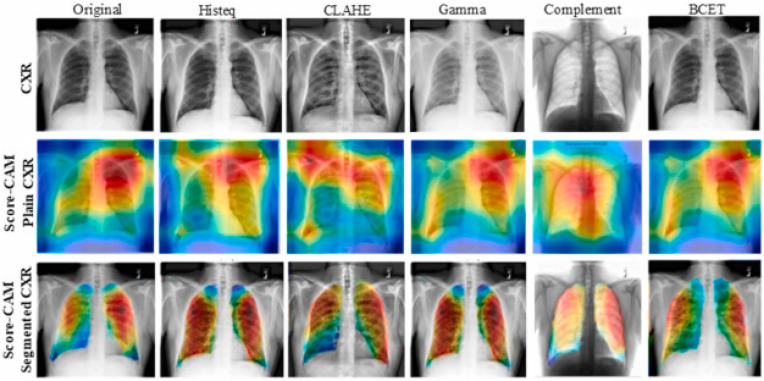
Screening of severe acute respiratory syndrome coronavirus 2 (SARS-CoV-2) among symptomatic and asymptomatic patients offers unique opportunities for curtailing the transmission of novel coronavirus disease 2019, commonly known as COVID-19. Molecular diagnostic techniques, namely reverse transcription loop-mediated isothermal amplification (RT-LAMP), reverse transcription-polymerase chain reaction (RT-PCR), and immunoassays, have been frequently used to identify COVID-19 infection. Although these techniques are robust and accurate, mass testing of potentially infected individuals has shown difficulty due to the resources, manpower, and costs it entails. Moreover, as these techniques are typically used to test symptomatic patients, healthcare systems have failed to screen asymptomatic patients, whereas the spread of COVID-19 by these asymptomatic individuals has turned into a crucial problem. Besides, respiratory infections or cardiovascular conditions generally demonstrate changes in physiological parameters, namely body temperature, blood pressure, and breathing rate, which signifies the onset of diseases. Such vitals monitoring systems have shown promising results employing artificial intelligence (AI). Therefore, the potential use of wearable devices for monitoring asymptomatic COVID-19 individuals has recently been explored. This work summarizes the efforts that have been made in the domains from laboratory-based testing to asymptomatic patient monitoring via wearable systems.
Keywords: Asymptomatic; COVID-19; Machine learning; Screening; Wearable systems.
Copyright © 2022 Elsevier Ltd. All rights reserved.
Conflict of interest statement
The authors declare that they have no known competing financial interests or personal relationships that could have appeared to influence the work reported in this paper.
Figures


References
-
- WHO coronavirus (COVID-19) dashboard. https://covid19.who.int
-
- Sethuraman N., Jeremiah S.S., Ryo A. Interpreting diagnostic tests for SARS-CoV-2. JAMA. 2020;323:2249–2251. - PubMed
-
- Yan C., Cui J., Huang L., Du B., Chen L., Xue G., Li S., Zhang W., Zhao L., Sun Y., Yao H., Li N., Zhao H., Feng Y., Liu S., Zhang Q., Liu D., Yuan J. Rapid and visual detection of 2019 novel coronavirus (SARS-CoV-2) by a reverse transcription loop-mediated isothermal amplification assay. Clin. Microbiol. Infect. 2020;26:773–779. doi: 10.1016/j.cmi.2020.04.001. - DOI - PMC - PubMed
Publication types
MeSH terms
LinkOut - more resources
Full Text Sources
Medical
Miscellaneous
