. 2022 Sep 12;40(9):1027-1043.e9.
doi: 10.1016/j.ccell.2022.08.005.

NKG2A and HLA-E define an alternative immune checkpoint axis in bladder cancer

Affiliations

NKG2A and HLA-E define an alternative immune checkpoint axis in bladder cancer

Bérengère Salomé et al. Cancer Cell. .

Abstract

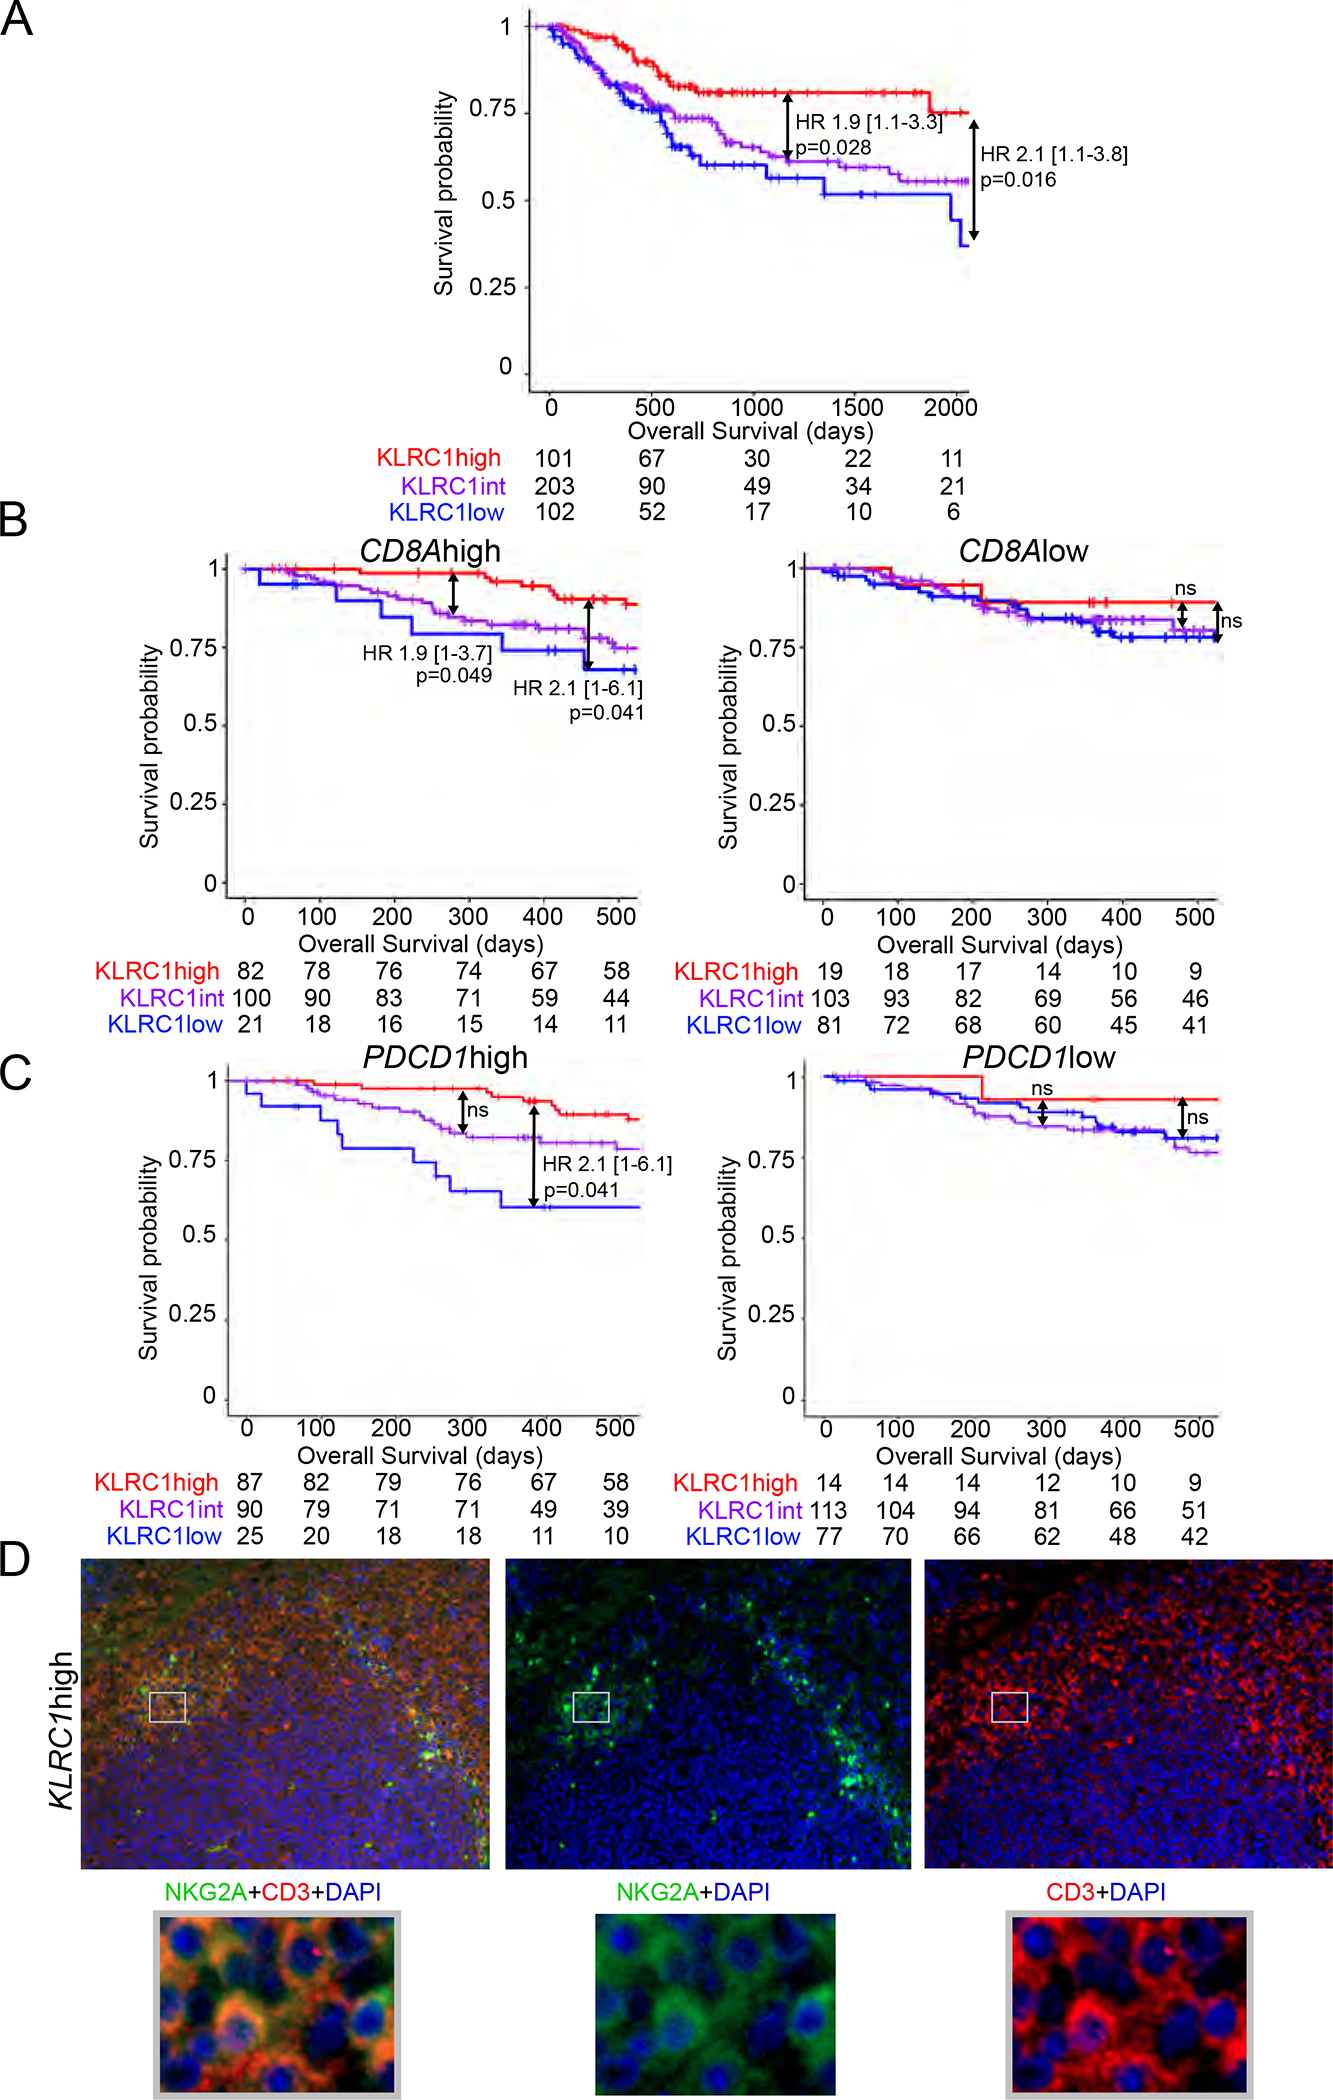
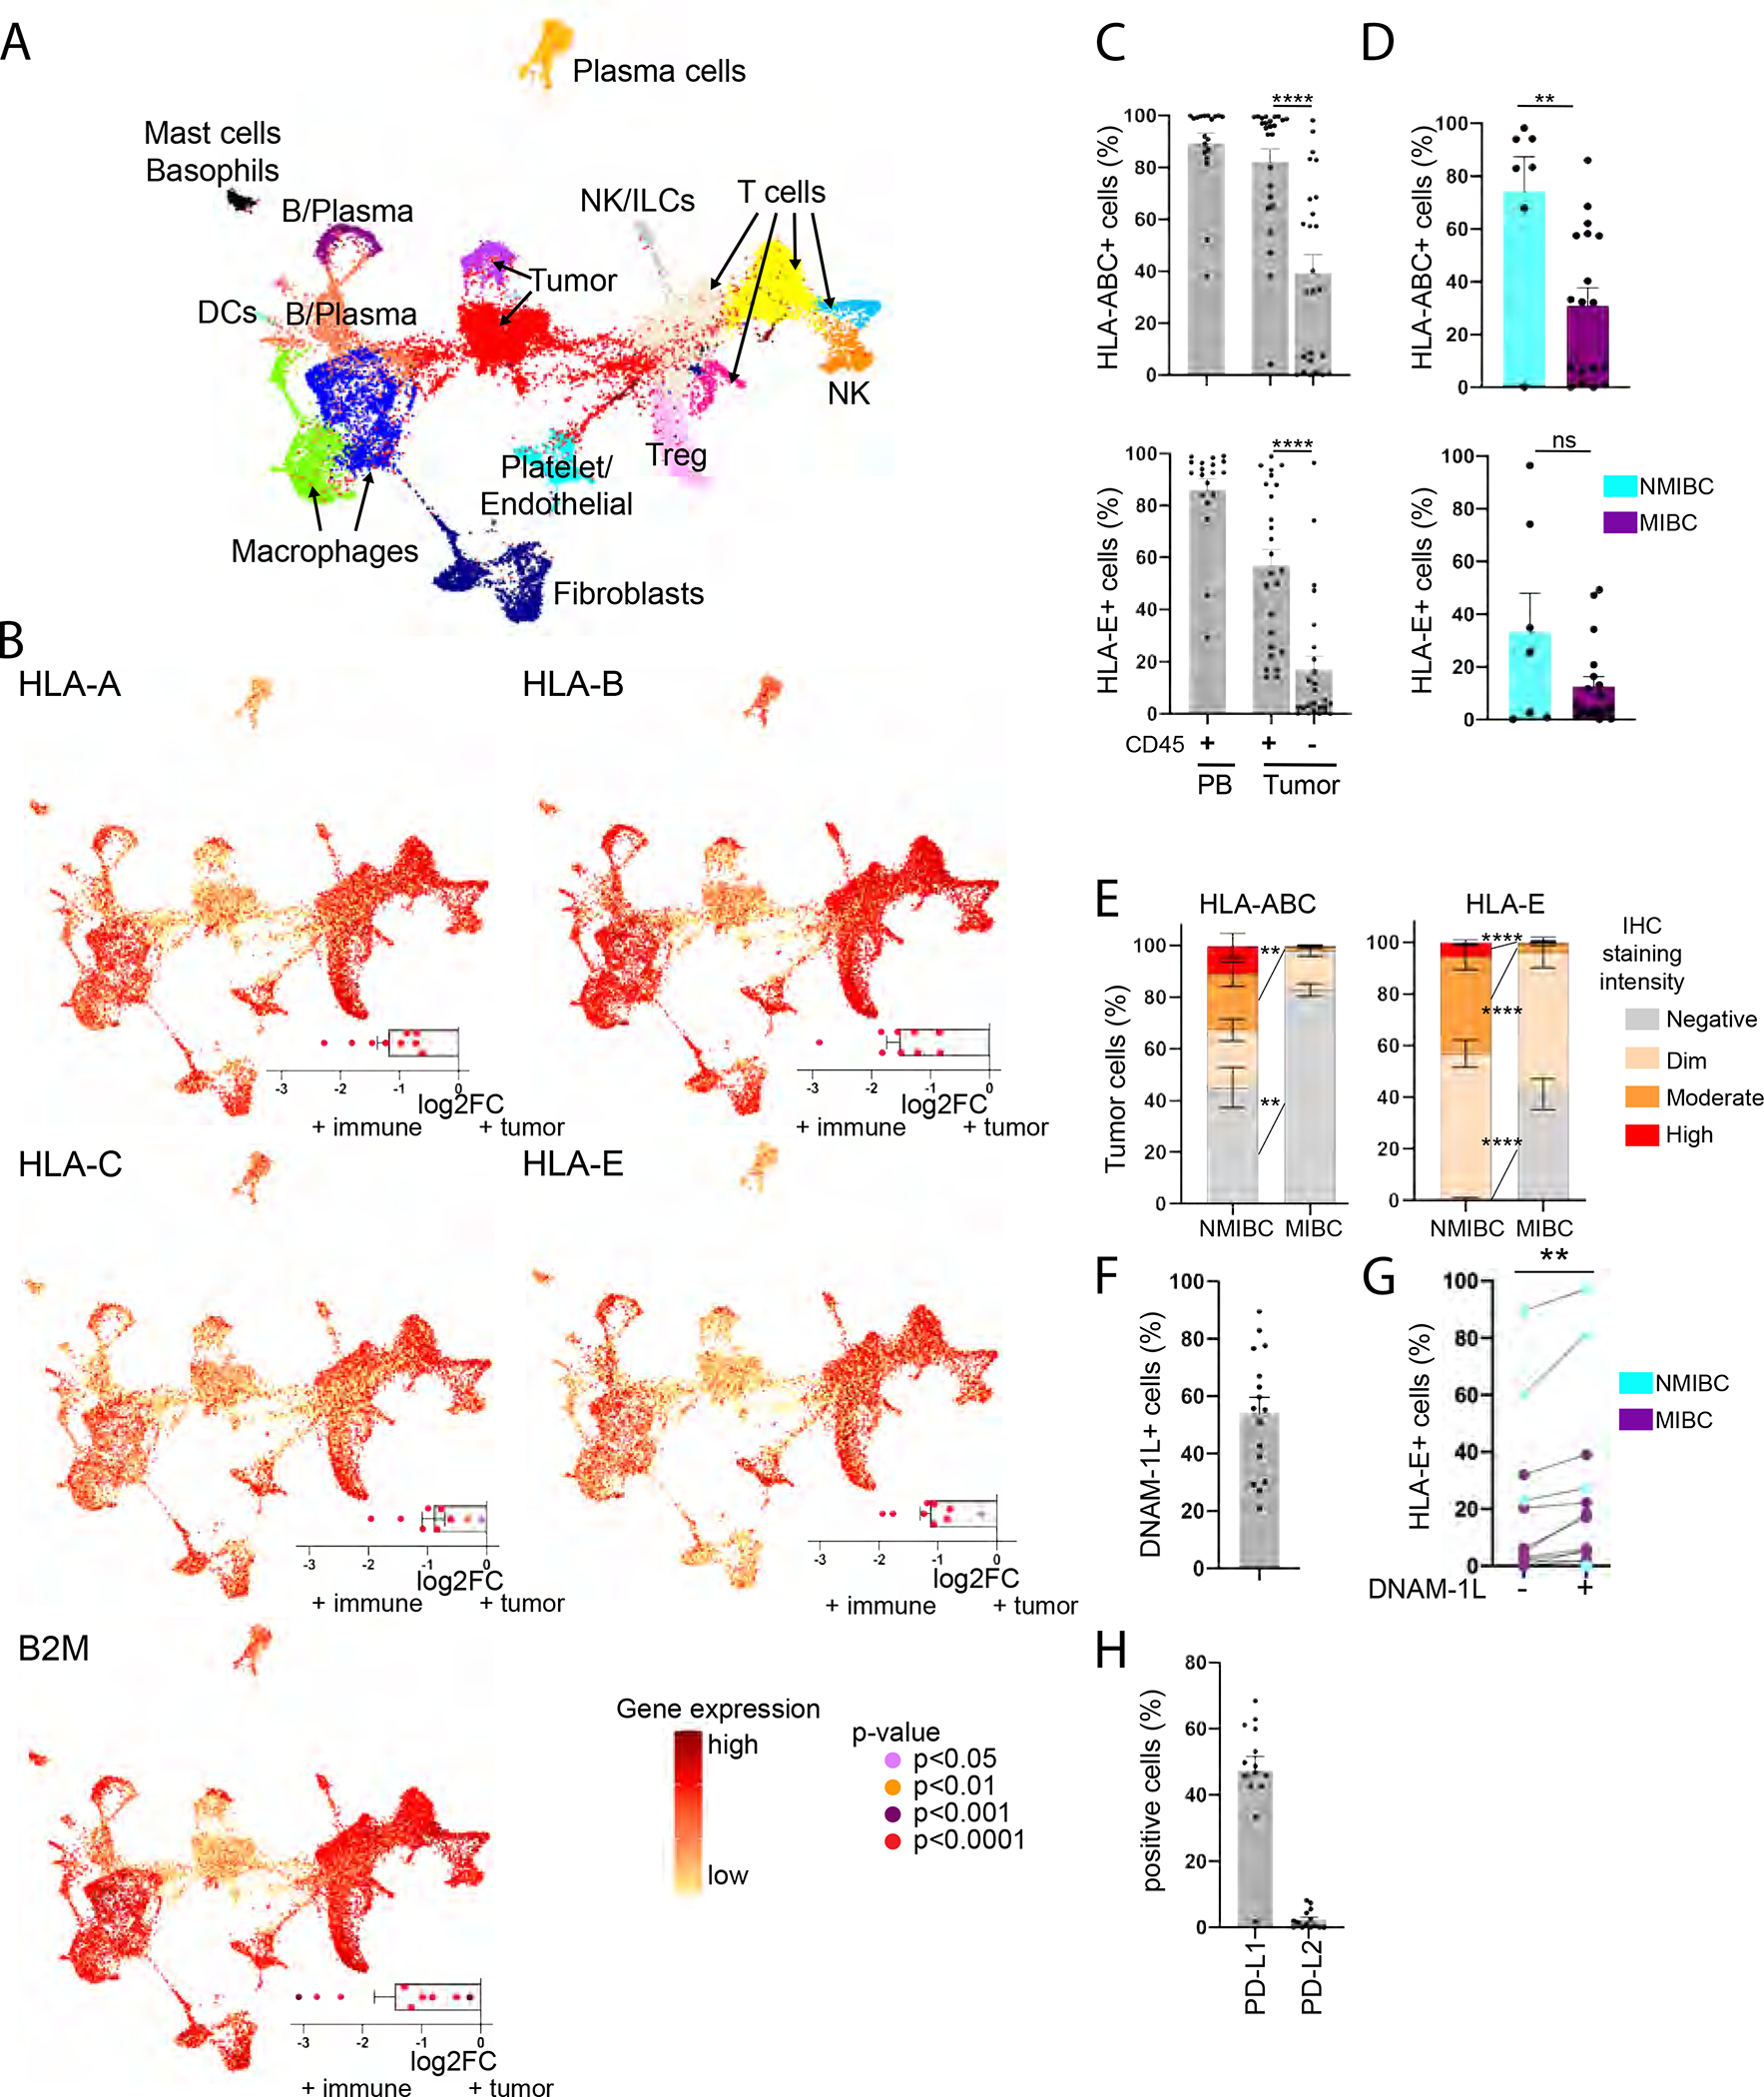
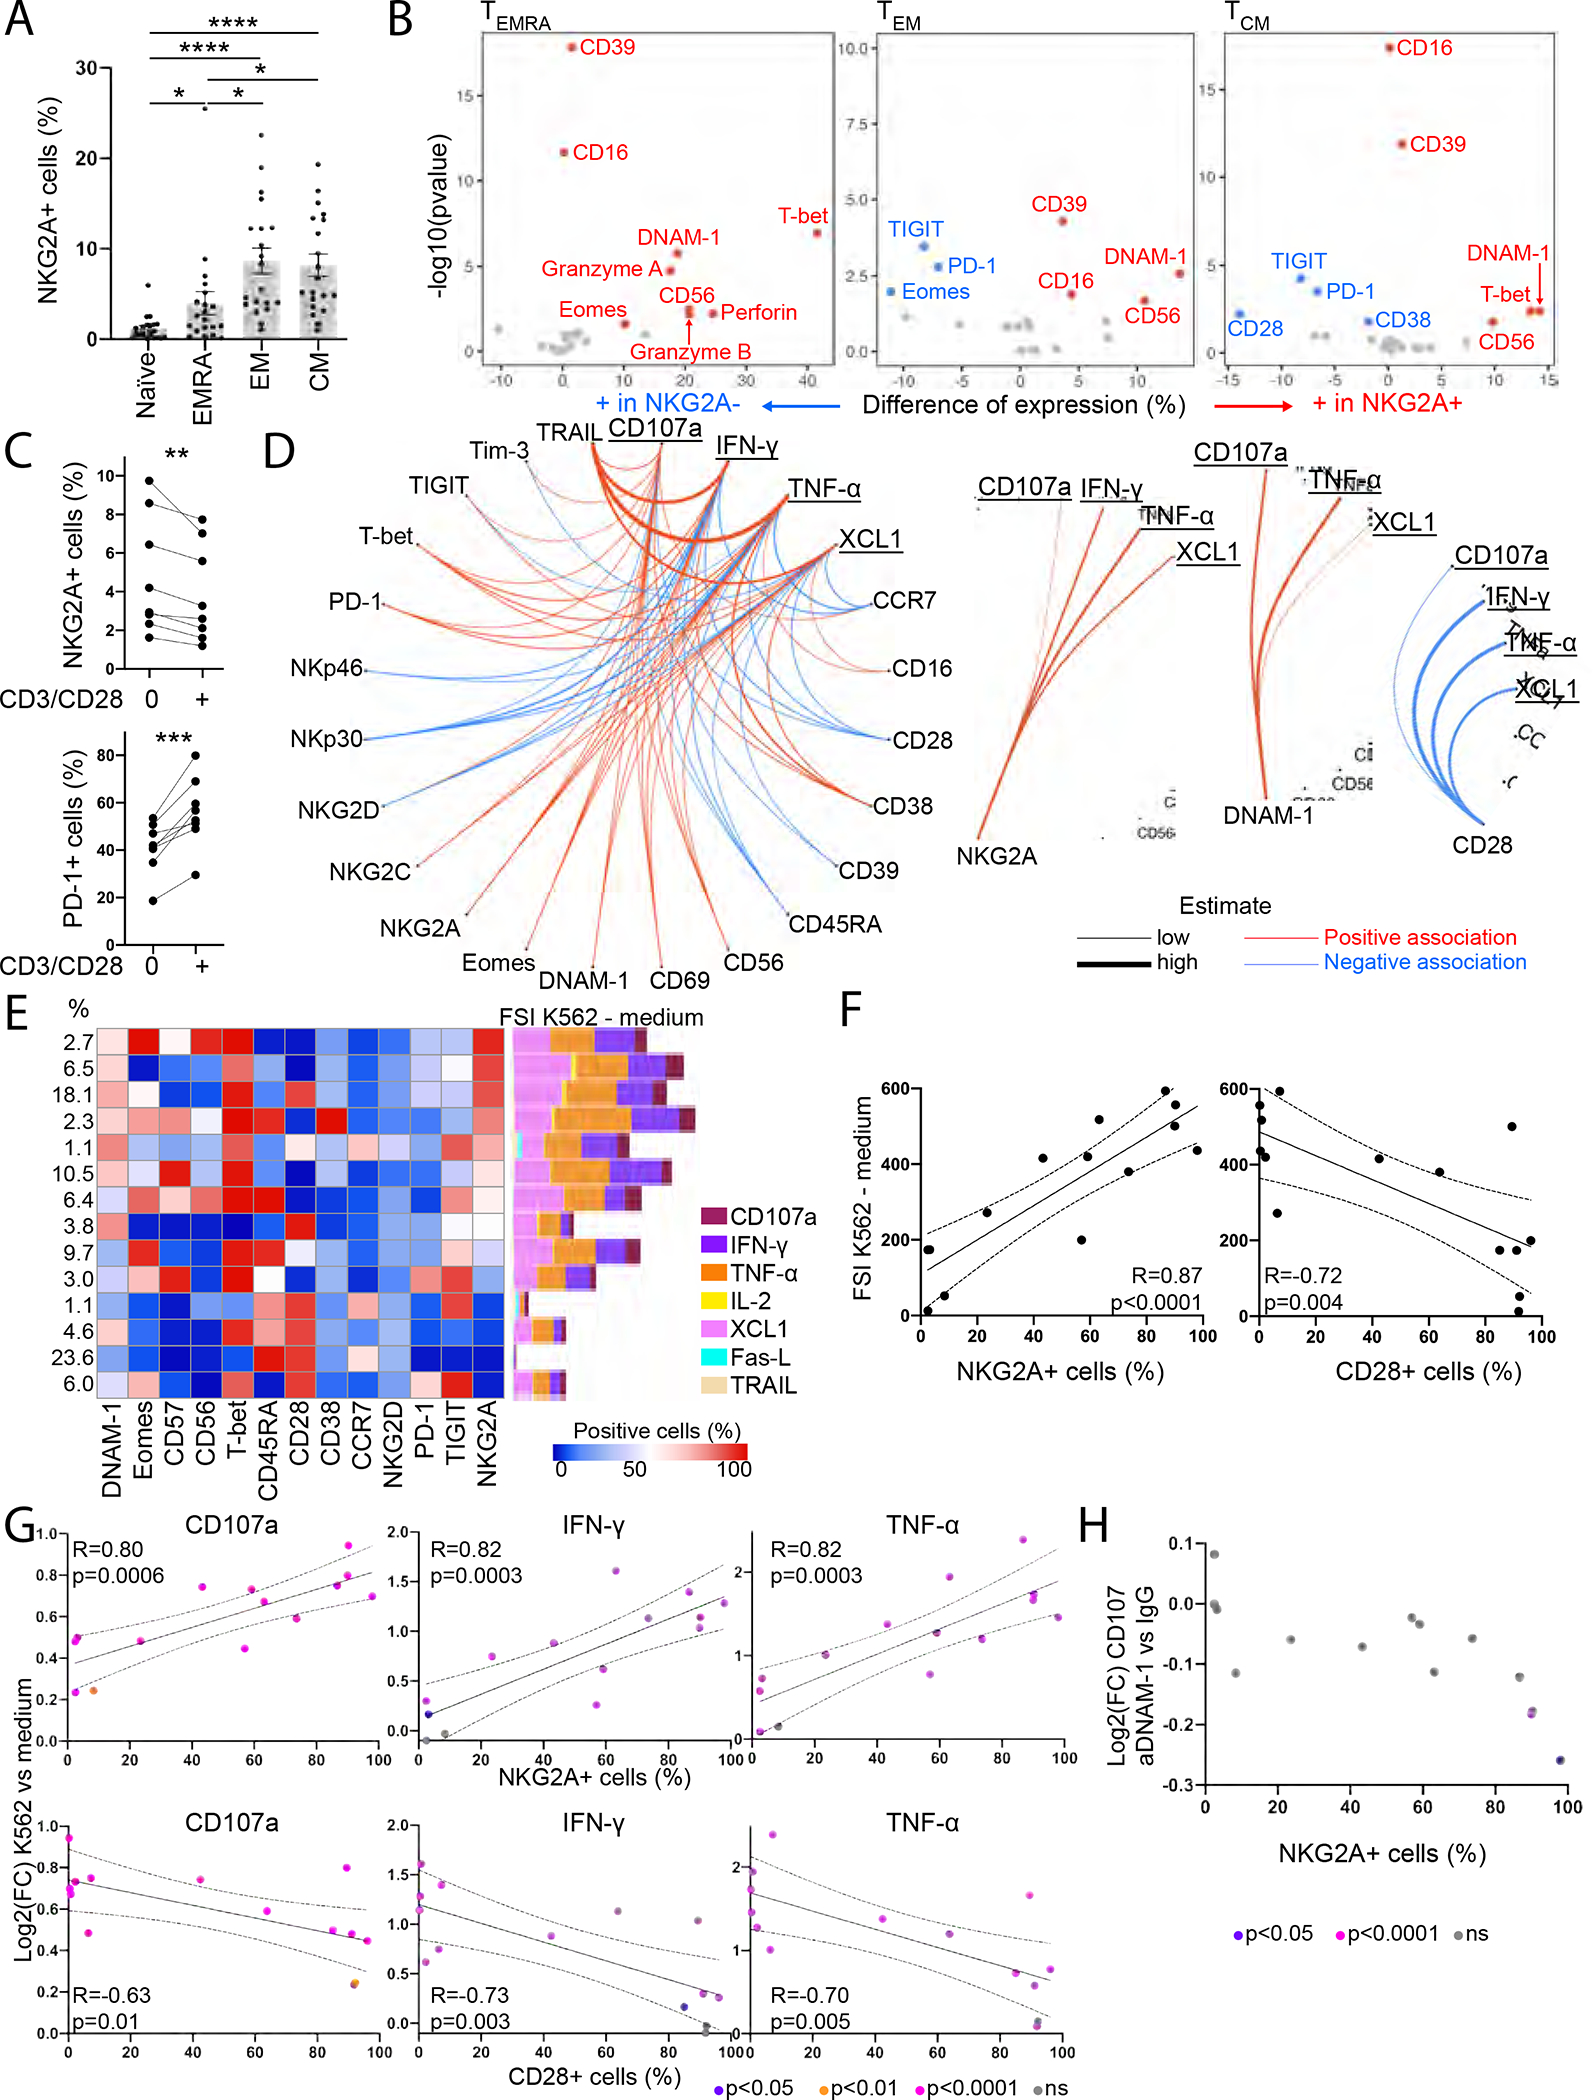
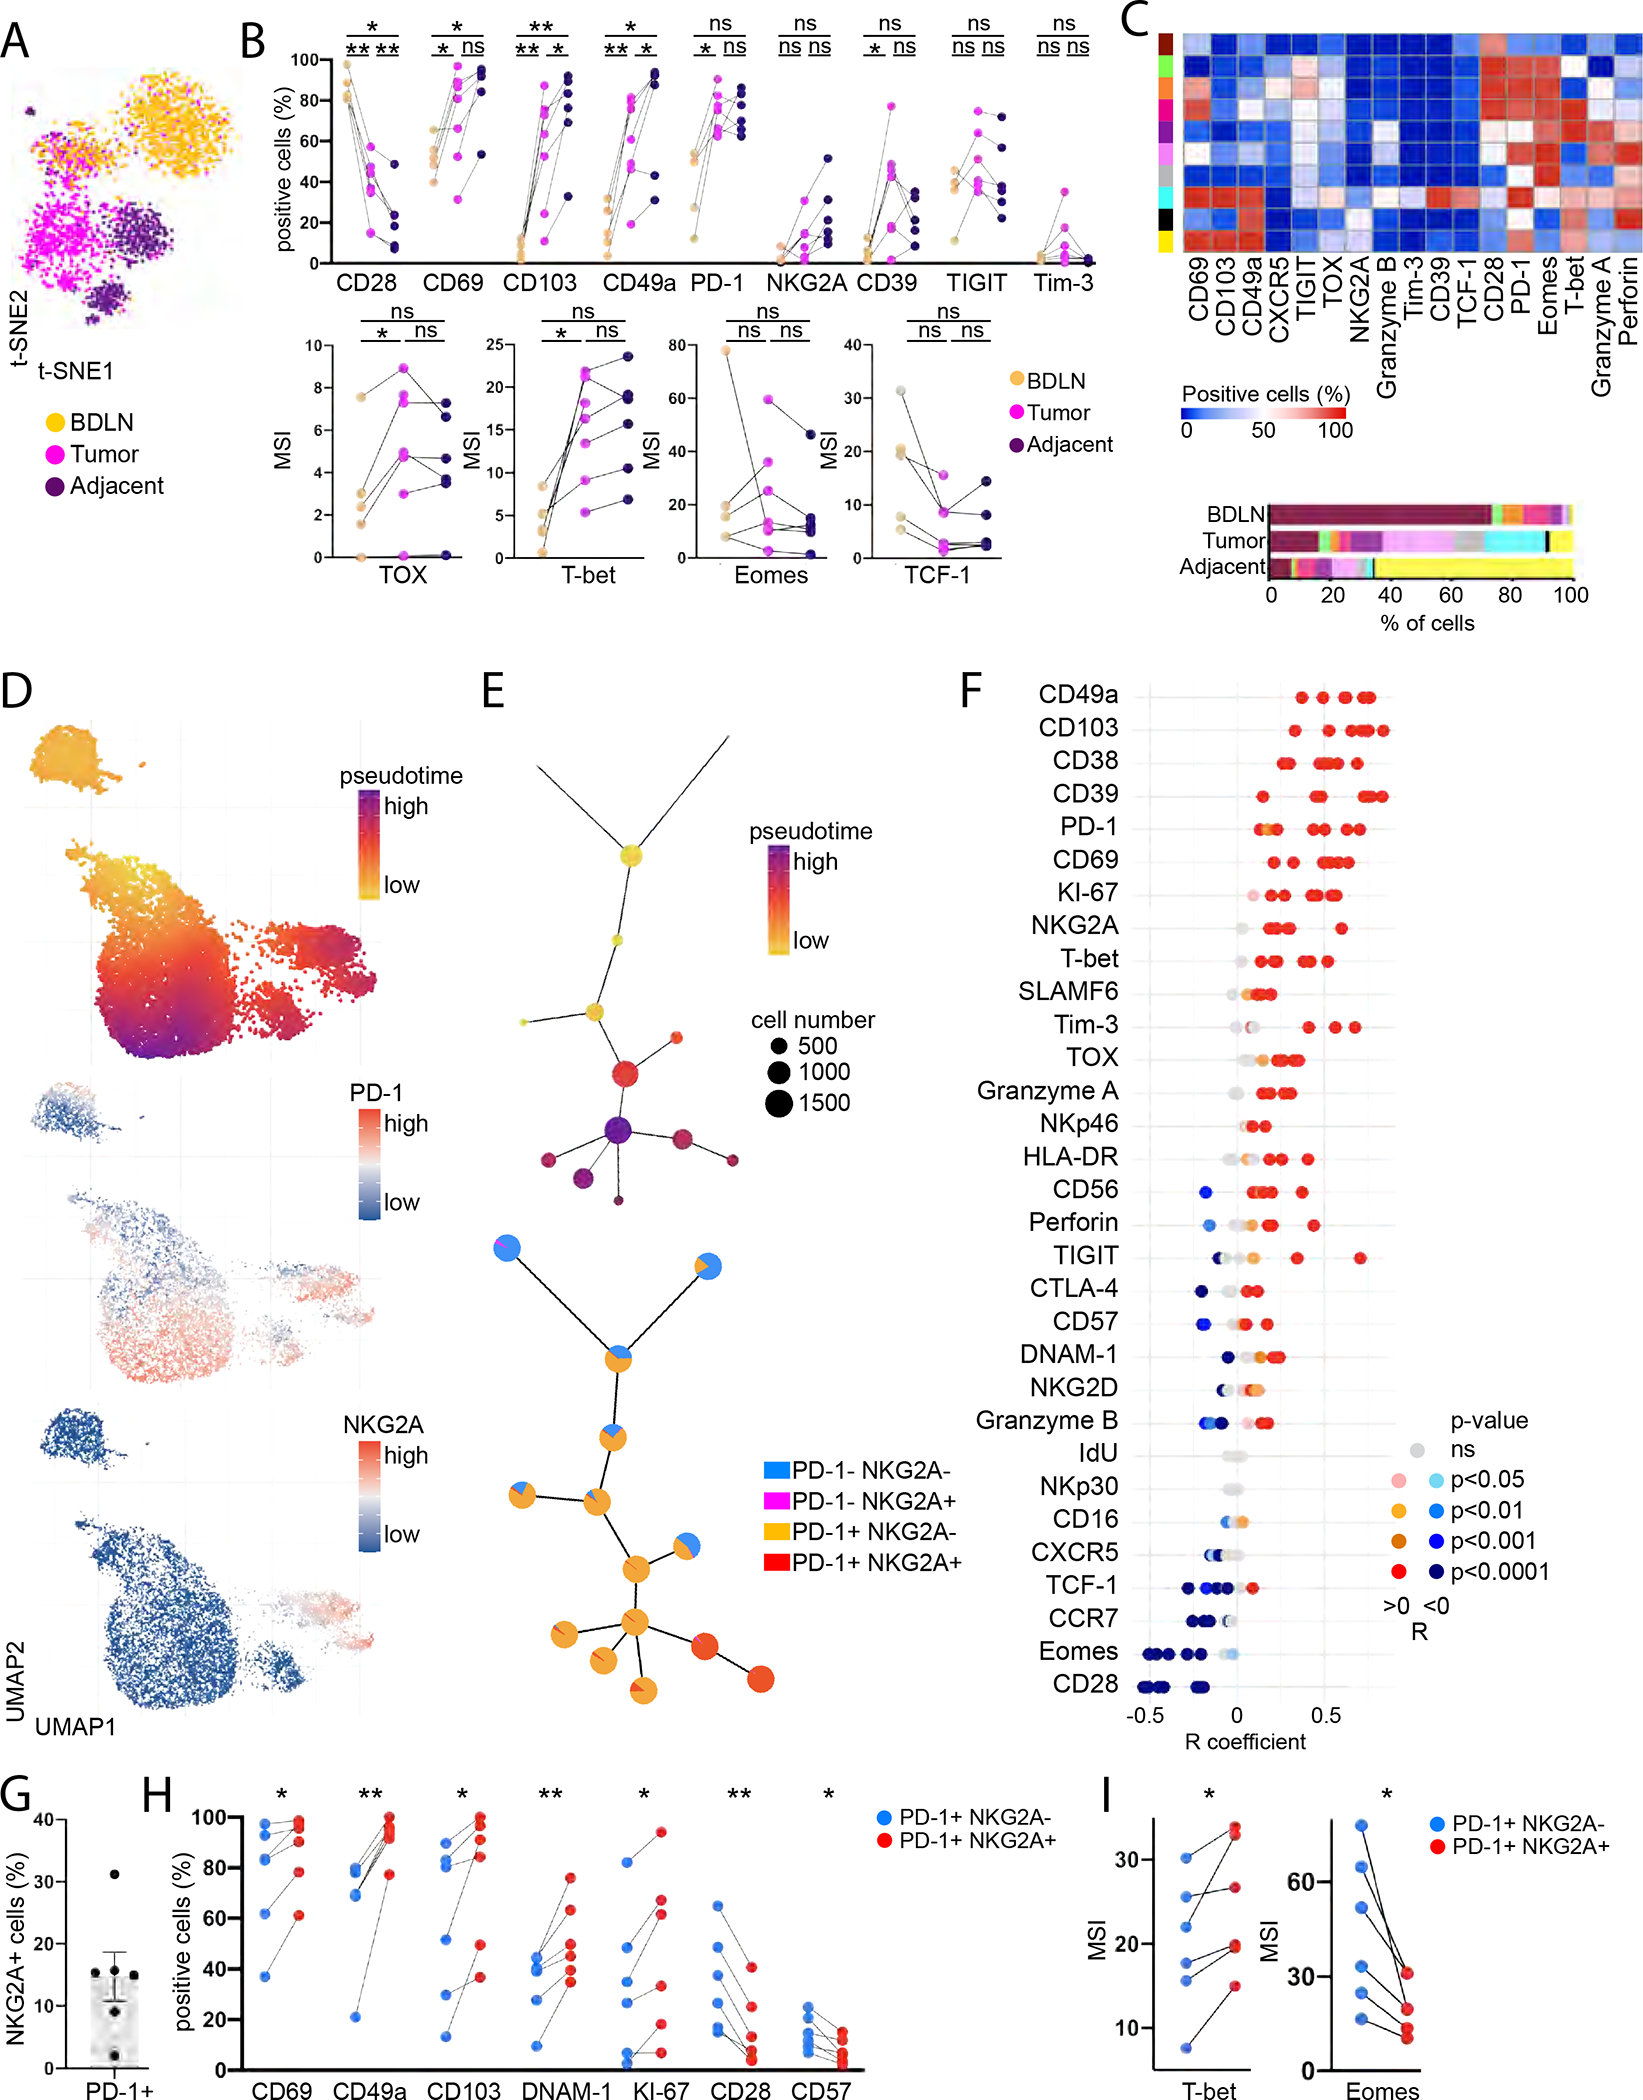
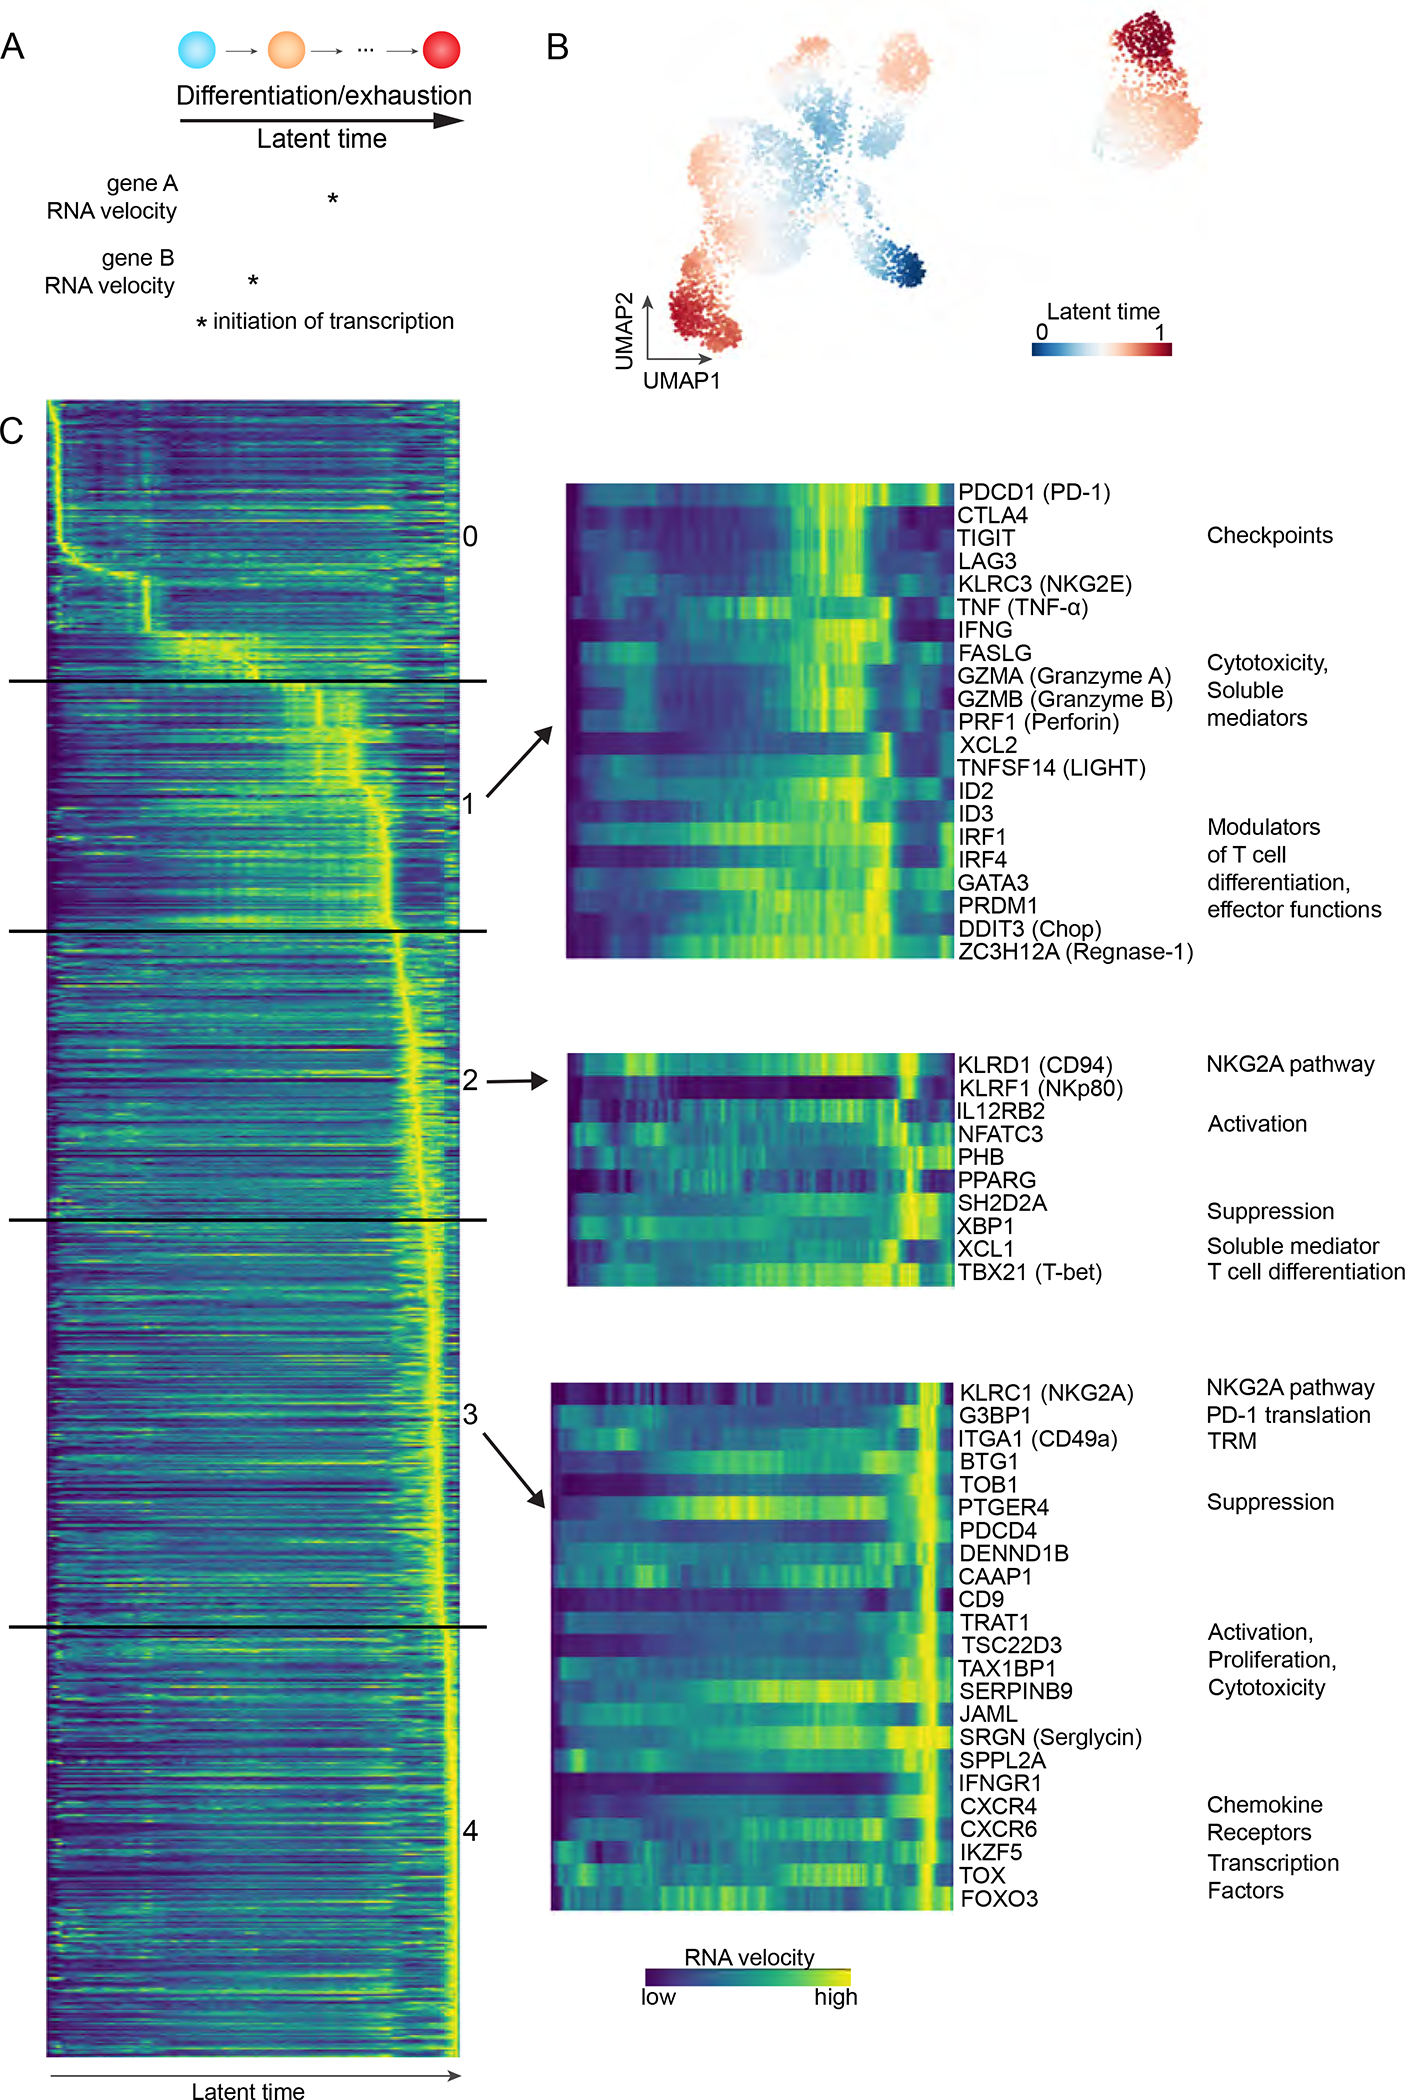
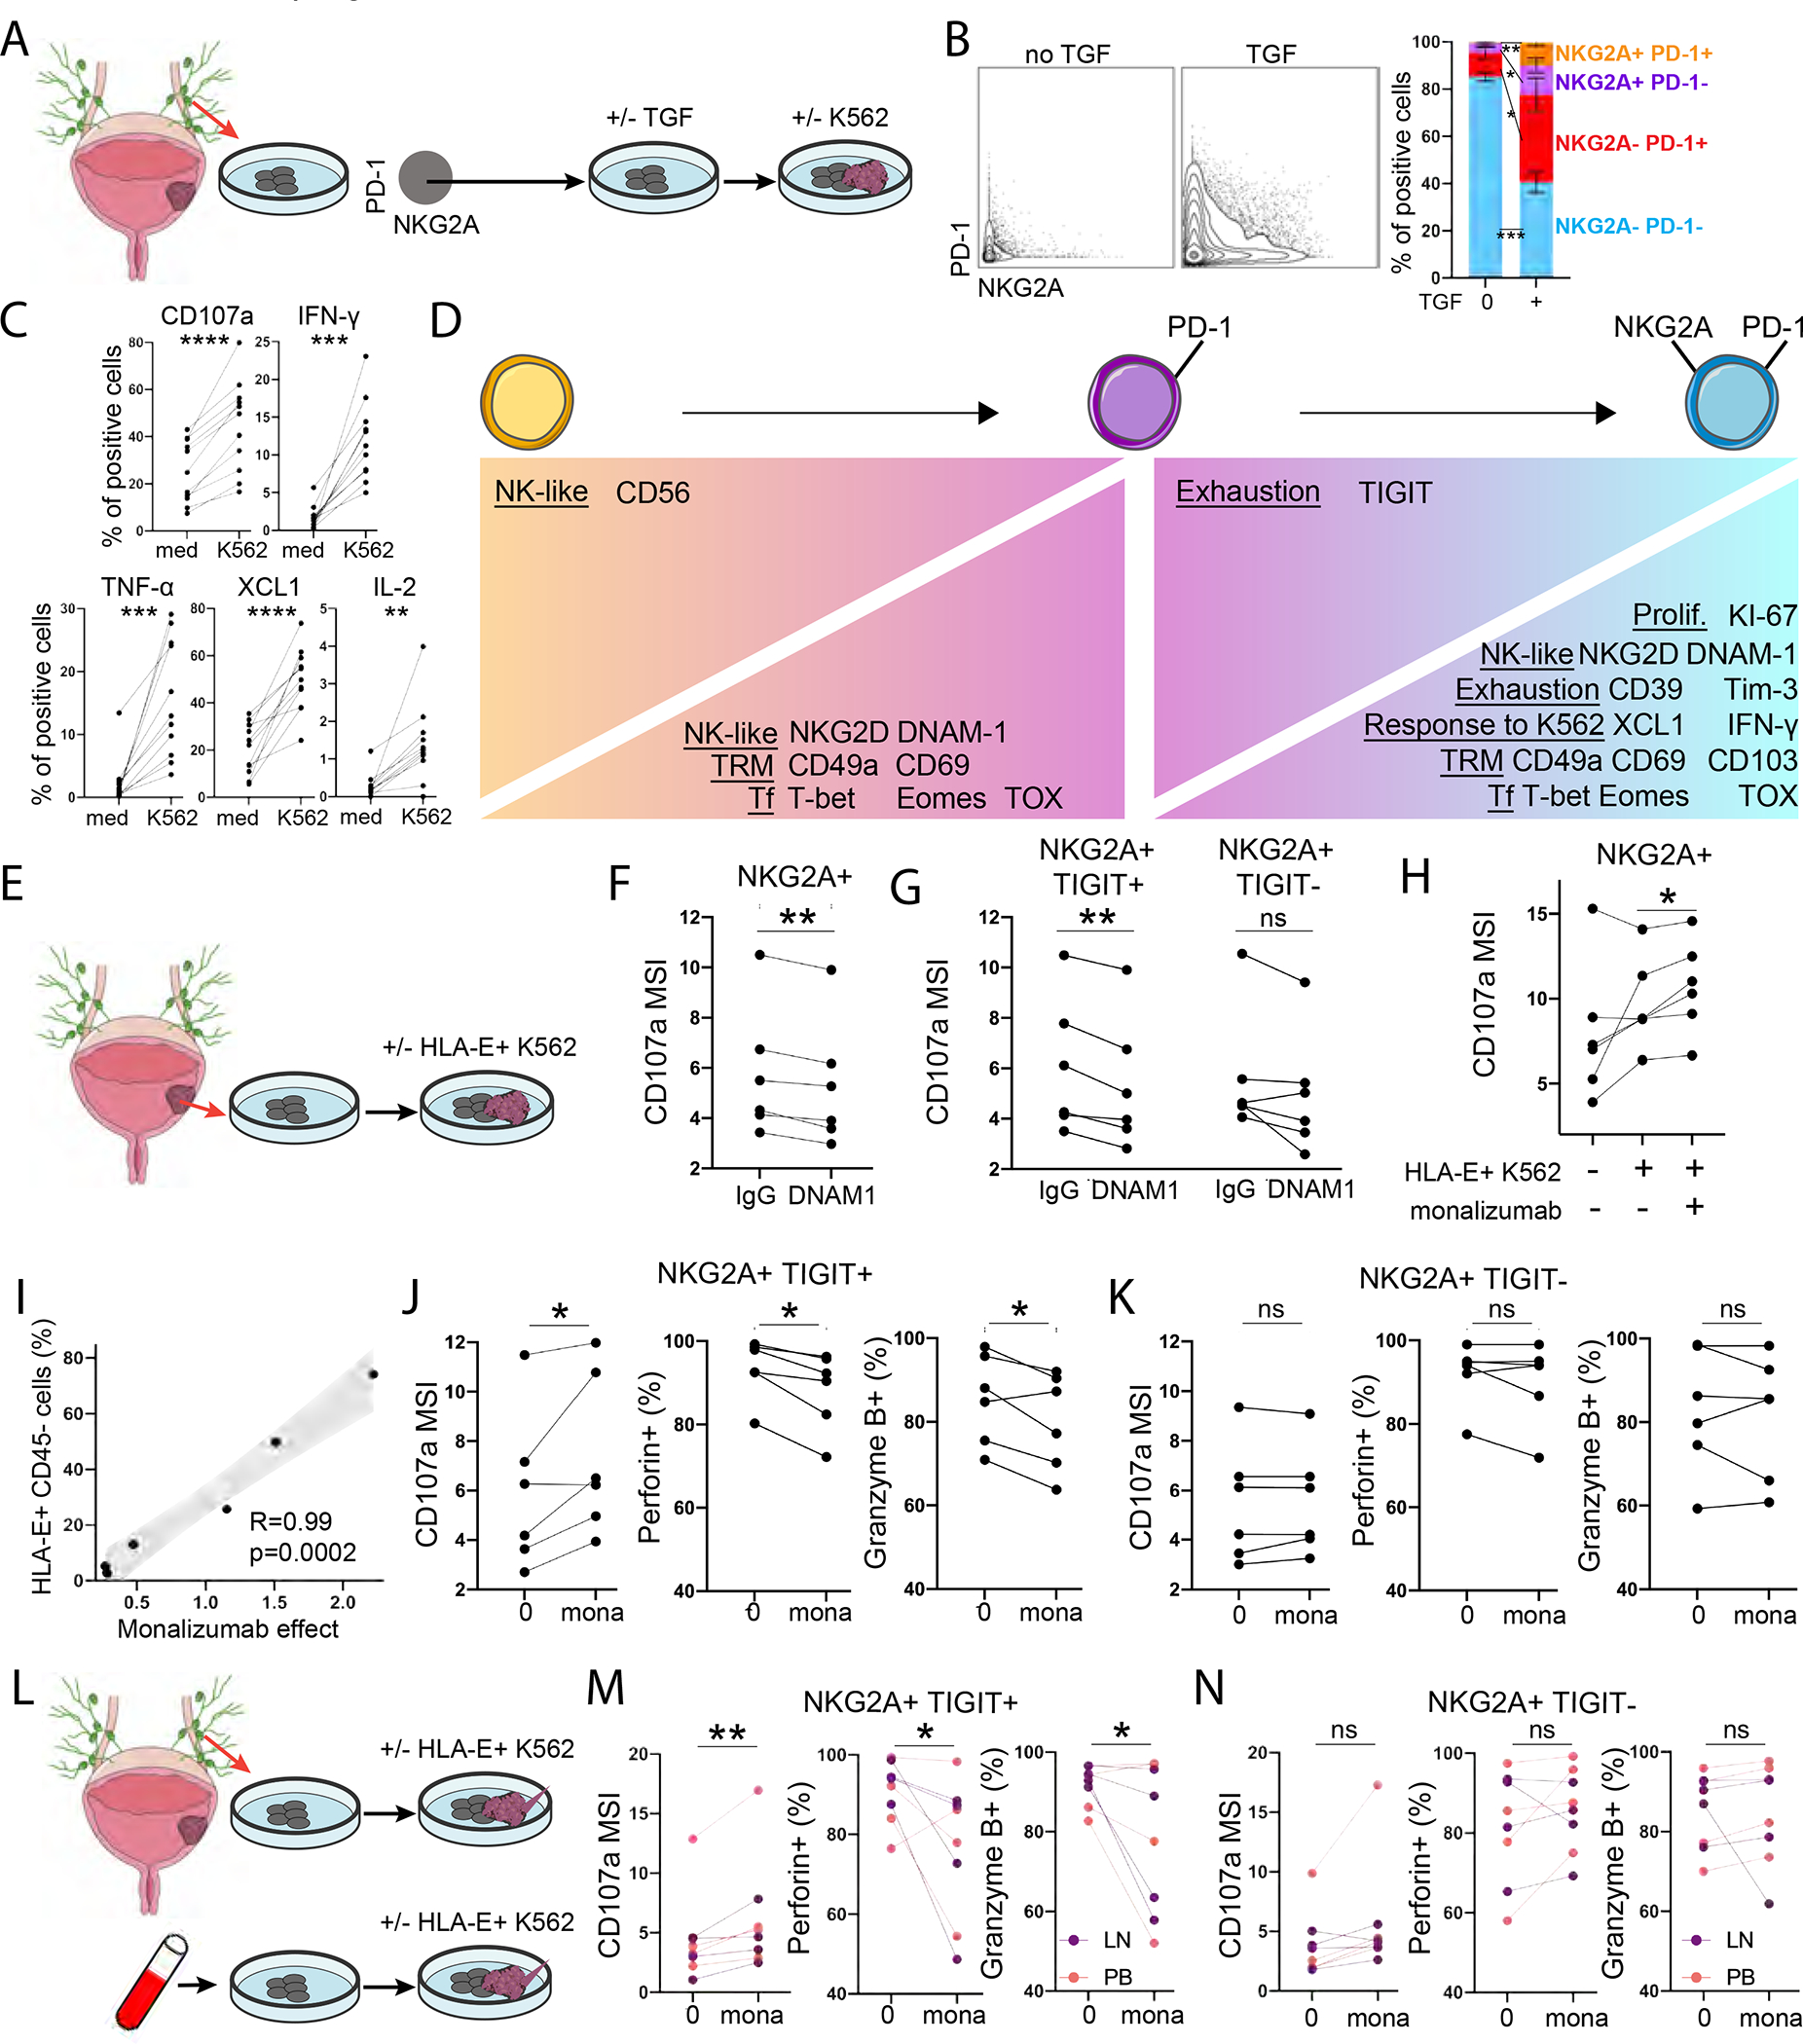
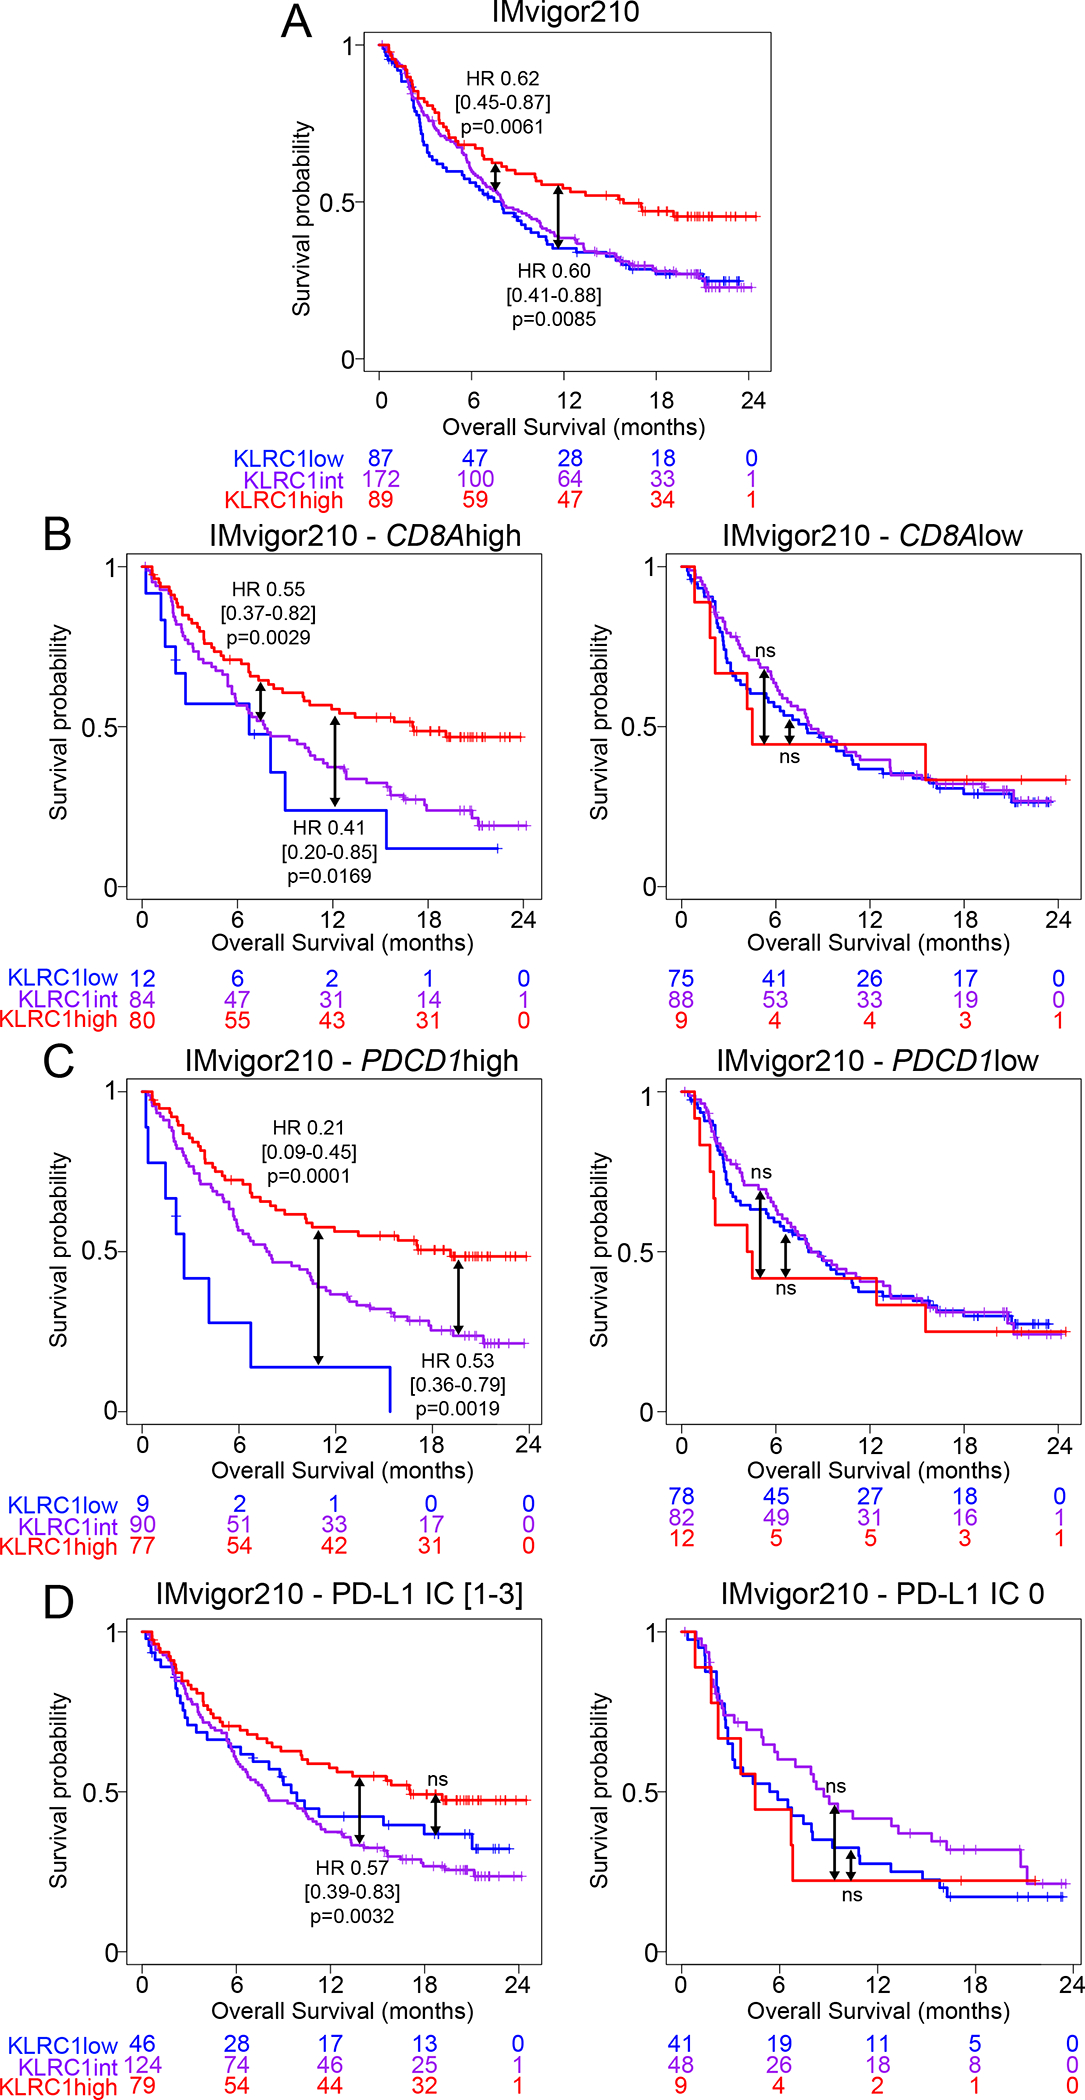
Programmed cell death protein 1 (PD-1)/programmed death-ligand 1 (PD-L1)-blockade immunotherapies have limited efficacy in the treatment of bladder cancer. Here, we show that NKG2A associates with improved survival and responsiveness to PD-L1 blockade immunotherapy in bladder tumors that have high abundance of CD8+ T cells. In bladder tumors, NKG2A is acquired on CD8+ T cells later than PD-1 as well as other well-established immune checkpoints. NKG2A+ PD-1+ CD8+ T cells diverge from classically defined exhausted T cells through their ability to react to human leukocyte antigen (HLA) class I-deficient tumors using T cell receptor (TCR)-independent innate-like mechanisms. HLA-ABC expression by bladder tumors is progressively diminished as disease progresses, framing the importance of targeting TCR-independent anti-tumor functions. Notably, NKG2A+ CD8+ T cells are inhibited when HLA-E is expressed by tumors and partly restored upon NKG2A blockade in an HLA-E-dependent manner. Overall, our study provides a framework for subsequent clinical trials combining NKG2A blockade with other T cell-targeted immunotherapies, where tumors express higher levels of HLA-E.

Keywords: CD8 T cells; HLA class I; NK cells; NKG2A; bladder cancer; checkpoint blockade immunotherapy; immune exhaustion; solid tumors; tumor microenvironment.


Conflict of interest statement

Declaration of interests L.W., R.P.S., and J.Z. are employees of Sema4. A.H. receives research funds from Zumutor Biologics and is on the advisory boards of HTG Molecular Diagnostics, Immunorizon, UroGen, and Takeda. N.B. is an extramural member of the Parker Institute for Cancer Immunotherapy; receives research funds from Regeneron, Harbor Biomedical, DC Prime, and Dragonfly Therapeutics; and is on the advisory boards of Neon Therapeutics, Novartis, Avidea, Boehringer Ingelheim, Rome Therapeutics, Rubius Therapeutics, Roswell Park Comprehensive Cancer Center, BreakBio, Carisma Therapeutics, CureVac, Genotwin, BioNTech, Gilead Therapeutics, Tempest Therapeutics, and the Cancer Research Institute. A patent related to this work was filed to the United States Patent and Trademark Office (63/313,823).

Figures

Figure 1.
Figure 1.. Improved overall survival in NKG2A+ (KLRC1high) CD8 T cell-infiltrated bladder tumors
Kaplan-meier survival curves of the TCGA BLCA cohort showing associations between KLRC1 (NKG2A) expression and overall survival in (A) all patients, or patients with (B) CD8Ahigh/low (CD8) or (C) PDCD1high/low (PD-1) gene expression. Hazard ratios and p-values were calculated using COX proportional hazards regression models that were corrected for age and number of somatic mutations. (D) Representative immunofluorescence staining of CD3/NKG2A in KLRC1high bladder tumors. See also Figure S1.
Figure 2.
Figure 2.. Bladder tumors have reduced expression of HLA class I but retain expression of ligands for DNAM-1.
(A-B) Single-cell RNA sequencing data was generated from bladder tumors (n=8). (A) UMAP clustering analysis. Each color represents a cluster. (B) Central graph: gene expression level on the UMAP clusters; Bottom right graph: differential gene expression between tumor and immune cells. (C-D, F-H) Flow cytometry was performed on PBMCs and tumor-dissociated cells of BC patients. (C) Frequency of cells expressing HLA-ABC or HLA-E among CD45+ PBMCs (n=19) and CD45+/− cells from the tumor site (n=25). (D) Frequency of CD45 tumor cells expressing HLA-ABC or HLA-E in NMIBC (n=7) and MIBC (n=18). (E) Frequency of tumor cells staining negative or at varying signal intensities for HLA-ABC and -E in NMIBC/MIBC by immunohistochemistry. (F) Frequency of CD45 tumor cells expressing at least one DNAM-1-L (CD112/CD155) (n=16). (G) Frequency of CD112/CD155+/− CD45 tumor cells expressing HLA-E (n=13). (H) Frequency of CD45 tumor cells expressing PD-L1 or PD-L2 (n=14). Paired t-tests were used in (C), (G) and unpaired t-test in (D)-(E). ** p<0.01, **** p<0.0001. (C)-(F), (H): Error bars represent the SEM (standard error of the mean). See also Figure S2, Table S1.
Figure 3.
Figure 3.. NKG2A-expressing CD8 T cells are differentiated and possess TCR-independent Innate-like functions in healthy individuals.
(A-B) Mass cytometry was performed ex vivo on HD PBMCs (n=20). (A) NKG2A expression on CD8T cells. (B) Differentially expressed markers between NKG2A+ and NKG2A CD8 T cells. (C) NKG2A and PD-1 expression on CD45RA CD8 T cells after 24h culture of CD8 T cells from HD PBMCs with low-dose IL-2/IL-7/IL-15, with or without CD3/CD28 beads. (D) CD8 T cells from HD PBMCs were recovered overnight with low-dose IL-12/IL-15/IL-18 prior to a 5h co-culture with K562 (n=20). Associations between expression of phenotypic and functional markers following co-culture with K562 tumors that are statistically significant. (E-H) CD8 T cells from HD PBMCs were recovered overnight with low-dose IL-12/IL-15/IL-18 prior to a 5h co-culture with K562 in the presence or absence of anti-DNAM-1 blocking antibody (n=10). (E) FlowSOM cluster analysis of CD8 T cells. Each row represents a cluster, each column a marker. Left: Distribution of CD8 T cells among clusters. Right: FSI upon K562 stimulation minus the FSI upon 5h culture in R10 medium. (F) Correlation between NKG2A+ or CD28+ CD8 T cell frequency within each cluster and FSI upon K562 stimulation minus FSI in the absence of K562. (G) Correlation between NKG2A+ or CD28+ CD8 T cell frequency within each cluster and differential expression of CD107a, IFN-γ, and TNF-α upon K562 stimulation. (H) Differential expression of CD107a upon addition of anti-DNAM-1 blocking antibody, compared to isotype control. Paired t-tests were used in (A)-(C), linear models in (D), Pearson correlations in (F)-(G) and unpaired t-tests in (G)-(H). (F)-(H): Each dot represents a cluster. All statistical tests were adjusted for multiple comparison. (A): Error bars represent the SEM. * p<0.05, **p<0.01, ***p<0.001, **** p<0.0001. See also Figure S3, Table S4.
Figure 4.
Figure 4.. NKG2A defines a subset of PD-1+ TRM CD8+ T cells that retain TCR-independent functions in bladder tumors.
(A-I) Mass cytometry was performed ex vivo on BDLN (n=5), tumor (n=7) and adjacent non-involved tissue (n=6) from BC patients. (A) Representative CD8 T cell t-SNE clustering analysis (n=1). (B) CD8 T cell phenotype. (C) FlowSOM cluster analysis of CD8 T cells. Each row represents a cluster, each column a marker. Bottom: Cluster distribution in each tissue type. (D) Representative UMAP analysis of CD8 T cells from bladder tumor (n=1). (E) Representative expression of PD1/NKG2A per UMAP cluster alongside pseudotime (n=1). (F) Correlation of marker expression with pseudotime. (G) NKG2A expression on PD-1+ CD8 T cells (n=6). (H) NKG2A−/+ PD-1+ CD8 T cell phenotype in the tumors (n=6). (I) Median Signal Intensity (MSI) of TFs in NKG2A−/+ PD-1+ CD8 T cells in the tumors (n=6). Paired t-tests were used in (B), (H)-(I) and Spearman correlations in (F). p-values were adjusted for multiple comparison. “ns” p>0.05, * p<0.05, ** p<0.01. (B), (H)-(I): Lines show donor-matching samples. (H)-(I) show only the significant comparisons. (G): Error bars represent the SEM. See also Figure S4, Tables S1, S4.
Figure 5.
Figure 5.. CD94 and NKG2A are acquired on CD8 T cells after PD-1 and along with innate-like features of differentiation and TRM phenotypes in bladder tumors.
(A) Velocity analyses map transcriptional dynamics alongside cell differentiation, as represented by latent time. (B) UMAP clustering analysis of scRNAseq data from bladder tumor-derived CD8 T cells. (C) RNA velocity of selected genes as a function of latent time, i.e CD8 T cell differentiation. Each row represents one gene, each column a latent time. Left: all coding non-mitochondrial genes that significantly correlate with latent time (p<0.05, R>0.09). Right: key genes of interest. See also Tables S1, S5.
Figure 6.
Figure 6.. TCR-independent function is acquired by CD8 T cells upon NKG2A upregulation and is enhanced with NKG2A blockade in bladder cancer.
(A-D) CD8 T cells were expanded from BDLN. CD49a−/+ NKG2A PD1 cells were then FACS-sorted and expanded during 3 days with or without TGF-β, prior to co-culture with K562. CyTOF was performed at all timepoints. (B) NKG2A/PD1 expression on CD49a NKG2A PD1 CD8 T cells after culture with or without TGF-β (n=5). (C) Upregulation of functional markers upon K562 stimulation of NKG2A PD1 CD8 T cells after TGF-β culture (n=11). (D) Phenotype and response to K562 after expansion of NKG2A PD1 CD8 T cells and NKG2A/PD1 upregulation (n=11). (E-K) CD8 T cells were expanded from bladder tumors (n=6) and co-cultured with HLA-E+ K562. (F-G) Effect of DNAM-1 blockade on (F) NKG2A+ or (G) NKG2A+ TIGIT+/− CD8 T cell degranulation upon HLA-E+ K562 stimulation. (H) Effect of NKG2A blockade (monalizumab) on CD8 T cell degranulation upon HLA-E+ K562 stimulation. (I) Spearman correlation between HLA-E expression on CD45 bladder tumors and intensity of CD107a expression by NKG2A+ CD8 T cells that is restored by monalizumab upon co-culture with HLA-E+ K562. (J-K) Effect of NKG2A blockade (monalizumab) on NKG2A+ TIGIT+/− CD8 T cell degranulation and release of cytotoxic mediators upon HLA-E+ K562 stimulation. (L-N) CD8 T cells were expanded from BDLN (n=4) and PBMCs from BC patients (n=4) prior to co-culture with HLA-E+ K562. (M-N) Effect of NKG2A blockade (monalizumab) on NKG2A+ TIGIT+/− CD8 T cell degranulation and release of cytotoxic mediators upon HLA-E+ K562 stimulation. Paired t-tests were used in (C), (F)-(H), (J)-(K), (M)-(N). Corrections for multiple comparisons were applied in (C)-(D). Only significant observations (p<0.05) are shown in (D). * p<0.05, ** p<0.01, *** p<0.001, **** p<0.0001. (B): Error bars represent the SEM. See also Figure S6, Tables S1, S4.
Figure 7.
Figure 7.. KLRC1 (NKG2A) gene expression correlates with better survival in bladder cancer in response to PD-L1 blockade immunotherapy.
Kaplan-meier survival curves of MIBC and metastatic BC patients treated with PD-L1 blockade from the IMvigor210 cohort, showing the association between KLRC1 (NKG2A) expression and overall survival in (A) all patients or patients with (B) CD8Ahigh/low gene expression, (C) PDCD1high/low (PD-1) gene expression or (D) a PD-L1 immunohistochemistry score of 0 or [1–3]. Hazard ratios and p-values were calculated using COX proportional hazards regression models that were corrected for age, gender and race.

References

    1. André P, Denis C, Soulas C, Bourbon-Caillet C, Lopez J, Arnoux T, Bléry M, Bonnafous C, Gauthier L, Morel A, et al. (2018). Anti-NKG2A mAb Is a Checkpoint Inhibitor that Promotes Anti-tumor Immunity by Unleashing Both T and NK Cells. Cell 175, 1731–1743.e1713. - PMC - PubMed
    1. Aramburu J, Balboa MA, Ramírez A, Silva A, Acevedo A, Sánchez-Madrid F, De Landázuri MO, López-Botet M (1990). A novel functional cell surface dimer (Kp43) expressed by natural killer cells and I cell receptor-gamma/delta+ T lymphocytes. I. Inhibition of the IL-2-dependent proliferation by anti-Kp43 monoclonal antibody. J Immunol 144, 3238–3247. - PubMed
    1. Bajorin DF, Witjes JA, Gschwend JE, Schenker M, Valderrama BP, Tomita Y, Bamias A, Lebret T, Shariat SF, Park SH, et al. (2021). Adjuvant Nivolumab versus Placebo in Muscle-Invasive Urothelial Carcinoma. N Engl J Med 384, 2102–2114. - PMC - PubMed
    1. Banchereau R, Chitre AS, Scherl A, Wu TD, Patil NS, de Almeida P, Kadel Iii EE, Madireddi S, Au-Yeung A, Takahashi C, et al. (2021). Intratumoral CD103+ CD8+ T cells predict response to PD-L1 blockade. J Immunother Cancer 9. - PMC - PubMed
    1. Banta KL, Xu X, Chitre AS, Au-Yeung A, Takahashi C, O’Gorman WE, Wu TD, Mittman S, Cubas R, Comps-Agrar L, et al. (2022). Mechanistic convergence of the TIGIT and PD-1 inhibitory pathways necessitates co-blockade to optimize anti-tumor CD8(+) T cell responses. Immunity 55, 512–526 e519. - PMC - PubMed

MeSH terms

Substances