. 2022 Sep 13;13(1):5346.
doi: 10.1038/s41467-022-32927-4.

Inhibition of interleukin-1β reduces myelofibrosis and osteosclerosis in mice with JAK2-V617F driven myeloproliferative neoplasm

Affiliations

Inhibition of interleukin-1β reduces myelofibrosis and osteosclerosis in mice with JAK2-V617F driven myeloproliferative neoplasm

Shivam Rai et al. Nat Commun. .

Abstract

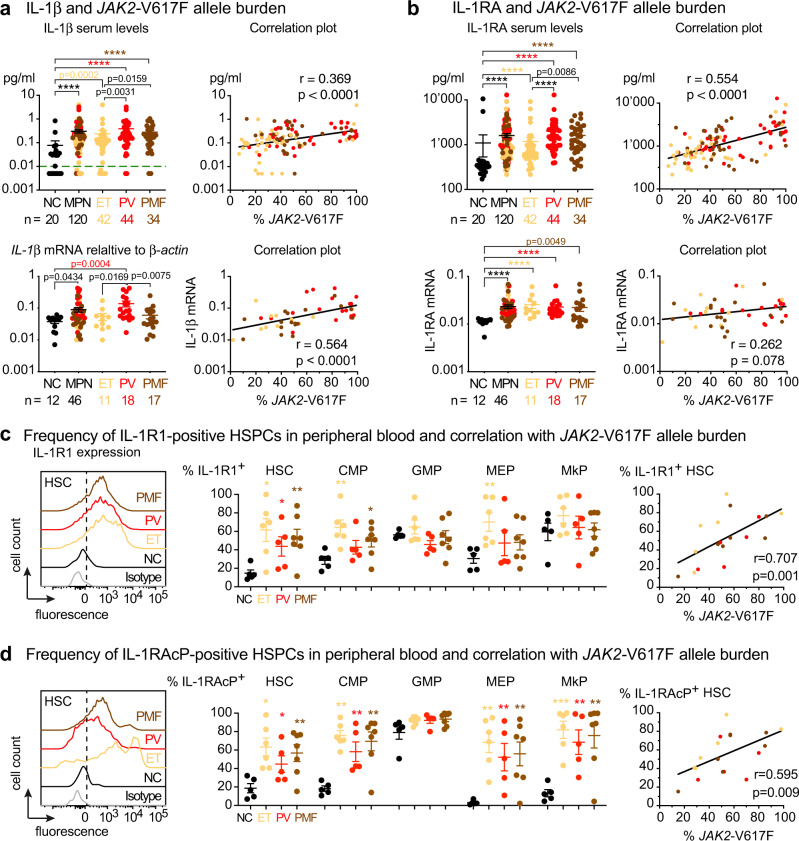
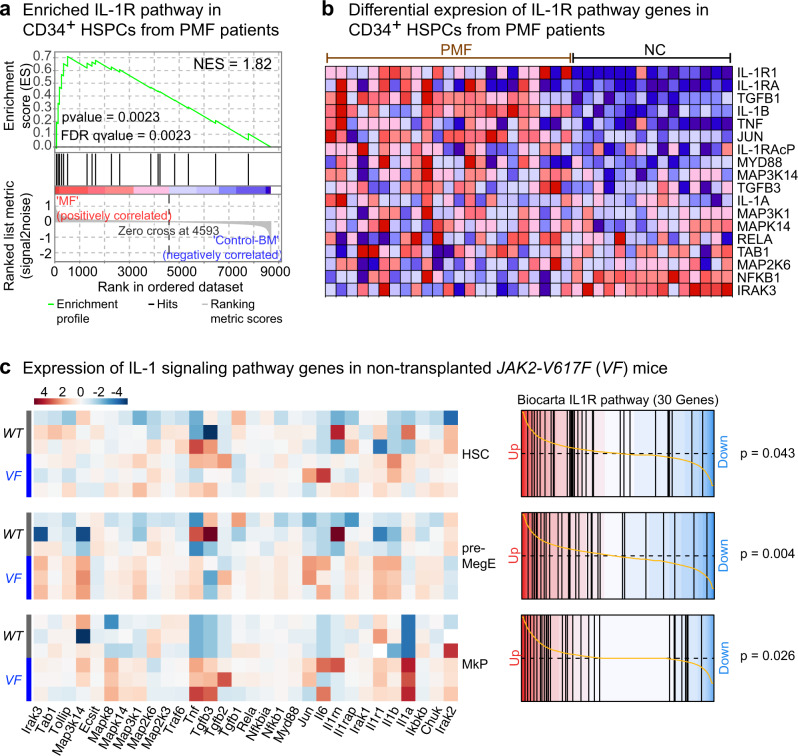
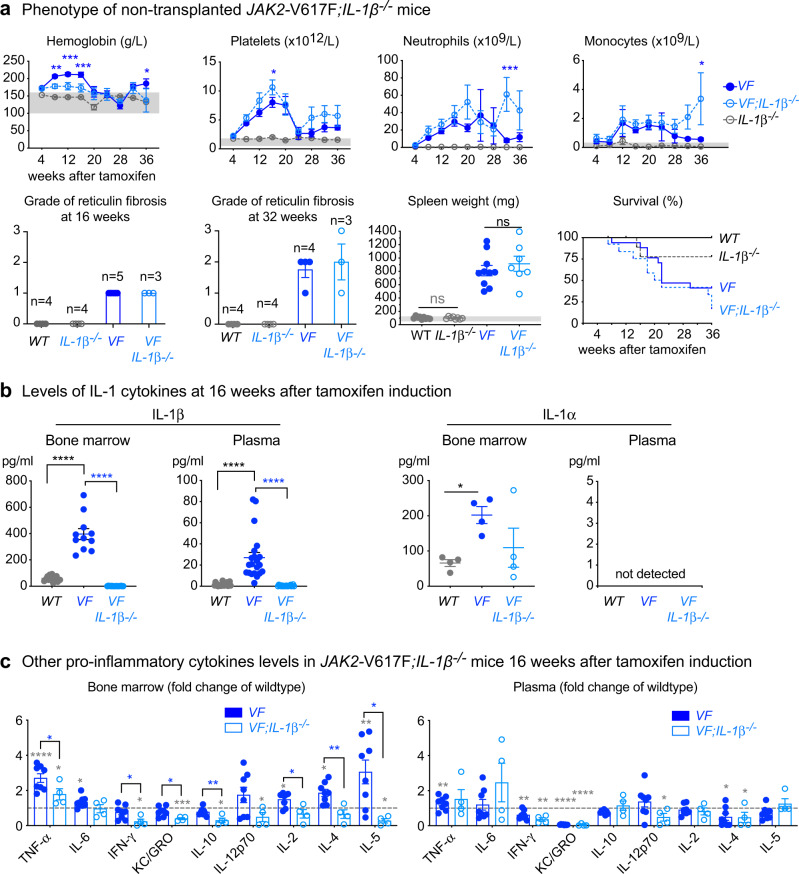
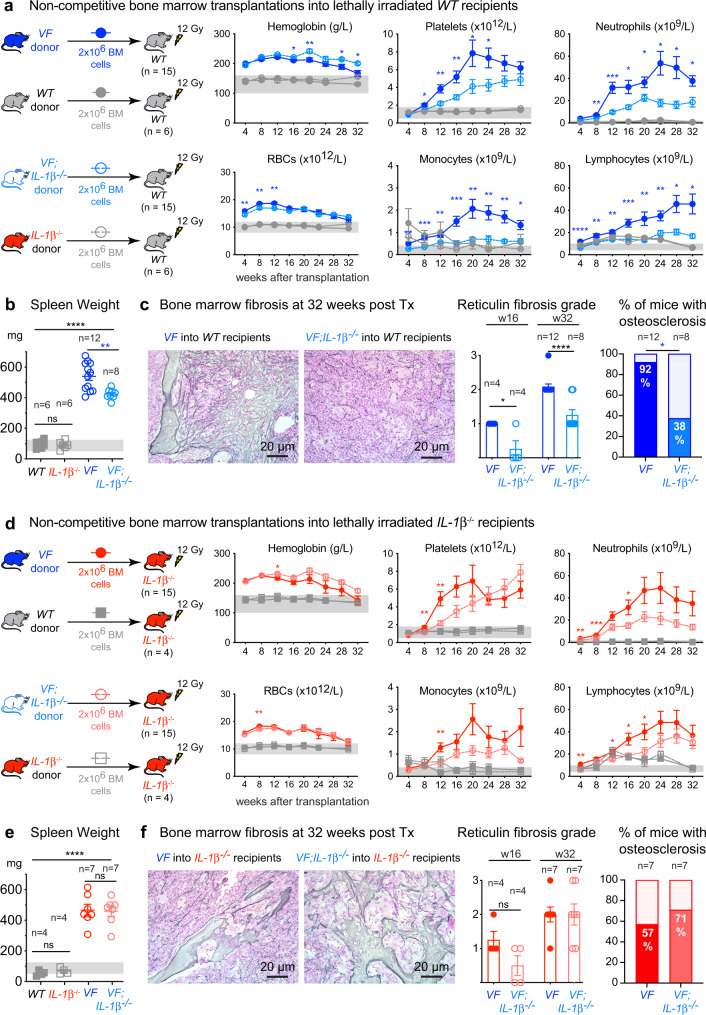
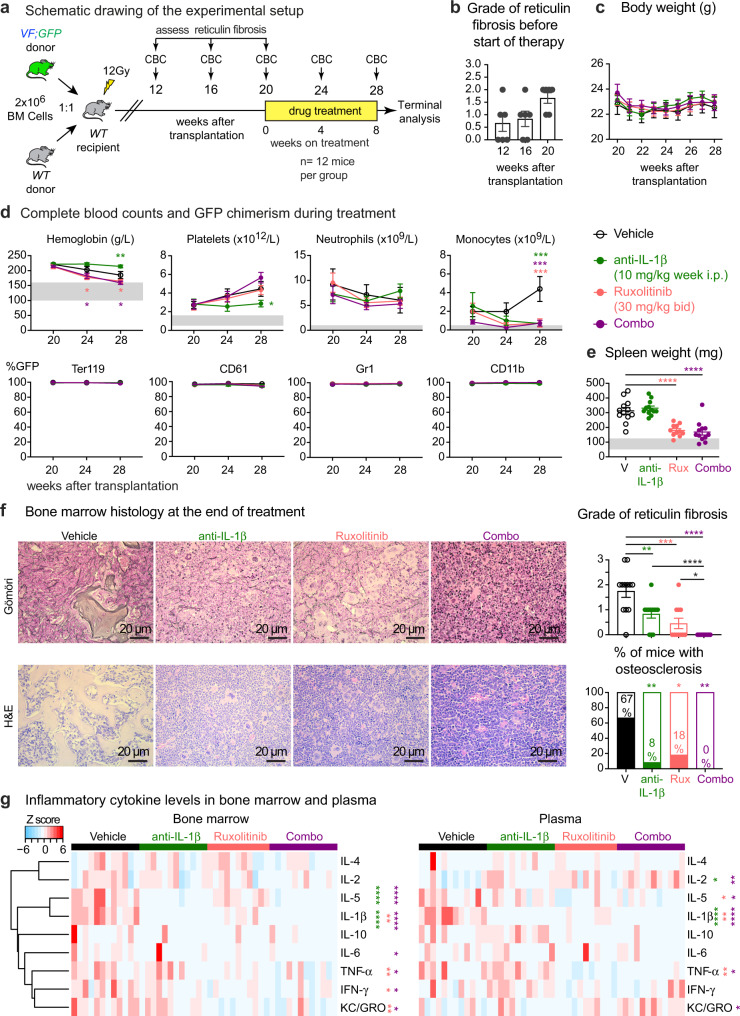
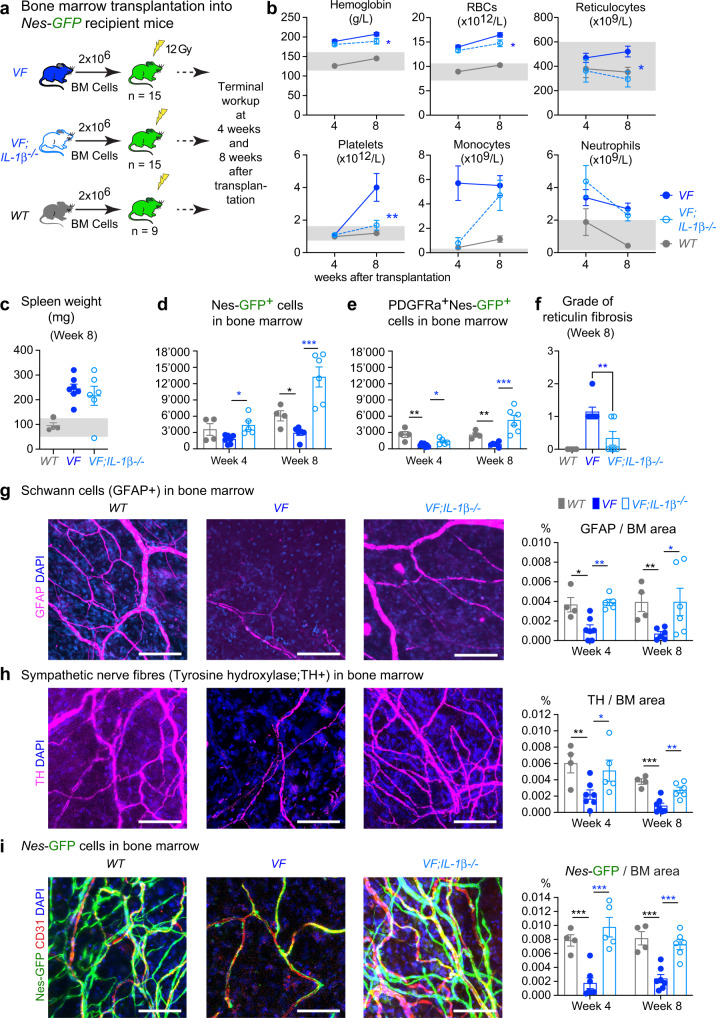
Interleukin-1β (IL-1β) is a master regulator of inflammation. Increased activity of IL-1β has been implicated in various pathological conditions including myeloproliferative neoplasms (MPNs). Here we show that IL-1β serum levels and expression of IL-1 receptors on hematopoietic progenitors and stem cells correlate with JAK2-V617F mutant allele fraction in peripheral blood of patients with MPN. We show that the source of IL-1β overproduction in a mouse model of MPN are JAK2-V617F expressing hematopoietic cells. Knockout of IL-1β in hematopoietic cells of JAK2-V617F mice reduces inflammatory cytokines, prevents damage to nestin-positive niche cells and reduces megakaryopoiesis, resulting in decrease of myelofibrosis and osteosclerosis. Inhibition of IL-1β in JAK2-V617F mutant mice by anti-IL-1β antibody also reduces myelofibrosis and osteosclerosis and shows additive effects with ruxolitinib. These results suggest that inhibition of IL-1β with anti-IL-1β antibody alone or in combination with ruxolitinib could have beneficial effects on the clinical course in patients with myelofibrosis.


Conflict of interest statement

R.C.S. has consulted for and received honoraria from Novartis and Celgene/BMS, he is a scientific advisor/SAB member and has equity in Ajax Therapeutics; N.H. owns stocks in the company Cantargia; C.J.F. is a full-time employee of Novartis Pharma AG. The inhibitor studies were carried out in the laboratory of R.C.S. with inhibitors provided by Novartis. The remaining authors declare no competing financial interests.

Figures

Fig. 1
Fig. 1. JAK2-V617F correlated with increased IL-1 expression in MPN patients.
a Upper panel: Serum IL-1β (pg/ml) in normal controls (NC; n = 20) and MPN patients (n = 120); ET (n = 42), PV (n = 44), PMF (n = 34). Correlation (r) between % JAK2-V617F in granulocytes and log transformed serum IL-1β in MPN patients. Limit of detection is shown by dashed green line at y = 0.01 pg/ml. Lower panel: IL-1β mRNA expression relative to β-actin in granulocytes of NC (n = 12) and MPN patients (n = 46); ET (n = 11), PV (n = 18), PMF (n = 17). Correlation between log transformed IL1B mRNA expression and % JAK2-V617F. b Upper panel: Serum IL-1RA (pg/ml) in NC (n = 20) and MPN patients (n = 120); ET (n = 42), PV (n = 44), PMF (n = 34). Correlation (r) between % JAK2-V617F and log transformed serum IL-1RA. Lower panel: IL1RN (IL-1RA) mRNA expression relative to β-actin in NC and MPN patients. Correlation between log transformed IL1RN mRNA expression and % JAK2-V617F. Two-tailed unpaired non-parametric Mann–Whitney t-test was performed in a and b. c Representative histogram showing the expression of interleukin 1 receptor type 1 (IL-1R1) in peripheral blood hematopoietic stem cells (HSCs) from isotype control, NC (n = 5), ET (n = 6), PV (n = 5), and PMF (n = 7). Bar graph showing the percentages of IL-1R1+ HSC), common myeloid progenitors (CMP), granulocyte macrophage progenitor (GMP), megakaryocyte erythroid progenitor (MEP) and megakaryocyte progenitor (MkP). Graph showing correlation (r) between % JAK2-V617F and percentages of IL-1R1 + HSCs. d Representative histogram showing the expression of interleukin 1 receptor accessory protein (IL-1RAcP) in peripheral blood HSC from NC and MPN patients. Bar graph showing the percentages of IL1RAcP+ HSC, CMP, GMP, MEP, and MkP in NC (n = 5), ET (n = 6), PV (n = 5), and PMF (n = 7). Correlation (r) between % JAK2-V617F and percentages of IL-1RAcP+ HSPCs. Two-tailed unpaired t-test was performed for statistical comparisons in c and d. Spearman correlation (r) and two-tailed t-test was performed for correlation analysis in ad. All data are presented as mean ± SEM. *P < 0.05; **P < 0.01; ***P < 0.001; ****P < 0.0001. See also Supplementary Figs. 1–3. Source data and exact p values are provided as a Source Data file.
Fig. 2
Fig. 2. Expression of IL-1 pathway genes are upregulated in MPN.
a Expression of IL-1R pathway gene signatures is tested for enrichment by Gene Set Enrichment Analysis (GSEA) in peripheral blood CD34+ HSPCs from PMF patients (n = 23) and bone marrow CD34+ HSPCs from normal controls (n = 15). Comparisons with p-value <0.05 and FDR q-value <0.05 were considered significant. Analysis of publicly available dataset. Affymetrix data were dowloaded as normalized expression levels from Gene Expression Omnibus database (GSE53482) using the GEOquery package (R, Vienna, Austria. https://www.R-project.org/). The normalization of the expression data was checked by boxplot representation. Gene Set Enrichment Analysis (GSEA) was performed with the GSEAv4.1.0 software (Broad Institute). All gene sets were obtained from GSEA website (https://www.gsea-msigdb.org). Enrichment map was used for visualization of the GSEA results. Normalized Enrichment score (NES) and False discovery rate (FDR) p-values were applied after a 10,000 gene set permutations. b Heatmap representation of expression levels of IL-1R pathway genes in CD34+ HSPCs from PMF patients (n = 23) and normal controls (n = 15). Analysis of publicly available dataset. c Heatmap representation of the differential expression of IL-1 signaling pathway genes in hematopoietic stem cells (HSC; LinSca1+cKit+CD48CD150+), megakaryocyte-erythroid precursors (MEP or pre-MegE; LinSca1cKit+CD41CD16105CD150+) and megakaryocyte progenitors (MkP; LinSca1cKit+CD41+CD150+) between VF (n = 3) and WT (n = 3) mice is shown (left). Barcode plots showing custom Gene Set Enrichment Analysis (GSEA) of the Biocarta IL-1R pathway in HSC, pre-MegE (or MEP) and MkP from VF vs WT (right). Source data are provided as a Source Data file.
Fig. 3
Fig. 3. Genetic deletion of IL-1β in a JAK2-V617F MPN mouse model.
a Wildtype (WT; n = 9), IL-1β knock-out (IL-1β−/−; n = 11), Scl;Cre;V617F (VF; n = 18) and Scl;Cre;V617F; IL-1β knock-out (VF;IL-1β−/−; n = 13) mice were induced with tamoxifen and disease kinetics were followed for 36 weeks. Complete blood counts, grade of reticulin fibrosis at 16- and 32-weeks after tamoxifen and spleen weight at 16 weeks after tamoxifen induction are shown. Kaplan-Meier survival curve showing the percent survival of mice Grey area represents normal range. Two-way ANOVA followed by Tukey’s multiple comparison tests were used for multiple group comparisons for blood counts. Two-tailed unpaired t test was performed for spleen weight. b left panel: IL-1β protein levels in BM lavage (1 femur and 1 tibia) of WT (n = 13), VF (n = 11) and VF;IL-1β−/− (n = 18) and plasma of WT (n = 21), VF (n = 21) and VF;IL-1β−/− (n = 20) mice at 12–16 weeks after tamoxifen induction. IL-1α levels (middle panel) BM and plasma is shown (n = 4 per group). Two-tailed unpaired non-parametric Mann–Whitney t-test was performed. c Pro-Inflammatory cytokine levels (normalized to WT; dotted line) in BM lavage and plasma of WT (n = 8), VF (n = 8) and VF;IL-1β−/− (n = 4) mice at 16 weeks after tamoxifen induction. Two-tailed unpaired t-tests were performed for multiple comparisons. Grey asterisk represents the comparison between WT and VF or VF;IL-1β−/− All data are presented as mean ± SEM. *P < 0.05; **P < 0.01; ***P < 0.001; ****P < 0.0001. See also Supplementary Figs. 4 and 5. Source data and exact p values are provided as a Source Data file.
Fig. 4
Fig. 4. Loss of IL-1β in JAK2-V617F mutant cells reduces MPN symptom burden and myelofibrosis.
a Schematic of non-competitive transplantation with 2 million BM cells from tamoxifen induced VF, WT, VF; IL-1β−/−, or IL-1β−/− donor mice into lethally irradiated WT recipients (n = 15 per group). Complete blood counts measured every 4 weeks until 32 weeks after transplantation are shown. Two-tailed unpaired t-tests without correction for multiple comparisons was performed. Grey area represents normal range. b Bar graph shows the spleen weight at 32 weeks after transplantation. Two-tailed unpaired t test was performed. c Representative images of bone marrow fibrosis (reticulin fibrosis) are shown at 32-weeks after transplantation. Histological grade of reticulin fibrosis in the BM at 16- and 32-weeks after transplantation is shown in the bar graph. Two-tailed unpaired t test was performed. Bar graph showing the percentage of mice with osteosclerosis in the BM. d Schematic of non-competitive transplantation with 2 million BM cells from tamoxifen induced VF, WT, VF;IL-1β−/−, or IL-1β−/− donor mice into lethally irradiated IL-1β−/− recipients (n = 15 per group). Complete blood counts measured every 4 weeks until 32 weeks after transplantation are shown. Two-tailed unpaired t-tests without correction for multiple comparisons was performed. Grey area represents normal range. e Bar graph shows the spleen weight at 32 weeks after transplantation. Two-tailed unpaired t test was performed. f Representative images of BM fibrosis (reticulin fibrosis) are shown at 32 weeks after transplantation. Histological grade of reticulin fibrosis in the BM at 16- and 32-weeks after transplantation is shown in the bar graph. Bar graph showing the percentage of mice with osteosclerosis in the BM. All data are presented as mean ± SEM. *P < 0.05; **P < 0.01; ***P < 0.001; ****P < 0.0001. See also Supplementary Figs. 6–8. Source data and exact p values are provided as a Source Data file.
Fig. 5
Fig. 5. Pharmacological inhibition of IL-1β decreased myelofibrosis in MPN mice.
a Experimental setup of the drug treatment. b Grade of reticulin fibrosis was determined before therapy in groups of n = 6 mice killed at 12-, 16-, and 20-weeks after transplantation. c Time course of body weights (n = 12 mice per treatment group). Two-way ANOVA followed by uncorrected Fisher’s LSD test was performed. d Blood counts and mutant cell (% GFP) chimerism in the peripheral blood of vehicle (n = 12); ruxolitinib (n = 11); anti-IL-1β (n = 12); combo (n = 12) treated mice in erythroid (Ter119), megakaryocytic (CD61), granulocytic (Gr1), and monocytic (CD11b) lineages. Two-way ANOVA followed by uncorrected Fisher’s LSD test was performed. Two-way ANOVA followed by Dunnett’s multiple comparisons test was performed for GFP chimerism. e Spleen weights of vehicle (n = 12); ruxolitinib (n = 11); anti-IL-1β (n = 12); combo (n = 12) treated mice after 8 weeks of drug treatment. Two-tailed unpaired t-test was performed. Grey area represents normal range. f Representative images of reticulin fibrosis and H&E staining is shown and histological grade of reticulin fibrosis in the BM is illustrated in the bar graph. Similar results were obtained with other mice in each condition. Stacking bar graph showing the percentage of mice with osteosclerosis in the BM of vehicle (n = 12); Ruxolitinib (n = 11); anti-IL-1β (n = 12); and combo (n = 12). Two-tailed unpaired t test was performed for comparisons of fibrosis grades between different groups. p value is computed using Fisher’s exact test for presence or absence of osteosclerosis in bone marrow. g Heatmap plot showing the inflammatory cytokine levels in the BM lavage and plasma of mice after 8 weeks of drug treatment. Vehicle (n = 12); Ruxolitinib (n = 11); anti-IL-1β (n = 12); combo (n = 12). The color bars indicate treatment groups. Heatmap shows Z scores. Two-tailed unpaired t-tests without correction for multiple comparisons was performed. Green-colored asterisk is used for comparison of vehicle vs. anti-IL-1β; salmon for vehicle vs. ruxolitinib; plum for vehicle vs. combo. All data are presented as mean ± SEM. *P < 0.05; **P < 0.01; ***P < 0.001; ****P < 0.0001. See also Supplementary Figs. 9–11. Source data and exact p values are provided as a Source Data file.
Fig. 6
Fig. 6. Deletion of IL-1β in JAK2-V617F mutant hematopoietic cells prevented the loss of nestin+ MSCs in bone marrow.
a Scheme of non-competitive (1:0) transplantation into Nestin-GFP mice. b Complete blood counts at 4-weeks (VF; n = 7, VF;IL-1β−/−; n = 6, and WT; n = 4) and 8-weeks (VF; n = 7, VF;IL-1β−/−; n = 6, and WT; n = 4) after transplantation. c Spleen weights after 8 weeks of transplantation (VF; n = 7, VF;IL-1β−/−; n = 6, and WT; n = 4). d Number of Ter119CD45CD31GFP+ cells in BM (1 tibia and 2 hip bones) at 4-weeks (VF; n = 7, VF;IL-1β−/−; n = 5, and WT; n = 4) and 8-weeks (VF; n = 6, VF;IL-1β−/−; n = 6, and WT; n = 4) after transplantation. e Total number of Ter119-CD45-CD31-GFP+ cells co-expressing platelet derived growth factor receptor α (PDGFR α) at 4-weeks (VF; n = 7, VF;IL-1β−/−; n = 5, and WT; n = 4) and 8-weeks (VF; n = 6, VF;IL-1β−/−; n = 6, and WT; n = 4). f Grade of reticulin fibrosis 8-weeks after transplantation. VF; n = 7, VF;IL-1β−/−; n = 6, and WT; n = 4. g Representative images of glial fibrillary acidic protein (GFAP)-positive Schwann cells in skull BM and quantification of GFAP area at 4-weeks (VF; n = 7, VF;IL-1β−/−; n = 5, and WT; n = 4) and 8-weeks (VF; n = 6, VF;IL-1β−/−; n = 6, and WT; n = 4) after transplantation (right). h Representative images of tyrosine hydroxylase (TH)-positive sympathetic nerve fibers in skull BM and quantification at 4-weeks (VF; n = 7, VF;IL-1β−/−; n = 5, and WT; n = 4) and 8-weeks (VF; n = 7, VF;IL-1β−/−; n = 6, and WT; n = 4) after transplantation (right). i Representative images of Nestin-GFP cells in skull BM and quantification at 4-weeks (VF; n = 7, VF;IL-1β−/−; n = 5, and WT; n = 4) and 8-weeks (VF; n = 7, VF;IL-1β−/−; n = 6, and WT; n = 4) (right). Similar results were obtained with other mice of each genotype in gi (left panel). Scale bar is 100 µm in gi (left panel). Statistical significances in all graphs were determined by multiple unpaired two-tailed t-tests. Grey area represents normal range. All data are presented as mean ± SEM. *P < 0.05; **P < 0.01; ***P < 0.001; ****P < 0.0001. See also Supplementary Fig. 12. Source data and exact p values are provided as a Source Data file.

Similar articles

Cited by

References

    1. Levine RL, Gilliland DG. Myeloproliferative disorders. Blood. 2008;112:2190–2198. doi: 10.1182/blood-2008-03-077966. - DOI - PMC - PubMed
    1. Vainchenker W, Kralovics R. Genetic basis and molecular pathophysiology of classical myeloproliferative neoplasms. Blood. 2017;129:667–679. doi: 10.1182/blood-2016-10-695940. - DOI - PubMed
    1. Gangat N, Tefferi A. Myelofibrosis biology and contemporary management. Br. J. Haematol. 2020;191:152–170. doi: 10.1111/bjh.16576. - DOI - PubMed
    1. Tefferi A, et al. Circulating interleukin (IL)−8, IL-2R, IL-12, and IL-15 levels are independently prognostic in primary myelofibrosis: a comprehensive cytokine profiling study. J. Clin. Oncol. 2011;29:1356–1363. doi: 10.1200/JCO.2010.32.9490. - DOI - PubMed
    1. Vaidya R, et al. Plasma cytokines in polycythemia vera: phenotypic correlates, prognostic relevance, and comparison with myelofibrosis. Am. J. Hematol. 2012;87:1003–1005. doi: 10.1002/ajh.23295. - DOI - PubMed

Publication types