. 2022 Sep 13;12(1):15403.
doi: 10.1038/s41598-022-19723-2.

A 3D analysis revealed complexe mitochondria morphologies in porcine cumulus cells

Affiliations

A 3D analysis revealed complexe mitochondria morphologies in porcine cumulus cells

Amel Lounas et al. Sci Rep. .

Abstract

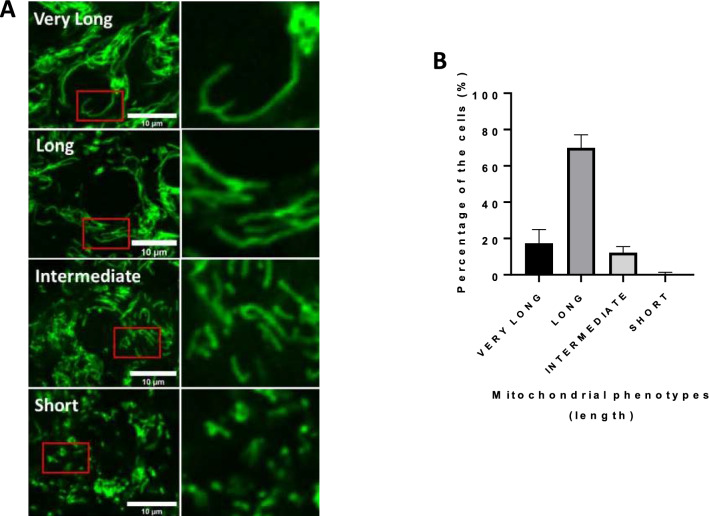
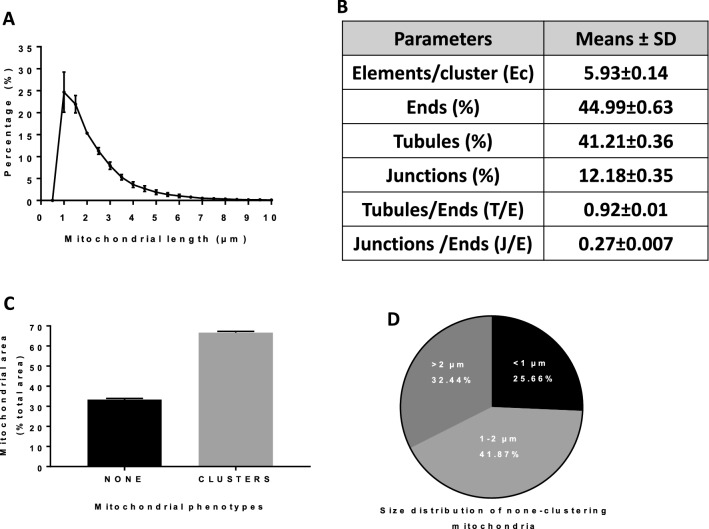
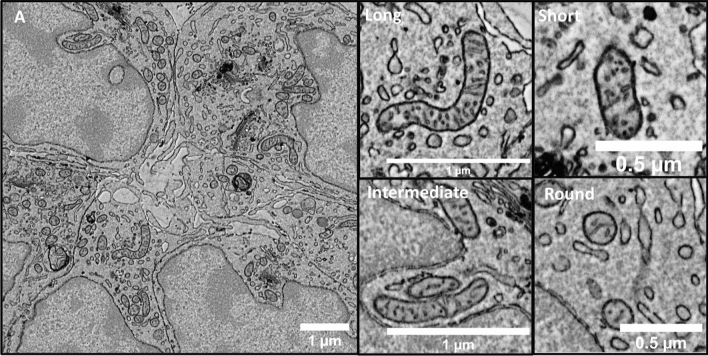
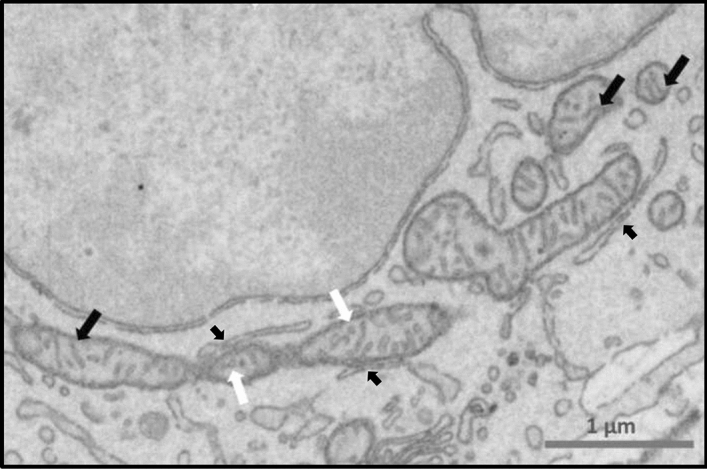
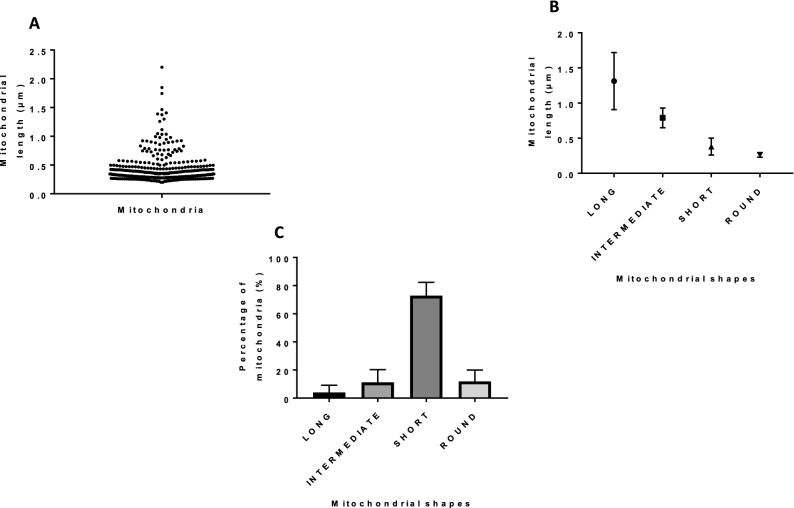
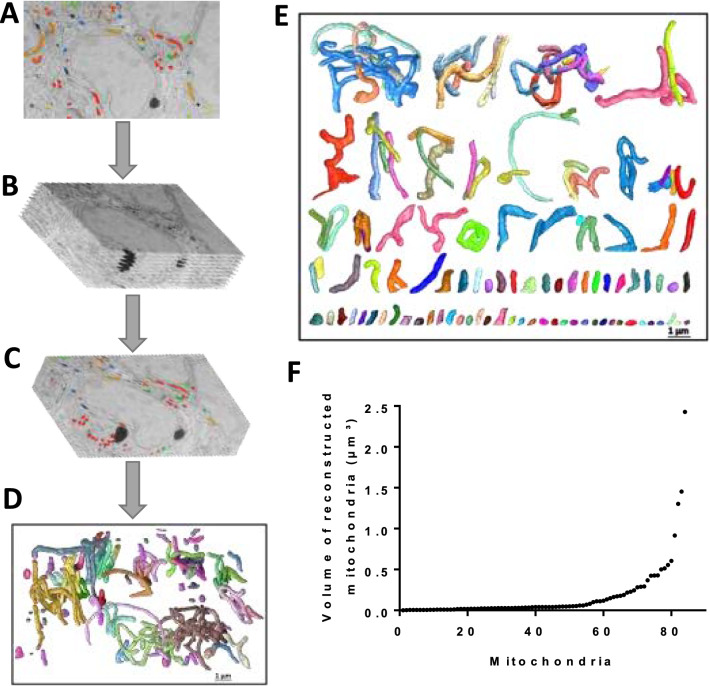
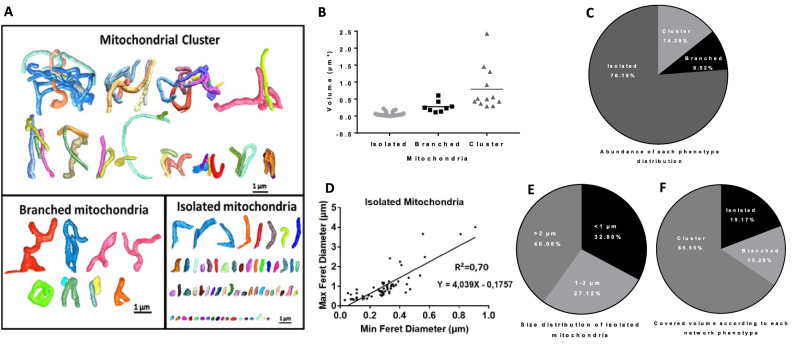
In the ovarian follicle, a bilateral cell-to-cell communication exists between the female germ cell and the cumulus cells which surround the oocyte. This communication allows the transit of small size molecules known to impact oocyte developmental competence. Pyruvate derivatives produced by mitochondria, are one of these transferred molecules. Interestingly, mitochondria may adopt a variety of morphologies to regulate their functions. In this study, we described mitochondrial morphologies in porcine cumulus cells. Active mitochondria were stained with TMRM (Tetramethylrhodamine, Methyl Ester, Perchlorate) and observed with 2D confocal microscopy showing mitochondria of different morphologies such as short, intermediate, long, and very long. The number of mitochondria of each phenotype was quantified in cells and the results showed that most cells contained elongated mitochondria. Scanning electron microscopy (SEM) analysis confirmed at nanoscale resolution the different mitochondrial morphologies including round, short, intermediate, and long. Interestingly, 3D visualisation by focused ion-beam scanning electron microscopy (FIB-SEM) revealed different complex mitochondrial morphologies including connected clusters of different sizes, branched mitochondria, as well as individual mitochondria. Since mitochondrial dynamics is a key regulator of function, the description of the mitochondrial network organisation will allow to further study mitochondrial dynamics in cumulus cells in response to various conditions such as in vitro maturation.


Conflict of interest statement

The authors declare no competing interests.

Figures

Figure 1
Figure 1
Staining of active mitochondria. (A) Images of cumulus cells stained with TMRM and observed live with confocal microscopy at 63X (n = 3). Different mitochondrial network structures in cumulus cells were observed. (B) Mitochondrial network phenotype evaluation in each cumulus cell (n = 3, mean ± SD).
Figure 2
Figure 2
Momito analysis of mitochondrial morphologies in cumulus cells using confocal images. (A) Quantification of mitochondrial length distribution. (B) Parameters of mitochondrial network. (C) Area percentage covered by each mitochondrial phenotype. (D) Size distribution of none-clustering mitochondria. (n = 3, mean ± SD).
Figure 3
Figure 3
Scanning electron microscopy micrographs showing whole cells (A) and different mitochondrial morphologies in cumulus cells (long, intermediate, short, round).
Figure 4
Figure 4
Cumulus cell scanning electron microscopy micrograph showing: examples of mitochondria with lamellar cristae (black arrow) and tubular cristae (white arrow). Mitochondria in the top right of the image show a developed lamellar crista connected to the inner mitochondrial membrane. Several close contacts (mitochondria-associated membranes, MAM) between mitochondria and endoplasmic reticulum in cumulus cells (small black arrows).
Figure 5
Figure 5
Fiji analysis of scanning electron microscopy micrographs. (A) Length distribution of all measured mitochondria. (B) Classification of mitochondrial shapes from 16 cells. (C) Percentage of each mitochondrial shape (n = 3, mean ± SD).
Figure 6
Figure 6
Dragonfly reconstruction of mitochondria in five cumulus cells using FIB-SEM micrographs. (A) 2D-electron micrograph of segmented cells. (B,C) Serial images of FIB-SEM used for 3-D reconstruction. (D) Three-dimensional organisation of all mitochondrial networks in 5 cumulus cells. (E) Different reconstructed mitochondrial structures ranked top to bottom from the largest to the smallest volume (F) mitochondrial volume quantification.
Figure 7
Figure 7
Mitochondrial parameters analysed with Dragonfly. (A) Network classification into clustered, branched, and isolated forms. (B) Volume distribution of each mitochondrial category. (C) Abundance of each mitochondrial phenotype. (D) Relationship between Min ferret and Max ferret in isolated mitochondria. (E) Size distribution of isolated mitochondria. (F) Covered volume according to each mitochondrial phenotype.

References

    1. Macaulay AD, et al. The gametic synapse: RNA transfer to the bovine oocyte. Biol. Reprod. 2014;91:90. doi: 10.1095/biolreprod.114.119867. - DOI - PubMed
    1. Xie HL, et al. Effects of glucose metabolism during in vitro maturation on cytoplasmic maturation of mouse oocytes. Sci. Rep. 2016;6:20764. doi: 10.1038/srep20764. - DOI - PMC - PubMed
    1. Santiquet NW, Develle Y, Laroche A, Robert C, Richard FJ. Regulation of gap-junctional communication between cumulus cells during in vitro maturation in swine, a gap-FRAP study. Biol. Reprod. 2012;87:46. doi: 10.1093/biolreprod/87.s1.46. - DOI - PubMed
    1. Kasahara A, Scorrano L. Mitochondria: from cell death executioners to regulators of cell differentiation. Trends Cell Biol. 2014;24:761–770. doi: 10.1016/j.tcb.2014.08.005. - DOI - PubMed
    1. Friedman JR, Nunnari J. Mitochondrial form and function. Nature. 2014;505:335–343. doi: 10.1038/nature12985. - DOI - PMC - PubMed

Publication types