. 2022 Sep;24(9):1341-1349.
doi: 10.1038/s41556-022-00984-y. Epub 2022 Sep 13.

Stem cell-derived synthetic embryos self-assemble by exploiting cadherin codes and cortical tension

Affiliations

Stem cell-derived synthetic embryos self-assemble by exploiting cadherin codes and cortical tension

Min Bao et al. Nat Cell Biol. 2022 Sep.

Erratum in

Abstract

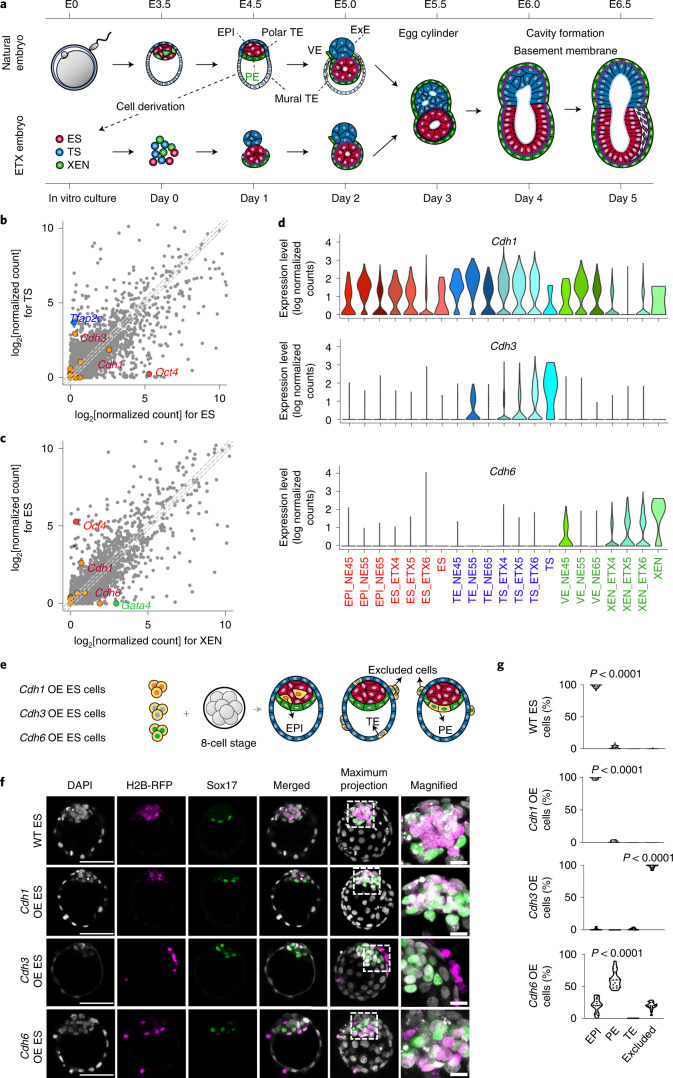
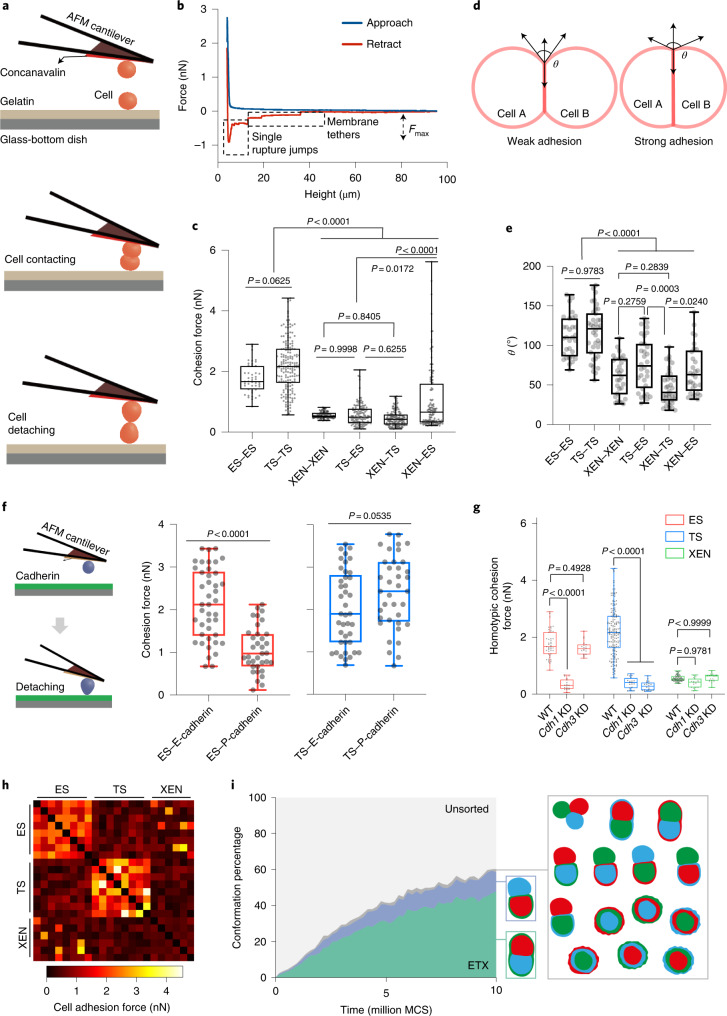
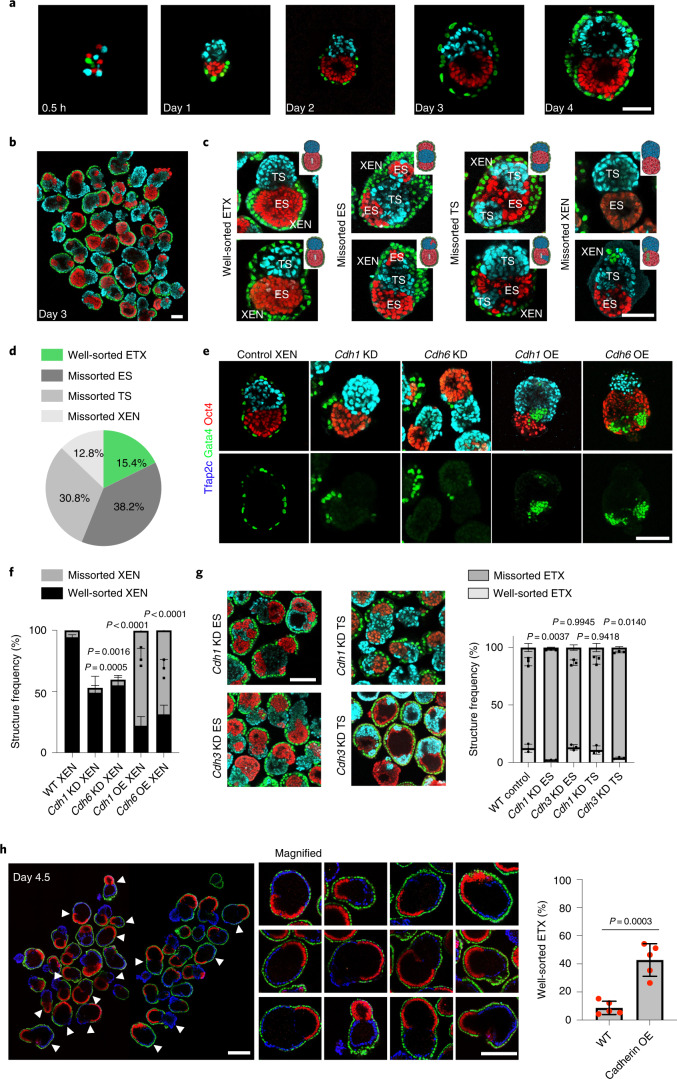
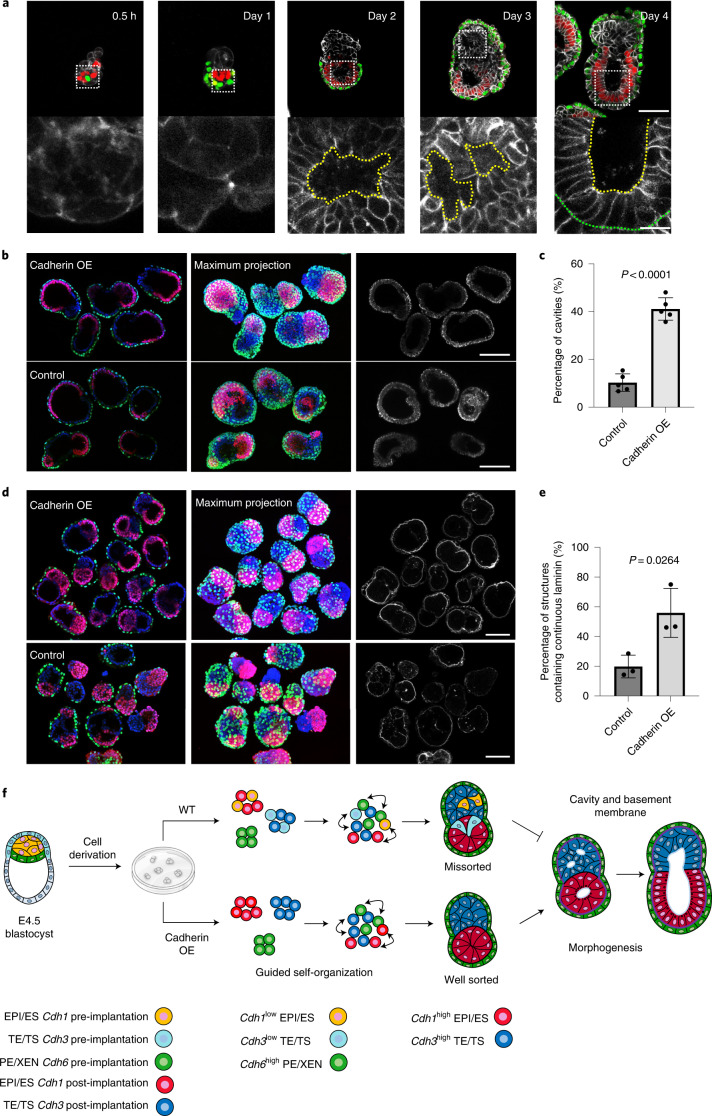
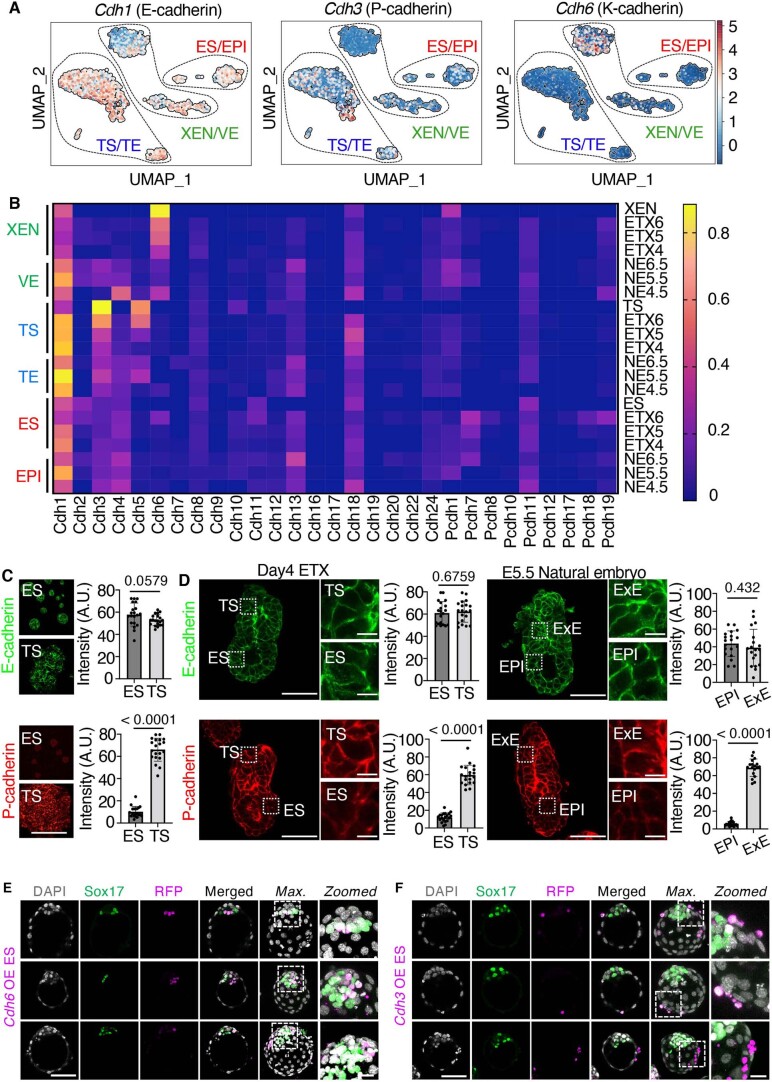
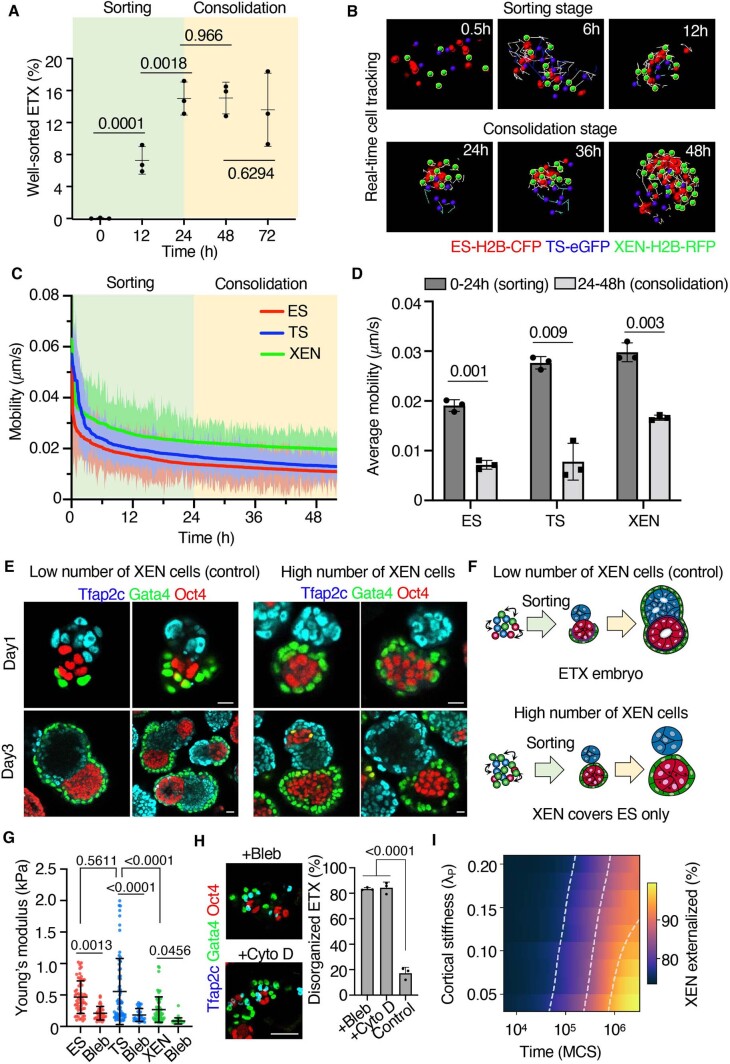
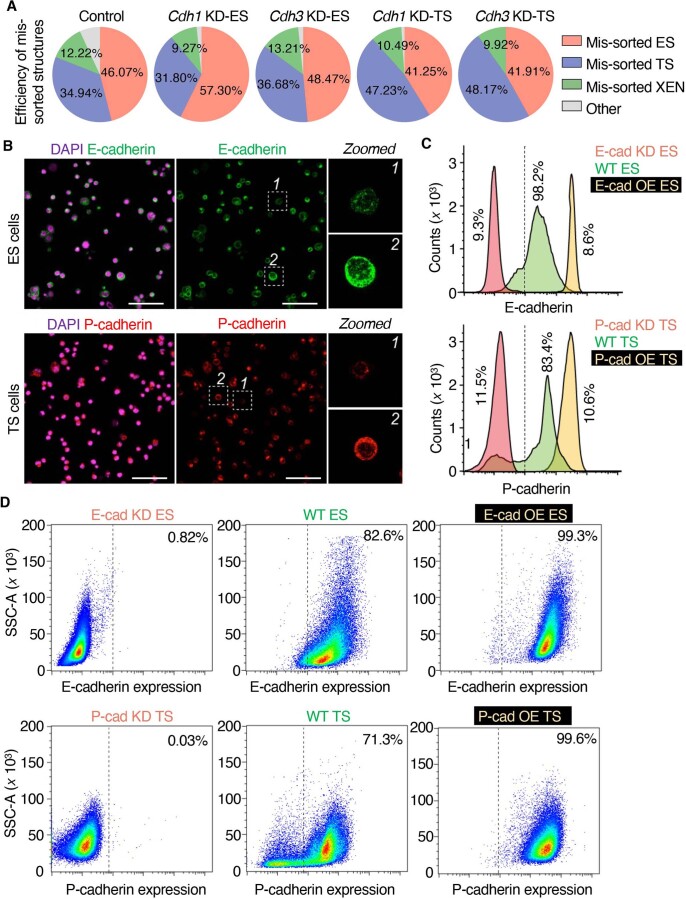
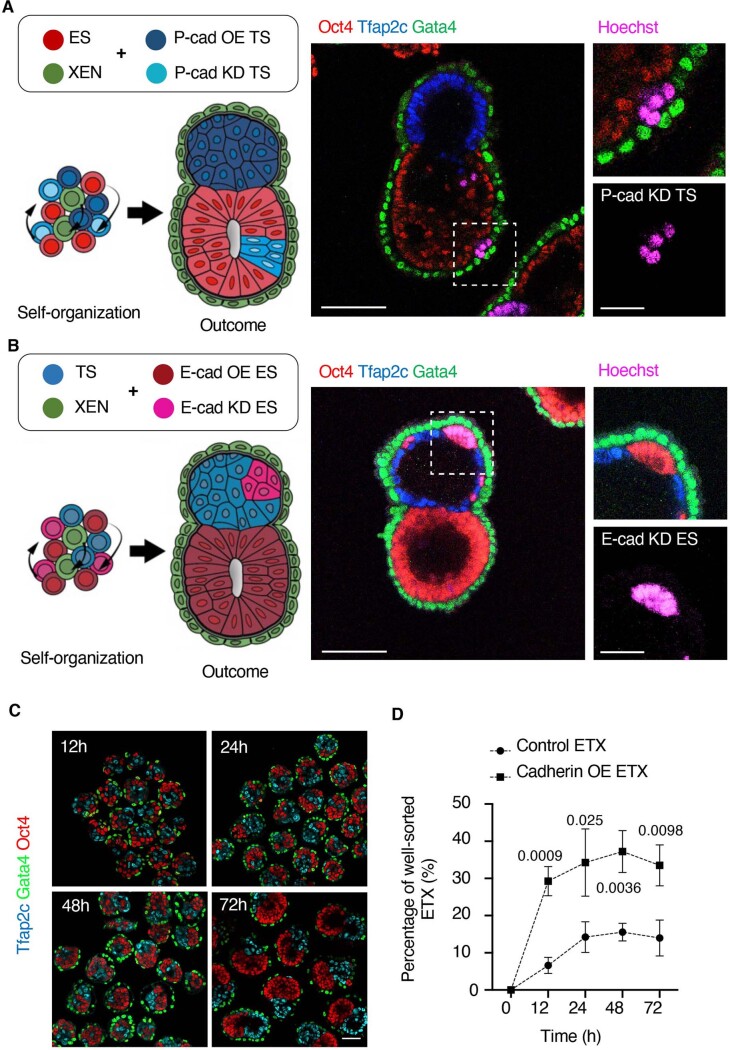
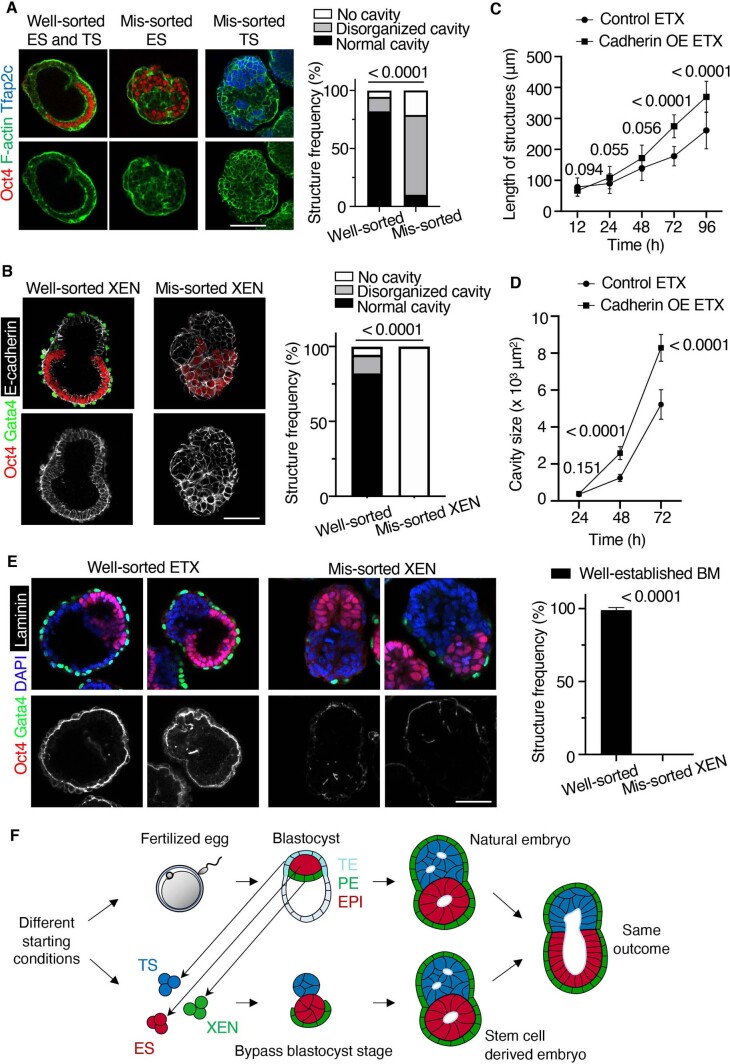
Mammalian embryos sequentially differentiate into trophectoderm and an inner cell mass, the latter of which differentiates into primitive endoderm and epiblast. Trophoblast stem (TS), extraembryonic endoderm (XEN) and embryonic stem (ES) cells derived from these three lineages can self-assemble into synthetic embryos, but the mechanisms remain unknown. Here, we show that a stem cell-specific cadherin code drives synthetic embryogenesis. The XEN cell cadherin code enables XEN cell sorting into a layer below ES cells, recapitulating the sorting of epiblast and primitive endoderm before implantation. The TS cell cadherin code enables TS cell sorting above ES cells, resembling extraembryonic ectoderm clustering above epiblast following implantation. Whereas differential cadherin expression drives initial cell sorting, cortical tension consolidates tissue organization. By optimizing cadherin code expression in different stem cell lines, we tripled the frequency of correctly formed synthetic embryos. Thus, by exploiting cadherin codes from different stages of development, lineage-specific stem cells bypass the preimplantation structure to directly assemble a postimplantation embryo.


Conflict of interest statement

We would like to disclose that we have filed a patent for this study. The applicants and inventors for this Patent are Min Bao and Magdalena Zernicka-Goetz. The patent was filed on September 2, 2022 by Caltech. This patent pertains to and covers the “Differential adhesion and tension guided formation of stem cell derived embryos”. The Patent was filed under the following number: 63/403685. The remaining authors declare no competing interests.

Figures

Fig. 1
Fig. 1. Differential cadherin code in ETX and natural embryos.
a, Schematic showing self-organization and morphological transitions in natural and stem cell-derived (ETX) embryos. Red, epiblast (EPI) in the natural embryo and ES cells in the ETX embryo. Blue, trophectoderm (TE) in the natural embryo and TS cells in the ETX embryo. Green, primitive endoderm (PE) and visceral endoderm (VE) in the natural embryo and XEN cells in the ETX embryo. Purple, mesoderm. ExE, extra-embryonic ectoderm. b, Comparison of the average scRNA-seq read counts between ES and TS cells. Data points to the left (right) of the grey dashed lines represent transcripts enriched in TS (ES) cells by more than twofold. Points on the middle of the grey dashed line indicate equally expressed genes. c, Comparison of the average scRNA-seq read counts between XEN and ES cells. Data points to the left (right) of the grey dashed lines represent transcripts enriched in ES (XEN) cells by more than twofold. Points on the middle of the grey dashed line indicate equally expressed genes. In b and c, cadherin- and protocadherin-related transcripts are highlighted in orange. d, Violin plots showing Cdh1 (top), Cdh3 (middle) and Cdh6 gene expression (bottom) from scRNA-seq in natural and ETX embryos at different stages. NE45, NE55 and NE65 represent natural embryos collected at day 4.5, 5.5 and 6.5. ETX4, ETX5 and ETX6 represent ETX embryos collected at day 4, 5 and 6. e, Schematic of chimera aggregation. Cadherin OE ES cells expressing H2B-RFP were aggregated with eight-cell-stage wild-type embryos. Their contribution to either EPI (red), PE (green), TE (blue) or excluded cells was assessed at E4.5. Orange, chimeric contribution. f, Chimeras stained for RFP (magenta), Sox17 (green) and DNA (DAPI; grey). Scale bars, 50 μm. The magnified images show the regions indicated by dashed boxes to the left (scale bars, 10 μm). The experiments were repeated three times. WT, wild type. g, Percentage of cells contributing to EPI, PE, TE or excluded cells in chimeras, as in e. The data are presented as violin plots. Each dot corresponds to an embryo. n = 32 embryos for wild-type ES chimeras (3365 cells in total), n = 16 embryos for Cdh1 OE ES chimeras (1787 cells in total), n = 13 embryos for Cdh3 OE ES chimeras (1574 cells in total) and n = 16 embryos for Cdh6 OE ES chimeras (1894 cells in total). Statistical significance was determined by one-way ANOVA with a multiple comparison test. Numerical data are available as source data. Source data
Fig. 2
Fig. 2. Differential adhesion force in ETX embryos.
a, Schematic showing cell–cell adhesion force measurement by AFM. b, The resulting force–distance curve, following the procedure depicted in a, enables quantification of the maximum adhesion force (Fmax). c, Fmax for the indicated homotypic and heterotypic adhesions between three different cell types. The experiments were performed three times independently. Total measured cell pairs: n = 60 (ES–ES), n = 177 (TS–TS), n = 101 (XEN–XEN), n = 124 (ES–TS), n = 148 (XEN–TS) and n = 134 (XEN–ES). Statistical significance was determined by one-way ANOVA with a multiple comparison test. d, Schematics of weakly and strongly adherent cell pairs at force equilibrium. θ is the contact angle of the two adhering cells. e, Distribution of the measured contact angles at all cell–cell contacts. Total measured cell pairs: n = 31 (ES–ES), n = 38 (TS–TS), n = 30 (XEN–XEN), n = 32 (TS–ES), n = 36 (XEN–TS) and n = 29 (XEN–ES). N = 3 for all conditions. Statistical significance was determined by one-way ANOVA with a multiple comparison test. f, Adhesion forces between cells and different cadherins. Left, schematic showing cell–cadherin adhesion force measurement by AFM. Right, quantification of the results. n = 42 (ES–E-cadherin), n = 35 (ES–P-cadherin), n = 41 (TS–E-cadherin) and n = 37 (TS–P-cadherin). N = 3 for all of the conditions. Statistical significance was determined by unpaired two-tailed Student’s t-test. g, Fmax for homotypic adhesion between the three different cell types after downregulation of Cdh1 or Cdh3. n = 60 (WT ES–ES), n = 18 (Cdh1 KD ES–ES), n = 19 (Cdh3 KD ES–ES), n = 177 (wild-type TS–TS), n = 20 (Cdh1 KD TS–TS), n = 20 (Cdh3 KD TS–TS), n = 101 (wild-type XEN–XEN), n = 19 (Cdh1 KD XEN–XEN) and n = 19 (Cdh3 KD XEN–XEN). N = 3 for all conditions. Statistical significance was determined by one-way ANOVA with a multiple comparison test. h, Heatmap of the adhesion parameter matrix, generated by sampling measured AFM adhesion forces, which parameterizes the CPM. i, Bootstrapping procedure to infer the distributions of conformations under the CPM (N = 498). The schematic represents all of the possible sorted conformations, demonstrating that the ETX-like configuration is the most represented. Conformations observed at a frequency of <5% are grouped. MCS, Markov Chain Steps. In the box and whisker plots in c and eg, the line inside the box indicates the median value and the error bars show the minimum and maximum values. Box edges indicate lower and upper quartile value. Numerical data are available as source data. Source data
Fig. 3
Fig. 3. Differential cadherin code regulates self-organization in ETX embryos.
a, Representative images of the assembly of ETX embryos at different times. Scale bar, 50 μm. Blue, Tfap2c; green, Gata4; red, Oct4. b, Diversity of self-assembled structures collected at day 3. Scale bar, 100 μm. Staining as in a. c, Representative images of correctly sorted and missorted ETX structures after 3 d. The inset schematics show examples of the sorting outcomes. Scale bar, 100 μm. d, Pie chart showing the proportions of correctly sorted and missorted ETX structures at day 3. The 4000 structures analysed contained three different stem cell type. Four independent experiments were performed. e, Representative images of cell sorting resulting from combining Cdh1 or Cdh6 KD or OE XEN cells with wild-type ES and TS cells. Wild-type XEN cells provided the control. Scale bar, 100 μm. Staining as in a. f, Quantification of ETX structures with well-sorted or missorted XEN cells formed by XEN cells overexpressing (OE) Cdh1 or Cdh6 or KD for either Cdh1 or Cdh6. Total numbers of structures: n = 470 (WT XEN), n = 282 (Cdh1 KD XEN), n = 519 (Cdh6 KD XEN), n = 326 (Cdh1 OE XEN) and n = 281 (Cdh6 OE XEN). N = 3. The data are presented as means ± s.d. Statistical significance was determined by one-way ANOVA with a multiple comparison test. g, Left, representative images of ETX structures of Cdh1 and Cdh3 KD ES and TS cells. Scale bar, 100 μm. Right, quantification showing well-sorted and missorted ETX embryos under the indicated conditions. Total numbers of structures: n = 4186 (control), n = 2940, (Cdh1 KD ES), n = 2471 (Cdh3 KD ES), n = 2407 (Cdh1 KD TS) and n = 2151 (Cdh3 KD TS). N = 3. The data are presented as means ± s.d. Statistical significance was determined by one-way ANOVA with a multiple comparison test. h, Left, representative images of the ETX structures formed by combining Cdh1 OE ES cells (red) with Cdh3 OE TS cells (blue) and wild-type XEN cells (green). Middle, magnified images indicating enlarged well-sorted ETX structures, as indicated by the white arrows to the left. Scale bars, 100 μm. Right, quantification of the well-sorted ETX structures, n = 3451 (control) and n = 2348 (Cdh1 and Cdh3 OE) structures were selected from five independent experiments. The data are presented as means ± s.d. Statistical significance was determined by unpaired two-tailed Student’s t-test. The experiments were repeated four times in ac and three times in e. Numerical data are available as source data. Source data
Fig. 4
Fig. 4. Correct self-organization is necessary for proper morphogenesis.
a, Time course of the assembly of ETX embryos stained to reveal E-cadherin (monochrome), Oct4 (red) and Gata4 (green). The bottom row of images are magnifications of the images above and show E-cadherin staining around a nascent cavity, as indicated by the dashed yellow lines. The dashed green line indicates the boundary between the ES and XEN compartment. Scale bar, 5 μm. b, Representative images showing Oct4 (red), Gata4 (green), E-cadherin (monochrome) and DAPI (grey) staining in day 4 cadherin OE ETX structures formed by combining E-cadherin OE ES cells with P-cadherin OE TS cells and wild-type XEN cells. ETX structures formed by combining wild-type cells were used as a control. Scale bars, 100 μm. c, Comparison and quantification of joined cavity formation in cadherin OE and control ETX structures. n = 361 (control group) and n = 253 (cadherin OE group). N = 5 for each condition. The data are presented as means ± s.d. Statistical significance was determined by unpaired two-tailed Student’s t-test. d, Representative image showing Oct4 (red), Gata4 (green), laminin (monochrome) and DAPI (blue) staining in day 4 cadherin OE ETX structures formed by combining E-cadherin OE ES cells with P-cadherin OE TS cells and wild-type XEN cells. ETX structures formed by combining wild-type cells were used as a control. Scale bars, 100 μm. e, Quantification of the structures that contained continuous or discontinuous laminin. n = 40 ETX structures per condition. N = 3. The data are presented as means ± s.d. Statistical significance was determined by unpaired two-tailed Student’s t-test. f, Self-organization principles in stem cell-derived ETX embryos. Differential expression of E-, K- and P-cadherins enables the sorting of ES (epiblast-like), XEN (VE-like) and TS (TE-like) stem cells. Wild-type ES cells with low E-cadherin expression and wild-type TS cells with low P-cadherin expression exhibited detrimental global sorting efficiency. This could be overcome by overexpressing E-cadherin in ES cells and P-cadherin in TS cells to increase the efficiency of ETX embryo formation. Proper morphogenesis, including cavity formation, basement membrane formation (purple) and symmetry breaking can only be observed in well-sorted structures. Numerical data are available as source data. Source data
Extended Data Fig. 1
Extended Data Fig. 1. Differential cadherin code in ETX-embryo and natural embryo.
(a) UMAP dimensional reduction shows Cdh1, Cdh3 and Cdh6 expression profile in different clusters as indicated by dashed lines. Each dot represents a single cell that is color-coded by sample type. (b) Heatmap showing average expression of cadherin and protocadherin related genes revealed by scRNA-seq in natural embryos (NE, n = 50) collected at 4.5, 5.5 and 6.5 days after fertilization and well-sorted ETX embryos (n = 50) at 4, 5, 6 days of culture. (c) Colonies of cultured ES and TS cells stained to reveal E-cadherin (green) and P-cadherin (red). Quantifications showing the mean intensity (A.U.) of E-cadherin or P-cadherin at cell-cell junctions. 20 colonies from 3 different experiments were selected for quantification. Scale bars represent 100 μm. Data are presented as mean ± SD. Statistics calculated by unpaired two-tailed Student’s t test. (d) Natural embryos (E5.5) and ETX embryos (Day 4) stained to reveal E-cadherin (green) and P-cadherin (red). Magnified insets show E- or P-cadherin staining in ExE and EPI compartments in natural embryos, TS and ES compartments in ETX embryos. Quantifications showing the mean intensity (A.U.) of E-cadherin or P-cadherin at cell-cell junctions. n = 20 ETX embryos and n = 19 natural embryos were used for quantification. Data are presented as mean ± SD. Statistics calculated by unpaired two-tailed Student’s t test. Scale bars represent 100 μm (main Figure) and 20μm (inset). (e) Representative images of E4.5 chimeras (8-cell stage embryos aggregated with Cdh6 or (f) Cdh3 OE ES stained for RFP (magenta), Sox17 (green), and DAPI (grey). Experiments were repeated 3 times. Scale bars represent 50 μm. Zoomed images are of regions indicated by dashed lines (scale bars represent 10 μm). Source numerical data are available in source data. Source data
Extended Data Fig. 2
Extended Data Fig. 2. Differential adhesion force in ETX embryos.
(a) Representative images of cell doublets for homotypic and heterotypic cell pairs (green, Gata4; cyan, Tfap2c; gray, Oct4; red, F-actin). Experiments were repeated 3 times. Scale bar is 10 μm. (b) Use of ImSAnE ‘Unrolling’ algorithm to project 3D E-cadherin staining stacks onto a 2D plane. Cell contact angles were quantified using built-in correction methods. Geometric observables as well as generally distortions in projections can be correctly quantified. Scale bar is 100 μm. (c) Cell-cell contact angle measurements based on ImSAnE method in day 4 ETX and E5.5 natural embryos. Total measured cell pairs in ETX embryos: ES-ES: n = 24; TS-TS: n = 15; XEN-XEN: n = 16; ES-TS: n = 24; XEN-TS: n = 19; XEN-ES: n = 16; XENi-XENi: n = 16. Total measured cell pairs in natural embryos: EPI-EPI: n = 20; TE-TE: n = 17; VE-VE: n = 22; EPI-TE: n = 24; EPI-VE: n = 16; TE-VE: n = 19; VEi-VEi: n = 24. Data are presented as box-whisker plots, black line inside the box indicates the median value and the error bar shows min to max value. Statistics calculated by one-way ANOVA with a multiple comparison test. (d) Enlargement of the boundary area in a day4 ETX embryo stained with E-cadherin, with homotypic contacts highlighted in blue (TS-TS), red (ES-ES) and purple (XEN-XEN), and the heterophilic boundary interface in yellow. Angles formed at tricellular junctions between different types are indicated: EX, TX and ET, angles between heterotypic contacts (ES-XEN, TS-XEN and ES-TS); EE, TT and XX, angles between homotypic contacts (ES-ES, TS-TS and XEN-XEN). XXi indicates contact angles of XEN cells at cell-medium interface. Experiments were repeated 6 times. Scale bar represents 20 μm. (e) E-cadherin and P-cadherin mRNA expression in cells after downregulation of E- or P-cadherin by RNAi, scrambled siRNA was used as a control. P-cadherin mRNA expression in ES cells after overexpression of P-cadherin. N = 4 for all conditions. Data are presented as mean ± SD. Statistics calculated by unpaired two-tailed Student’s t test. Source numerical data are available in source data. Source data
Extended Data Fig. 3
Extended Data Fig. 3. Differential cadherin code and cortical tension regulate self-organization in ETX embryos.
(a) Time course of formation of correctly-sorted ETX embryos following seeding. 0.5-h: 0/515 structures; 12-h: 79/1292 structures; 24-h: 160/1074 structures; 48-h: 134/888; 72-h: 93/702 structures. N = 3 for each condition. Data are presented as Mean ± SD. Statistics calculated by unpaired two-tailed Student’s t test. (b) Live cell imaging and tracking. H2B-RFP-XEN (green), H2B-CFP-ES (red) and EGFP-TS (blue) were overlaid with Imaris cell-tracking spheres. (c) Quantification of mobility for different types of cells during self-organization. Data are presented as Mean ± SD at different time points. (d) The bar graph shows the average mobility for different cell types during self-organization at different time ranges after cell seeding. Data are presented as Mean ± SEM. 12 structures from 3 independent experiments were imaged for quantification. Statistics calculated by unpaired two-tailed Student’s t test. (e) Examples of structures made from low (control) and high number of XEN cells, stained at day-1 and day-3. Experiments were repeated 3 times. Scale bar, 10 μm. (f) Schematic of morphological transitions when using low and high number of XEN cells. (g) Cortical stiffness measurements for indicated cell types before and after treatment with Blebbistatin (Bleb). Total measured cell numbers for each condition: ES: n = 58; ES + Bleb: n = 34; TS: n = 68; TS + Bleb: n = 31; XEN: n = 68; XEN + Bleb: n = 35. Data are presented as Mean ± SD. Statistics calculated by ANOVA with a multiple comparison test. (h) Day 3 well-sorted ETX embryos were cultured with either blebbistatin, cytochalasin D or DMSO (control) during consolidation stage for 24 hrs and immuno-stained to reveal the indicated markers. Quantification shows the percentage of disorganized ETX structures. n = 84 (Bleb treated), n = 83 (Cyto D treated) and n = 75 (control), N = 3 for each condition. Data are presented as Mean ± SD. Statistics calculated by unpaired two-tailed Student’s t test. Scale bar, 100 μm. (i) CPM modelling shows the effect of XEN cell stiffness (λP) on externalization efficiency (N = 474). The sorting efficiency calculated for each time-point is plotted as a heat-map, overlayed with contours (white dotted lines). Source numerical data are available in source data. Source data
Extended Data Fig. 4
Extended Data Fig. 4. Cadherin heterogeneity within the same cell population in ETX embryos.
(a) Pie charts show different mis-sorted ETX embryos under the indicated conditions. n = 4186 (control), n = 2940 (Cdh1-KD ES), n = 2471 (Cdh3-KD ES), n = 2407 (Cdh1-KD TS), n = 2151 (Cdh3-KD TS) structures were collected from 3 independent experiments for quantification. (b) Immuno-staining of ES (upper) and TS (lower) cells to reveal E-cadherin (green) and P-cadherin (red), respectively. Nuclei (purple) are stained by DAPI. Scale bars represent 100 μm. Zoomed images are of regions indicated by dashed lines. Experiments were repeated 5 times. (c) Flow cytometric analysis of E-cadherin in wild-type ES cells, E-cadherin knockdown ES cells and ES cells over-expressing E-cadherin (upper). Flow-cytometric analysis of P-cadherin in wild-type TS cells, P-cadherin knockdown TS cells and TS cells over-expressing P-cadherin (lower). CV (coefficient of variation) values shown against peak values in plots. (d) Top: FACS profiles for E-cadherin in E-cadherin KD, WT and E-cadherin OE ES cells, Bottom: FACS profiles for P-cadherin in P-cadherin KD, WT and P-cadherin OE TS cells. Source data
Extended Data Fig. 5
Extended Data Fig. 5. Cadherin heterogeneity affects cell positioning in ETX embryos.
(a) Schematics and representative images for assembled day 4 ETX-embryos from TS cells (upper) or (b) ES cells (lower) overexpressing (OE) or knocked-down (KD) for the indicated cadherins. Experiments were repeated 6 times. Scale bar represents 100 μm. P-cadherin-overexpressing TS cells and E-cadherin-overexpressing ES cells were pre-stained with Hoechst to distinguish them from cadherin knockdown cells. Scale bar represents 40 μm in zoomed panels. (c) Examples of structures made from E-cadherin-OE-ES, P-cadherin-OE-TS and XEN cells, stained at different time points to reveal ES cells (Oct4, red), TS cells (Tfap2c, blue) and XEN cells (Gata4, green). Scale bar represents 100 μm. (d) Quantification shows time course of formation of correctly-sorted ETX embryos following seeding. Control: 12 h: 24/332 structures; 24 h: 83/531 structures; 48 h: 71/448 structures; 72 h: 51/378 structures. Cadherin OE: 12 h: 80/276 structures; 24 h: 139/385 structures; 48 h: 136/374 structures; 72-h: 151/455 structures. N = 3 for all conditions. Data are presented as Mean ± SD. Statistics calculated by unpaired two-tailed Student’s t test. P values indicate significance between control and Cadherin OE ETX at the same time point. Source numerical data are available in source data. Source data
Extended Data Fig. 6
Extended Data Fig. 6. Correct cell sorting and self-organization is necessary for proper morphogenesis.
(a) Comparison and quantification of cavity formation in structures containing mis-sorted ES or TS and (b) mis-sorted XEN cells. Well-sorted structures: n = 73; Mis-sorted ES structures: n = 103; Mis-sorted TS structures: n = 109. Mis-sorted XEN structures: n = 57. N = 3 for each condition. Scale bar, 100 μm. Statistics calculated by unpaired two-tailed Student’s t test. (c) The average length and (d) internal cavity size of Cadherin OE ETX and control ETX at different time points. 20 to 30 structures were collected at each time points. Data are presented as Mean ± SD. Statistics calculated by unpaired two-tailed Student’s t test. P values indicate significant difference between Cadherin OE and control ETX at the same time point. (e) Comparison and quantification of basement membrane formation in structures containing well-sorted and mis-sorted XEN. Well-sorted structures: n = 84; Mis-sorted XEN structures: n = 74. N = 3 for each condition. Data are presented as Mean ± SD. Statistics calculated by unpaired two-tailed Student’s t test. Scale bar, 100 μm. (f) Schematic image shows natural and ETX embryos use different routes to form the post-implantation embryos. In ETX embryos, lineage-specific stem cells bypass the blastocyst structure to directly assemble a post-implantation embryo. Source numerical data are available in source data. Source data

Similar articles

Cited by

References

    1. Tsai TY-C, et al. An adhesion code ensures robust pattern formation during tissue morphogenesis. Science. 2020;370:113–116. doi: 10.1126/science.aba6637. - DOI - PMC - PubMed
    1. Maître J-L, et al. Adhesion functions in cell sorting by mechanically coupling the cortices of adhering cells. Science. 2012;338:253–256. doi: 10.1126/science.1225399. - DOI - PubMed
    1. Wickström SA, Niessen CM. Cell adhesion and mechanics as drivers of tissue organization and differentiation: local cues for large scale organization. Curr. Opin. Cell Biol. 2018;54:89–97. doi: 10.1016/j.ceb.2018.05.003. - DOI - PubMed
    1. Pieters T, Van Roy F. Role of cell–cell adhesion complexes in embryonic stem cell biology. J. Cell Sci. 2014;127:2603–2613. doi: 10.1242/jcs.146720. - DOI - PubMed
    1. Fierro-González JC, White MD, Silva JC, Plachta N. Cadherin-dependent filopodia control preimplantation embryo compaction. Nat. Cell Biol. 2013;15:1424–1433. doi: 10.1038/ncb2875. - DOI - PubMed

Publication types