. 2022 Sep 13;79(10):515.
doi: 10.1007/s00018-022-04547-0.

Perilipin-2 limits remyelination by preventing lipid droplet degradation

Affiliations

Perilipin-2 limits remyelination by preventing lipid droplet degradation

Melanie Loix et al. Cell Mol Life Sci. .

Abstract

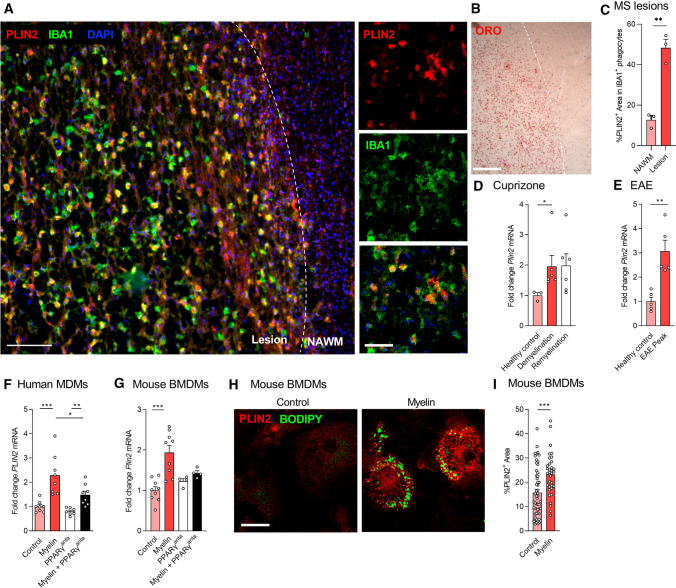
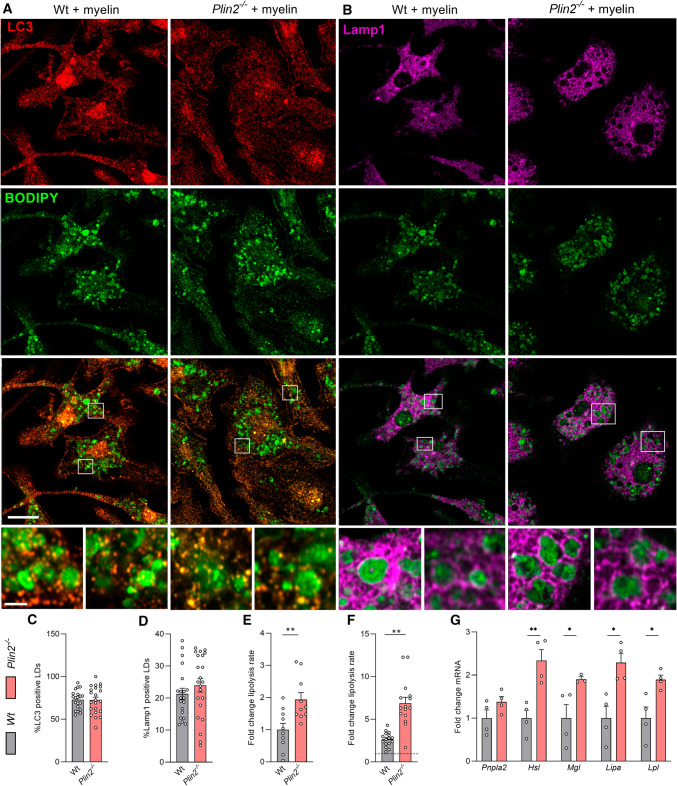
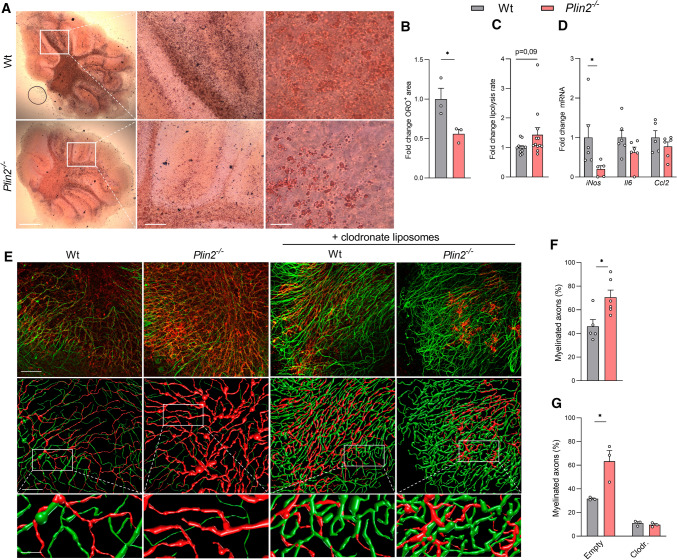
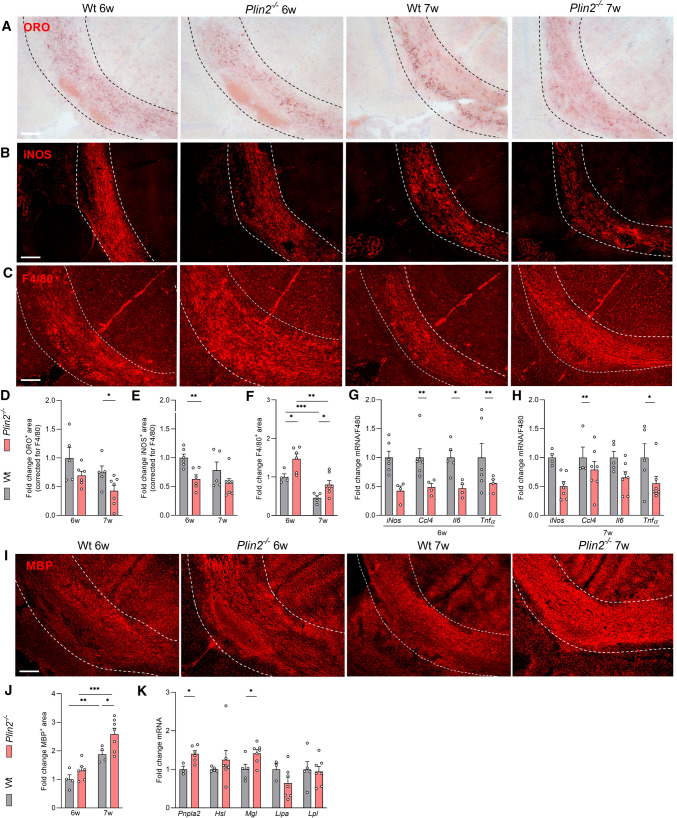
Foamy macrophages and microglia containing lipid droplets (LDs) are a pathological hallmark of demyelinating disorders affecting the central nervous system (CNS). We and others showed that excessive accumulation of intracellular lipids drives these phagocytes towards a more inflammatory phenotype, thereby limiting CNS repair. To date, however, the mechanisms underlying LD biogenesis and breakdown in lipid-engorged phagocytes in the CNS, as well as their impact on foamy phagocyte biology and lesion progression, remain poorly understood. Here, we provide evidence that LD-associated protein perilipin-2 (PLIN2) controls LD metabolism in myelin-containing phagocytes. We show that PLIN2 protects LDs from lipolysis-mediated degradation, thereby impairing intracellular processing of myelin-derived lipids in phagocytes. Accordingly, loss of Plin2 stimulates LD turnover in foamy phagocytes, driving them towards a less inflammatory phenotype. Importantly, Plin2-deficiency markedly improves remyelination in the ex vivo brain slice model and in the in vivo cuprizone-induced demyelination model. In summary, we identify PLIN2 as a novel therapeutic target to prevent the pathogenic accumulation of LDs in foamy phagocytes and to stimulate remyelination.

Keywords: Foamy macrophages; Inflammation; Lipid droplet associated protein; Lipolysis; Lipophagy.


Conflict of interest statement

The authors declare no competing interests exist.

Figures

Fig. 1
Fig. 1
Myelin internalization increases PLIN2 in phagocytes in a PPARγ-dependent manner. A Representative image of active demyelinating multiple sclerosis (MS) lesion stained for PLIN2 (red) and IBA1 (green) (n = 3 lesions from 3 different MS patients). Nuclei were stained using DAPI (blue). Scale bars: 200 µm, 50 µm. B Representative image of oil red O staining of an active MS lesion. Scale bar: 300 µm. C Quantitative analysis of the %PLIN2+ area in IBA1+ phagocytes in normal-appearing white matter (NAWM) and active demyelinating lesions (n = 3 lesions from 3 different MS patients). D Plin2 mRNA in healthy animals, animals sacrificed after 6 weeks of cuprizone diet (demyelination), and animals sacrificed after 6 weeks of cuprizone diet plus one week of normal chow (remyelination) (n = 3–6 mice). E Plin2 mRNA in spinal cord tissue of healthy and experimental autoimmune encephalitis (EAE) animals sacrificed at the peak stage of the disease (n = 5 mice). F, G PLIN2 mRNA in human monocyte-derived macrophages (MDMs, n = 8 wells) and murine bone marrow-derived macrophages (BMDMs, n = 5 wells) pre-incubated with the PPARγ antagonist (GW9662, 5 µM) followed by myelin treatment (50 µg/ml) for 24 h (n = 4–8 wells). Representative images (H) and quantification (I) of BMDMs treated with myelin (50 µg/ml) for 24 h and stained for PLIN2 (red) and BODIPY (green). Scale bar: 10 µm. (n =  > 35 cells, data pooled from 3 experiments). Data are represented as mean ± SEM. *P ≤ 0.05, **P ≤ 0.01 and ***P ≤ 0.001
Fig. 2
Fig. 2
Increased LD degradation and lipid efflux in Plin2-deficient foamy macrophages. A Schematic overview of the experimental set-up. Wild-type (Wt) and Plin2−/− bone marrow-derived macrophages (BMDMs) were stimulated with 50 µg/ml myelin for 24 h (Lipid droplet (LD) formation) followed by the addition of fresh medium for 24 h (LD degradation). Representative images of Oil red O (ORO) (B) and BODIPY (C) staining (n = 5–6 wells). Scale bars: 20 µm (ORO, B) and 10 µm (BODIPY, C). Relative amount of ORO+ (D) and BODIPY+ (E) LDs (n = 3 wells). F Quantification of ORO staining of Wt and Plin2−/− BMDMs stimulated with 50 µg/ml myelin followed by culture in myelin-free medium for 2, 4, 6, 8 or 24 h (n = 3 wells). G, H Free cholesterol (FC) and cholesterol ester (CE) concentration measured using Amplex Red Assay (n = 6). I, J Liquid chromatography electrospray ionization tandem mass spectrometry analysis of Wt and Plin2−/− BMDMs. Log2 fold change abundance of all lipid classes is shown (n = 4 mice). K Cholesterol efflux capacity of myelin-treated Plin2−/− BMDMs normalized to myelin-treated Wt BMDMs (n = 10). L Internalization of DiI-labeled myelin (n = 8 wells). Data are represented as mean ± SEM. *P ≤ 0.05, **P ≤ 0.01 and ****P ≤ 0.0001
Fig. 3
Fig. 3
Plin2-deficiency in myelin-loaded macrophages reduces the expression of pro-inflammatory mediators. mRNA expression of pro (A, B)- and anti (C)- inflammatory genes in wild-type (Wt) and Plin2−/− bone marrow-derived control (A) and foamy (B, C) macrophages (BMDMs) stimulated with IFNγ and IL1β (both 100 ng/ml) for 6 h (n = 6 wells). Dotted line represents control Wt and Plin2−/− BMDMs stimulated with IFNγ and IL1β. TNFα (D) and NO2 (E) concentration in the supernatant of Wt and Plin2−/− foamy BMDMs stimulated with IFNγ and IL1β (both 100 ng/ml) for 18 h (n = 8 wells). Data are represented as mean ± SEM. *P ≤ 0.05, ***P ≤ 0.001
Fig. 4
Fig. 4
Loss of Plin2 increases lipolysis in macrophages. A, B Representative images of immunofluorescence staining of wild-type (Wt) and Plin2−/− bone marrow-derived macrophages (BMDMs) treated with 50 µg/ml myelin for 24 h. BODIPY (green), LC3 (A, red, n = 3 wells), Lamp1 (B, magenta, n = 3 wells). Scale bar 10 µm, 2 µm. Average percentage of C LC3+ and D Lamp1+ lipid droplets (LDs) of the total amount of LDs. Glycerol concentration was measured in Wt and Plin2−/− (E) control and (F) foamy BMDMs cultured in the presence of myelin-free medium for 24 h. Results are normalized for the amount of LDs and compared to untreated genotype controls (F, dotted line, n = 3 wells). G mRNA expression of lipase genes in Wt and Plin2−/− BMDMs (n = 4 wells). All data are represented as mean ± SEM. *P < 0.05; **P < 0.01
Fig. 5
Fig. 5
Loss of Plin2 improves remyelination in ex vivo brain slice cultures. A, B Representative images and quantification of Oil Red O (ORO) staining of cerebellar brain slices (n = 3 slices). Scale bars 500 μm, 100 μm, 50 µm. C Relative glycerol concentration measured in supernatant of the brain slice cultures during remyelination (n = 6 wells). D mRNA expression of iNos, Il6, and Ccl2 in brain slices during remyelination (n = 6 slices). E Representative immunofluorescence images (top) and three-dimensional reconstructions (bottom) of brain slices stimulated with or without clodronate liposomes (0.5 mg/ml). Scale bars 150 µm, 150 µm, 50 µm. F, G MBP+NF+ axons of total NF+ axons in wild-type and Plin2−/− slices stimulated with empty or clodronate (Clodr.) liposomes (G), or unstimulated (F) (n = 3–6 slices). All data are represented as mean ± SEM. *P < 0.05
Fig. 6
Fig. 6
Plin2-deficiency stimulates remyelination in the cuprizone model. Wild-type (Wt) and Plin2−/− mice were fed a cuprizone diet for 6 weeks to induce demyelination in the corpus callosum (CC). Upon withdrawal of the cuprizone diet, spontaneous remyelination ensues. Tissue was collected after demyelination (6w) and after 1 week of recovery (7w). Representative images and quantification of Oil Red O (ORO) (A, D), immunofluorescence iNOS (B, E), and F4/80 (C, F) staining of the CC (scale bar 100 µm, n = 4–7 mice). G, H mRNA expression of inflammatory mediators in the CC (n = 4–6 mice). Representative images (I) and quantification (J) of myelin basic protein (MBP) staining of the CC (scale bar 100 µm, n = 4–7 mice). K mRNA expression of lipase genes in the CC during remyelination (n = 3–7 mice). All data are represented as mean ± SEM. *P < 0.05; **P < 0.01; ***P < 0.001

References

    1. Grajchen E, Hendriks JJA, Bogie JFJ (2018) The physiology of foamy phagocytes in multiple sclerosis. Acta Neuropathol Commun 6(1):124 - PMC - PubMed
    1. Bogie J et al (2011) Myelin-phagocytosing macrophages modulate autoreactive T cell proliferation. J Neuroinflamm 8(1):85 - PMC - PubMed
    1. Bogie JF et al (2012) Myelin-derived lipids modulate macrophage activity by liver X receptor activation. PLoS ONE 7(9):e44998 - PMC - PubMed
    1. Bogie JF et al (2013) Myelin alters the inflammatory phenotype of macrophages by activating PPARs. Acta Neuropathol Commun 1:43 - PMC - PubMed
    1. Bogie JFJ et al (2020) Stearoyl-CoA desaturase-1 impairs the reparative properties of macrophages and microglia in the brain. J Exp Med 217(5):e20191660 - PMC - PubMed

LinkOut - more resources