. 2023 Mar;44(3):670-679.
doi: 10.1038/s41401-022-00984-6. Epub 2022 Sep 13.

Involvement of cell shape and lipid metabolism in glioblastoma resistance to temozolomide

Affiliations

Involvement of cell shape and lipid metabolism in glioblastoma resistance to temozolomide

Munki Choo et al. Acta Pharmacol Sin. 2023 Mar.

Abstract

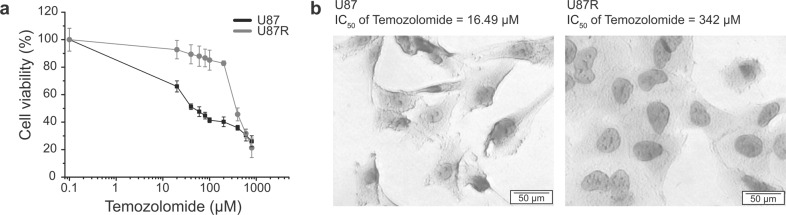
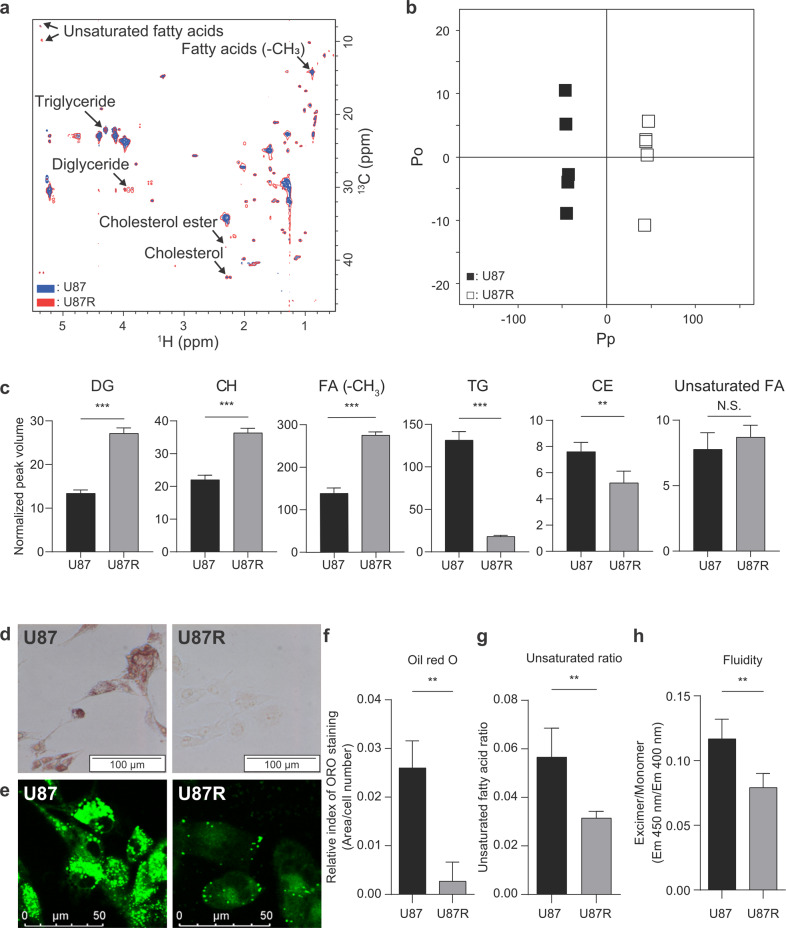
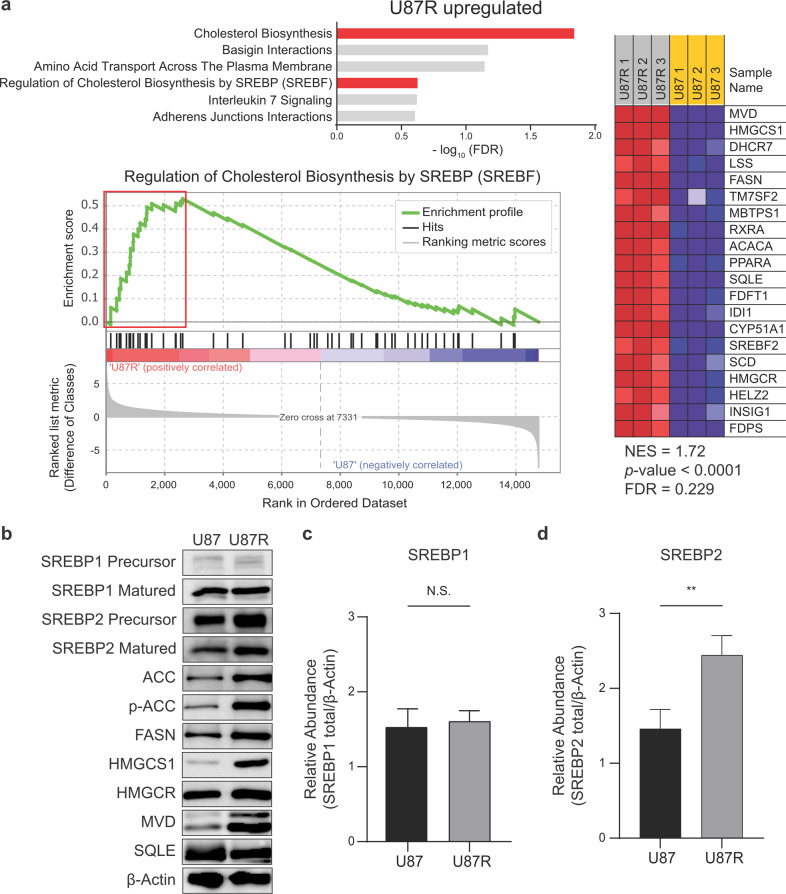
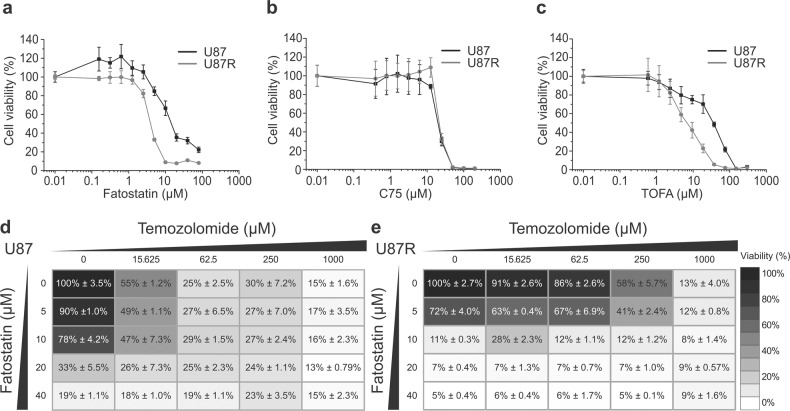
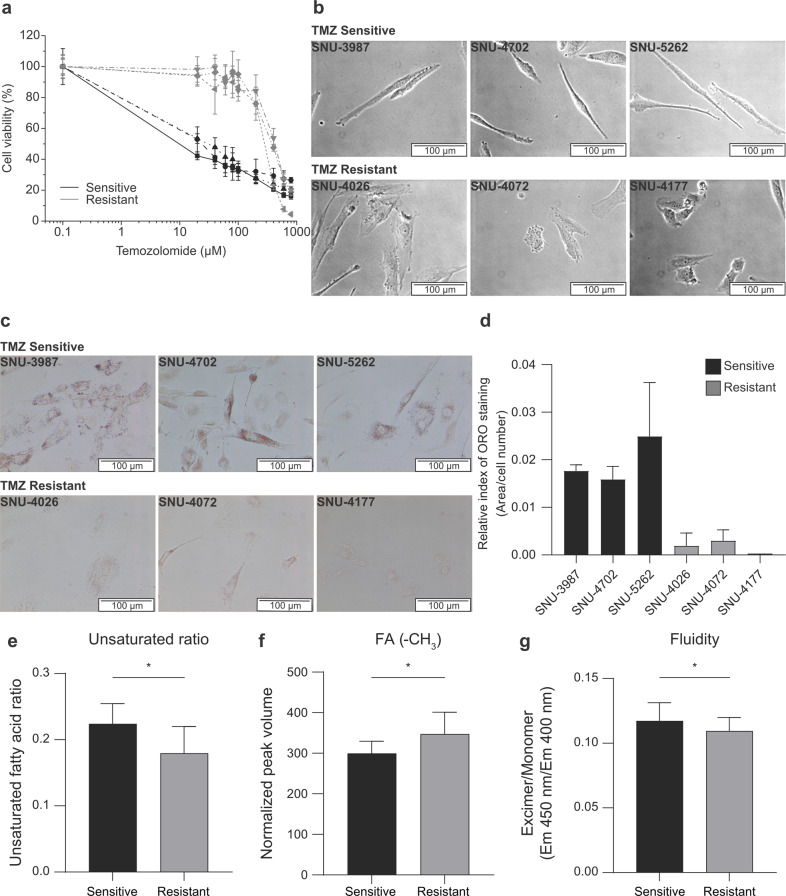
Temozolomide (TMZ) has been used as standard-of-care for glioblastoma multiforme (GBM), but the resistance to TMZ develops quickly and frequently. Thus, more studies are needed to elucidate the resistance mechanisms. In the current study, we investigated the relationship among the three important phenotypes, namely TMZ-resistance, cell shape and lipid metabolism, in GBM cells. We first observed the distinct difference in cell shapes between TMZ-sensitive (U87) and resistant (U87R) GBM cells. We then conducted NMR-based lipid metabolomics, which revealed a significant increase in cholesterol and fatty acid synthesis as well as lower lipid unsaturation in U87R cells. Consistent with the lipid changes, U87R cells exhibited significantly lower membrane fluidity. The transcriptomic analysis demonstrated that lipid synthesis pathways through SREBP were upregulated in U87R cells, which was confirmed at the protein level. Fatostatin, an SREBP inhibitor, and other lipid pathway inhibitors (C75, TOFA) exhibited similar or more potent inhibition on U87R cells compared to sensitive U87 cells. The lower lipid unsaturation ratio, membrane fluidity and higher fatostatin sensitivity were all recapitulated in patient-derived TMZ-resistant primary cells. The observed ternary relationship among cell shape, lipid composition, and TMZ-resistance may be applicable to other drug-resistance cases. SREBP and fatostatin are suggested as a promising target-therapeutic agent pair for drug-resistant glioblastoma.

Keywords: SREBP; cell shape; fatostatin; glioblastoma; lipid metabolism; temozolomide resistance.


Conflict of interest statement

The authors declare no competing interests.

Figures

Fig. 1
Fig. 1. The morphology of glioblastoma cell lines according to drug sensitivity.
a Dose-response curves of U87 (black) and U87-temozolomide resistant (U87R, gray) cells after 5-day incubation with the temozolomide, as determined by CCK-based assay. Error bars represent standard deviations. b The morphology difference between drug sensitive and resistance cell line observed with light microscopy. Cells were stained with Hematoxylin. U87 cells (left) and U87R cells (right).
Fig. 2
Fig. 2. NMR-based lipid metabolomics and lipid phenotypes of U87 and U87R cells.
a HSQC spectra of lipid extracts from U87 and U87R cells after overnight labeling with [U-13C]glucose. U87 (blue) and U87R (red) spectra are overlaid. Key lipid species are labeled (see Supplementary Table S1). b OPLS-DA score plot for the lipidomic results showing the discrimination between U87 and U87R cells. The model was obtained using one predictive and one orthogonal components. U87: filled boxes, U87R: open boxes. Pp represents the predictive component and Po represents the orthogonal component. c Levels of key lipid species in U87 and U87R cells. The levels were determined by the mean peak volumes normalized by the total volume from the HSQC spectra (a) (n = 5). ORO (d) and BODIPY (e) staining of glioblastoma cell lines. Images were acquired by light microscopy and fluorescence microscopy, respectively. f Quantitation of ORO staining in d with ImageJ software. The staining levels were normalized against cell numbers (n = 3). g Fatty acid unsaturation ratio. The values were obtained by dividing the peak volumes of unsaturated FA peak (1H = 5.35 ppm, 13C = 9.81 ppm) to those of total FA peak (1H = 0.88 ppm, 13C = 14.27 ppm) from the peak volumes of HSQC spectra (a). h Membrane fluidity of glioblastoma cell lines measured by the ratio of the fluorescence of pyrene excimer (Ex/Em = 360/450 nm) to monomer (Ex/Em = 360/400 nm) (n = 6). All statistical analysis was performed using the unpaired t-test, and the resulting P values are *P < 0.05, **P < 0.01, ***P < 0.001 and N.S. not significant. Error bars represent standard deviations.
Fig. 3
Fig. 3. Microarray and protein analysis on lipid-related pathways in glioblastoma cell lines.
a Enrichment of the lipid synthesis pathway and its leading-edge genes. Top 6 upregulated pathways in U87R according to the FDR values by GSEA analysis on gene expressions related to lipid synthesis in U87 and U87R cells (upper). Enrichment plot from GSEA analysis for the “Regulation of Cholesterol Biosynthesis by SREBP” pathway from the microarray data (left). GSEA-derived heat maps of leading-edge genes in the red box on the left (right). b Protein level of lipid-related pathway in U87 and U87R cells. Beta-actin (β-Actin) was used as a loading control. Relative quantitation of SREBP1 (c) and SREBP2 (d) levels normalized to β-Actin from b (n = 3). Statistics are as in Fig. 2.
Fig. 4
Fig. 4. Sensitivity of glioblastoma cell lines to drugs that inhibit lipid synthesis.
Dose-response curves of U87 (black) and U87R (gray) cells after 5-day incubation with fatostatin (a), C75 (b), and TOFA (c), as determined with CCK-based cell viability assay. Error bars represent standard deviations (n = 4). Heatmaps of the raw dose-response landscape upon the combination treatment with TMZ and fatostatin on U87 (d) and U87R (e) cells. The numbers represent percent viability with standard deviations.
Fig. 5
Fig. 5. TMZ sensitivity-lipid-cell shape relationship in patient-derived primary glioblastoma cells.
a Dose-response curves of TMZ-sensitive (black) and TMZ-resistant primary cells (gray) cells after 5-day incubation with TMZ, as determined with CCK-based cell viability assay. b Cell shapes of TMZ-sensitive (upper) and TMZ-resistant primary cells (lower) were acquired by light microscopy. c ORO staining of TMZ-sensitive (upper) and TMZ-resistant primary cells (lower). Images were acquired by light microscopy. d Quantitation of ORO staining in c with ImageJ software. The staining levels were normalized against cell numbers (n = 3). e FA unsaturation ratio for patient-derived primary cells, obtained as in Fig. 2g. f Total FA levels determined by the mean peak volumes normalized by the total peak volumes from the HSQC spectra. g Membrane fluidity of primary glioblastoma cells measured by the ratio of the fluorescence of pyrene excimer (Ex/Em = 360/450 nm) to monomer (Ex/Em = 360/400 nm) (n = 9). Statistics are as in Fig. 2.

Similar articles

Cited by

References

    1. Thakkar JP, Dolecek TA, Horbinski C, Ostrom QT, Lightner DD, Barnholtz-Sloan JS, et al. Epidemiologic and molecular prognostic review of glioblastoma. Cancer Epidemiol Biomark Prev. 2014;23:1985–96. doi: 10.1158/1055-9965.EPI-14-0275. - DOI - PMC - PubMed
    1. Allen BG, Bodeker KL, Smith MC, Monga V, Sandhu S, Hohl R, et al. First-in-human phase I clinical trial of pharmacologic ascorbate combined with radiation and temozolomide for newly diagnosed glioblastoma. Clin Cancer Res. 2019;25:6590–7. doi: 10.1158/1078-0432.CCR-19-0594. - DOI - PMC - PubMed
    1. Chen B, Chen C, Zhang Y, Xu J. Recent incidence trend of elderly patients with glioblastoma in the United States, 2000–2017. BMC Cancer. 2021;21:54. doi: 10.1186/s12885-020-07778-1. - DOI - PMC - PubMed
    1. Oike T, Suzuki Y, Sugawara K-I, Shirai K, Noda S-E, Tamaki T, et al. Radiotherapy plus concomitant adjuvant temozolomide for glioblastoma: Japanese mono-institutional results. PLoS One. 2013;8:e78943. doi: 10.1371/journal.pone.0078943. - DOI - PMC - PubMed
    1. Al-Husseini MJ, Saad AM, El-Shewy KM, Nissan NE, Gad MM, Alzuabi MA, et al. Prior malignancy impact on survival outcomes of glioblastoma multiforme; population-based study. Int J Neurosci. 2019;129:447–54. doi: 10.1080/00207454.2018.1538989. - DOI - PubMed