Case Reports
. 2022 Sep 13;23(1):374.
doi: 10.1186/s12859-022-04895-5.

Transforming L1000 profiles to RNA-seq-like profiles with deep learning

Affiliations
Case Reports

Transforming L1000 profiles to RNA-seq-like profiles with deep learning

Minji Jeon et al. BMC Bioinformatics. .

Abstract

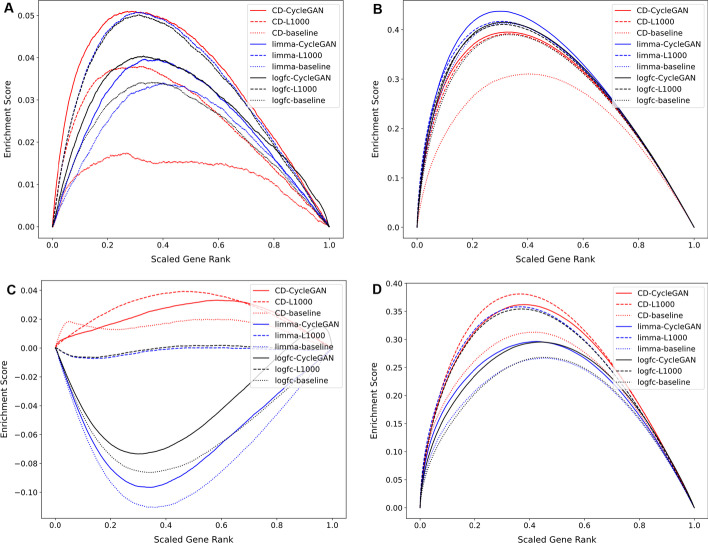
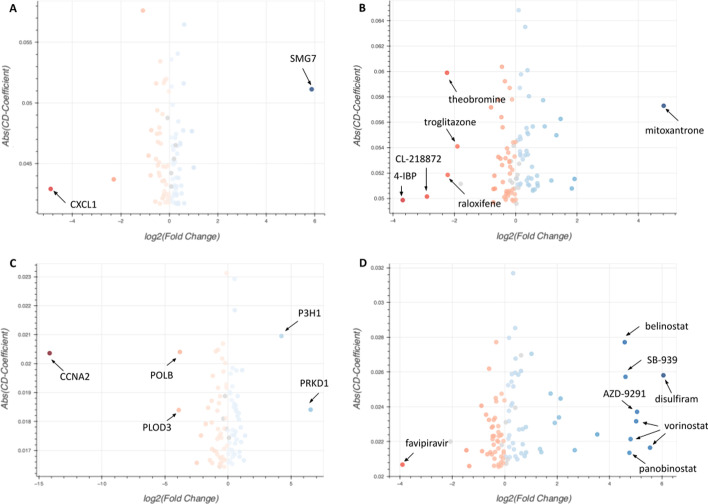
The L1000 technology, a cost-effective high-throughput transcriptomics technology, has been applied to profile a collection of human cell lines for their gene expression response to > 30,000 chemical and genetic perturbations. In total, there are currently over 3 million available L1000 profiles. Such a dataset is invaluable for the discovery of drug and target candidates and for inferring mechanisms of action for small molecules. The L1000 assay only measures the mRNA expression of 978 landmark genes while 11,350 additional genes are computationally reliably inferred. The lack of full genome coverage limits knowledge discovery for half of the human protein coding genes, and the potential for integration with other transcriptomics profiling data. Here we present a Deep Learning two-step model that transforms L1000 profiles to RNA-seq-like profiles. The input to the model are the measured 978 landmark genes while the output is a vector of 23,614 RNA-seq-like gene expression profiles. The model first transforms the landmark genes into RNA-seq-like 978 gene profiles using a modified CycleGAN model applied to unpaired data. The transformed 978 RNA-seq-like landmark genes are then extrapolated into the full genome space with a fully connected neural network model. The two-step model achieves 0.914 Pearson's correlation coefficients and 1.167 root mean square errors when tested on a published paired L1000/RNA-seq dataset produced by the LINCS and GTEx programs. The processed RNA-seq-like profiles are made available for download, signature search, and gene centric reverse search with unique case studies.

Keywords: Gene expression translation; Generative adversarial networks; L1000; RNA-seq.


Conflict of interest statement

The authors declare no competing interests.

Figures

Fig. 1
Fig. 1
Model architecture. G and F are generators, DY and DX are discriminators, and is a fully connected neural network model for RNA-seq profile extrapolation from landmark genes to the full genome. The pipeline inputs are measured expression of 978 landmark genes from L1000 profiles. The CycleGAN model in the pipeline predicts RNA-seq-like profiles for given L1000 profiles. The extrapolation model inputs are 978-dimensional vectors of predicted RNA-seq-like profiles. The model then predicts 23,614-dimensional vectors of RNA-seq-like profiles
Fig. 2
Fig. 2
Training progress over epochs. A Loss curve during the training of the generator of the cycleGAN. B Loss curve during the training of the discriminator of the cycleGAN
Fig. 3
Fig. 3
Comparing similarity between predicted and real profiles at the 978-landmark space (A, B). Violin plots of sample-wise Pearson’s correlation coefficients (PCCs) (A) and RSME (B) between predicted and real RNA-seq profiles (blue); between predicted by a baseline model and real RNA-seq profiles (orange); input L1000 signatures and predicted RNA-seq-like profiles (green); input L1000 and real RNA-seq profiles (red); and between predicted RNA-seq profiles and randomly paired real RNA-seq profiles (purple). Comparing similarity between predicted and real profiles at the full genome space (C, D). Violin plots of sample-wise Pearson’s correlation coefficients (C) and RSMEs (D) between predicted and real RNA-seq profiles (blue), between predicted RNA-seq profiles and randomly paired real RNA-seq profiles (orange), and between real RNA-seq profiles and randomly paired real RNA-seq profiles (green). Comparing similarity between predicted and real profiles at the gene level in the full genome space (E, F). Violin plots of gene-wise PCCs (E) and RSMEs (F) between predicted and real RNA-seq profiles (blue), between predicted RNA-seq profiles and randomly paired real RNA-seq profiles (orange), and between real RNA-seq profiles and randomly paired real RNA-seq profiles (green)
Fig. 4
Fig. 4
Sample visualization in reduced space. PCA plot of the real GTEx RNA-seq profiles from transverse colon (red), the predicted RNA-seq-like profiles (orange), and the original L1000 profiles (blue). The 84 samples are from post-mortem transverse colon collected for the GTEx program. The gene space is the common 11,780 genes
Fig. 5
Fig. 5
Benchmarking dexamethasone gene expression signatures with bridge plots that visualize the recovery of targets of NR3C1 as determined by ChIP-seq, given dexamethasone signatures. Signatures created from the predicted RNA-seq-like profiles are compared to the originally published L1000 signatures using only the common 11,780 genes. Unweighted walk plots comparing ranked genes from the signatures with NR3C1 target genes assembled from ChEA (A) and ENCODE (C). The same signatures are compared with weighted walks by the absolute differential expression value for each gene, normalized to fit in the range between 0 to 1 for ChIP-seq targets from (B) ChEA and (D) ENCODE
Fig. 6
Fig. 6
Bridge plot of dexamethasone signatures created from the predicted RNA-seq like profiles with all 23,614 genes (red) and 20 random signatures (gray) using the CD method. A–C Unweighted walk comparing ranked genes from the signatures with NR3C1 targets downloaded from ChEA (A) and ENCODE (C). B–D Weighted walk comparing the signatures weighted by the absolute value of the differential expression score for each gene, normalized to a value between 0 and 1 from NR3C1 target genes downloaded from ChEA (B) and ENCODE (D)
Fig. 7
Fig. 7
The RNA-seq-like Gene Centric Signature Reverse Search (RGCSRS) Appyter input form. The Appyter takes a query gene and a cell line and returns visualizations of the top RNA-seq signatures that up- or down-regulate the query gene
Fig. 8
Fig. 8
Volcano plots of signatures of CRISPR knockouts and chemical perturbagens that are predicted to up- or down-regulate SFRP2 (A, B) and LGI3 (C, D). The x-position indicates the log2(fold change) of the expression of the query gene in the CRISPR knockouts and chemical perturbagen signatures, while the y-position indicates the absolute CD coefficient of the gene. The plots highlight points with the same-direction fold change and CD coefficient values by coloring them blue (up-regulated) or red (down-regulated). Darker colored points indicate signatures where the query gene is differentially expressed with a larger absolute value of the CD-coefficient and fold change

Similar articles

Cited by

References

    1. Lamb J, Crawford ED, Peck D, Modell JW, Blat IC, Wrobel MJ, Lerner J, Brunet J-P, Subramanian A, Ross KN, et al. The Connectivity Map: using gene-expression signatures to connect small molecules, genes, and disease. Science. 2006;313(5795):1929–1935. doi: 10.1126/science.1132939. - DOI - PubMed
    1. Subramanian A, Narayan R, Corsello SM, Peck DD, Natoli TE, Lu X, Gould J, Davis JF, Tubelli AA, Asiedu JK, et al. A next generation connectivity map: L1000 platform and the first 1,000,000 profiles. Cell. 2017;171(6):1437–1452.e1417. doi: 10.1016/j.cell.2017.10.049. - DOI - PMC - PubMed
    1. Zhu J-Y, Park T, Isola P, Efros AA. Unpaired image-to-image translation using cycle-consistent adversarial networks. In: 2017 IEEE International Conference on Computer Vision (ICCV) 2017.
    1. Goodfellow IJ, Pouget-Abadie J, Mirza M, Xu B, Warde-Farley D, Ozair S, Courville A, Bengio Y. Generative adversarial networks. arXiv [statML] 2014.
    1. Wang X, Ghasedi Dizaji K, Huang H. Conditional generative adversarial network for gene expression inference. Bioinformatics. 2018;34(17):i603–i611. doi: 10.1093/bioinformatics/bty563. - DOI - PMC - PubMed

Publication types

LinkOut - more resources