Review
. 2022 Jul 6;11(7):1019.
doi: 10.3390/biology11071019.

Approaches in Gene Coexpression Analysis in Eukaryotes

Affiliations
Review

Approaches in Gene Coexpression Analysis in Eukaryotes

Vasileios L Zogopoulos et al. Biology (Basel). .

Abstract

Gene coexpression analysis constitutes a widely used practice for gene partner identification and gene function prediction, consisting of many intricate procedures. The analysis begins with the collection of primary transcriptomic data and their preprocessing, continues with the calculation of the similarity between genes based on their expression values in the selected sample dataset and results in the construction and visualisation of a gene coexpression network (GCN) and its evaluation using biological term enrichment analysis. As gene coexpression analysis has been studied extensively, we present most parts of the methodology in a clear manner and the reasoning behind the selection of some of the techniques. In this review, we offer a comprehensive and comprehensible account of the steps required for performing a complete gene coexpression analysis in eukaryotic organisms. We comment on the use of RNA-Seq vs. microarrays, as well as the best practices for GCN construction. Furthermore, we recount the most popular webtools and standalone applications performing gene coexpression analysis, with details on their methods, features and outputs.

Keywords: RNA-Seq; gene coexpression networks; microarrays; systems biology; transcriptomics; webtool.


Conflict of interest statement

The authors declare no conflict of interest.

Figures

Figure 1
Figure 1
Pre-processing procedure for transcriptomic data. Primary microarray data are procured in a CEL format which is transformed to gene expression values by using a normalisation algorithm which is guided by a Chip Description File (CDF). In RNA-Seq primary data pre-processing, the FASTQ-formatted sequence read data are trimmed, then aligned to a reference genome. Gene counts are produced with the help of a General Feature Format (GFF) file. GFF file may also be used during alignment. Expression values are produced through normalisation. Both technologies eventually converge to the production of the same output, an expression matrix which contains the expressions of each gene in all samples.
Figure 2
Figure 2
Flowchart depicting the steps for performing gene coexpression analysis using gene expression data. Gene pairwise correlations are calculated and regardless of the chosen correlation measure, correlation values need to be transformed to similarity values and then to adjacency values. Gene coexpression can be depicted as lists, dendrograms or networks. Eventually, the results of the coexpression analysis need to be evaluated through enrichment analysis.
Figure 3
Figure 3
Coexpression results of ATTED-II and COXPRESdb: (a) GCN of the top coexpressed partners to CTL2, found in the gene’s information page; (b) GCN of the top coexpressed gene partners to NRP1, found in the gene’s information page. Coloured circles refer to different KEGG pathways.
Figure 4
Figure 4
Coexpression results of ACT and HGCA2.0: (a) Default coexpression subtree in ACT using CTL2 as driver gene. The subtree contains nine genes (including the driver gene) and possesses five ancestral nodes; (b) Default coexpression subtree in HGCA2.0 using NRP1 as driver gene. The subtree contains 34 genes (including the driver gene) and possesses five ancestral nodes.
Figure 5
Figure 5
GCN of ten coexpressed partners to CTL2 in CorNet, visualised through Cytoscape. The GCN includes the coexpression inter-relationships.
Figure 6
Figure 6
Coexpression gene list in ARCHS4. The full list corresponds to the top 100 coexpressed genes to NRP1, with only the top ten being presented.
Figure 7
Figure 7
Enrichment analysis results depicted as a word cloud produced by MEM. The resulting biological terms are derived using the top 50 coexpressed genes to NRP1 in MEM. Some terms and names may be clipped. Nevertheless, full term names can be found in an accompanying table below the word cloud in the MEM webpage.
Figure 8
Figure 8
GeneMANIA-produced GCN using Homo sapiens NRP1 as driver gene. Only coexpression relationships were used, with the rest of the settings being the default ones.
Figure 9
Figure 9
Output of positive coexpression analysis in Genevestigator with CTL2 as driver gene. The “anatomy” sample dataset is used and the cut-offs of the inter-relationships of coexpressed genes are set to the default values.
Figure 10
Figure 10
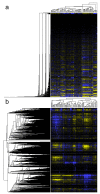
NCBI GEO Biclustering of samples and genes of GDS4562. Multiple biclusters of genes and samples of interest may be exported, plotted or linked to the corresponding entries of GEO Profiles. UPGMA clustering is performed using: (a) Euclidean distance; (b) Pearson correlation.

References

    1. Schneider M.V., Orchard S. Omics Technologies, Data and Bioinformatics Principles. In: Mayer B., editor. Bioinformatics for Omics Data: Methods and Protocols. Humana Press; Totowa, NJ, USA: 2011. pp. 3–30. - PubMed
    1. Barabasi A.L., Oltvai Z.N. Network biology: Understanding the cell’s functional organization. Nat. Rev. Genet. 2004;5:101–113. doi: 10.1038/nrg1272. - DOI - PubMed
    1. Usadel B., Obayashi T., Mutwil M., Giorgi F.M., Bassel G.W., Tanimoto M., Chow A., Steinhauser D., Persson S., Provart N.J. Co-expression tools for plant biology: Opportunities for hypothesis generation and caveats. Plant Cell Environ. 2009;32:1633–1651. doi: 10.1111/j.1365-3040.2009.02040.x. - DOI - PubMed
    1. Emamjomeh A., Saboori Robat E., Zahiri J., Solouki M., Khosravi P. Gene co-expression network reconstruction: A review on computational methods for inferring functional information from plant-based expression data. Plant Biotechnol. Rep. 2017;11:71–86. doi: 10.1007/s11816-017-0433-z. - DOI
    1. Pavlopoulos G.A., Secrier M., Moschopoulos C.N., Soldatos T.G., Kossida S., Aerts J., Schneider R., Bagos P.G. Using graph theory to analyze biological networks. BioData Min. 2011;4:10. doi: 10.1186/1756-0381-4-10. - DOI - PMC - PubMed