. 2023 Jan;237(1):310-322.
doi: 10.1111/nph.18486. Epub 2022 Oct 5.

To stripe or not to stripe: the origin of a novel foliar pigmentation pattern in monkeyflowers (Mimulus)

Affiliations

To stripe or not to stripe: the origin of a novel foliar pigmentation pattern in monkeyflowers (Mimulus)

Amy M LaFountain et al. New Phytol. 2023 Jan.

Abstract

The origin of phenotypic novelty is one of the most challenging problems in evolutionary biology. Although genetic regulatory network rewiring or co-option has been widely recognised as a major contributor, in most cases how such genetic rewiring/co-option happens is completely unknown. We have studied a novel foliar pigmentation pattern that evolved recently in the monkeyflower species Mimulus verbenaceus. Through genome-wide association tests using wild-collected samples, experimental crosses of laboratory inbred lines, gene expression analyses, and functional assays, we identified an anthocyanin-activating R2R3-MYB gene, STRIPY, as the causal gene triggering the emergence of the discrete, mediolateral anthocyanin stripe in the M. verbenaceus leaf. Chemical mutagenesis revealed the existence of upstream activators and repressors that form a 'hidden' prepattern along the leaf proximodistal axis, potentiating the unique expression pattern of STRIPY. Population genomics analyses did not reveal signatures of positive selection, indicating that nonadaptive processes may be responsible for the establishment of this novel trait in the wild. This study demonstrates that the origin of phenotypic novelty requires at least two separate phases, potentiation and actualisation. The foliar stripe pattern of M. verbenaceus provides an excellent platform to probe the molecular details of both processes in future studies.

Keywords: R2R3-MYB; anthocyanin; genetic regulatory network (GRN); monkeyflowers (Mimulus); phenotypic novelty; pigmentation pattern.


Figures

Fig. 1.
Fig. 1.. Natural occurrence of the stripe phenotype in the WFT population in Sedona, AZ.
(a) Map depicting geographic distribution of M. verbenaceus populations (blue dots), provided by Guy Nesom. The WFT population is marked with a red dot and white star. (b, c) Photographs of wild M. verbenaceus plants with the non-striped phenotype (b) and striped phenotype (c; courtesy of Thomas H. Kent, FloraFinder.org).
Figure 2.
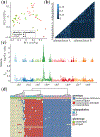
Figure 2.. Genomic analyses of the WFT population.
(a) Principal components analysis of sampled individuals. Shapes indicate that the samples originated from either subpopulation A (circles) or subpopulation B (triangles). Color indicates that the phenotype was either striped (pink) or non-striped (green). (b) Color-coded pairwise relatedness coefficients as calculated between all sampled individuals. (c) Manhattan plots depicting genome-wide association test conducted using ANGSD (top) and genome-wide FST calculated from SNP data using the Hudson estimator and summarized in 20kb windows (bottom). (d) Heatmap of genotypes in the STRIPY region from 50 SNPs most tightly associated with the phenotype. Colors indicate whether the site is homozygous for the reference (blue), homozygous for an alternate (red), or heterozygous (light yellow). Grey blocks indicate missing data.
Figure 3.
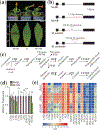
Figure 3.. Identification of the causal gene STRIPY.
(a) Photograph of whole plants (left panel) and leaves (right panel) from the MvBL and MvNB lines and their F1 cross. Scale bars represent 1 cm. (b) Schematic gene structure of STRIPY from MvBL, MvNB, M. parishii and M. cardinalis. Black bars represent exons and lines represent introns. (c) Simplified representation of the anthocyanin biosynthesis pathway. Abbreviations are as follows: chalcone synthase, CHS; chalcone isomerase, CHI; flavanone 3-hydroxylase, F3H; flavonoid 3’-hydroxylase, F3’H; dihydroflavonol reductase, DFR; anthocyanidin synthase, ANS; flavonoid 3-O-glucosyltransferase, UF3GT; flavonol synthase, FLS; flavone synthase, FNS. (d) qRT-PCR of anthocyanin biosynthesis genes and MBW components in 10 mm whole leaves from the MvBL (striped) and MvNB (non-striped) lines. MvUBC was used as a reference gene. Error bars represent 1SD of four biological replicates. Asterisks indicate differences between the two lines (*P < 0.05, **P < 0.01, based on Welch’s t-test). (e) Heatmap of normalized expression values from RNA-Seq of the proximal, stripe, and distal sections of 18–20 mm MvBL leaves. The division of sections is depicted in panel A.
Figure 4.
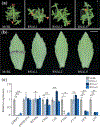
Figure 4.. RNAi knockdown of STRIPY.
(a) Photographs of whole plants of MvBL and three strong STRIPY RNAi lines. (b) Photographs of individual leaves. Scale bars represent 1 cm. (c) qRT-PCR analysis of anthocyanin regulatory and structural genes from 25 mm whole leaves. Error bars represent 1SD of three technical replicates. MvUBC was used as a reference gene. Asterisks indicate differences from the wild-type MvBL (*P < 0.05, **P < 0.01, based on Welch’s t-test). n.d.=not detected.
Figure 5.
Figure 5.. Chemically induced mutants with altered stripe patterning.
(a-g) Photographs of young MvBL (a) and mutant lines, as follows: (b) MV00087, (c) MV00103, (d) MV00504, (e) MV00191, (f) MV00203, (g) MV00552. Scale bars represent 1 cm. (h) Relative expression of STRIPY as measured by qRT-PCR of a pair of 15 mm whole leaves. Error bars represent 1SD of three technical replicates. Asterisks indicate differences from the wild-type MvBL (*P < 0.05, **P < 0.01, based on Welch’s t-test).
Figure 6.
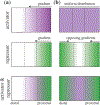
Figure 6.. Models depicting the hidden prepattern.
(a) Model for a one-gradient repressor system, in which both the activators (purple) and repressors (green) have a proximal-to-distal expression gradient; (b) Model for a two-gradient repressor system, in which two separate repressors diffuse from opposite ends of the leaf and the activator has a uniform distribution.

References

    1. Arnoult L, Su KFY, Manoel D, Minervino C, Magriña J, Gompel N, Prud’homme B. 2013. Emergence and diversification of fly pigmentation through evolution of a gene regulatory module. Science 339:1423–1426. - PubMed
    1. Barnett DW, Garrison EK, Quinlan AR, Strömberg MP, Marth GT. 2011. BamTools. Bioinformatics 27:1691–1692. - PMC - PubMed
    1. Beardsley PM, Yen A, Olmstead RG. 2003. AFLP phylogeny of Mimulus section Erythranthe and the evolution of hummingbird pollination. Evolution 57:1397–1410. - PubMed
    1. Berardi AE, Esfeld K, Jäggi L, Mandel T, Cannarozzi GM, Kuhlemeier C. 2021. Complex evolution of novel red floral color in Petunia. The Plant Cell 33:2273–2295. - PMC - PubMed
    1. Bhatia G, Patterson N, Sankararaman S, Price AL. 2013. Estimating and interpreting FST: the impact of rare variants. Genome Research 23:1514–1521. - PMC - PubMed

Publication types

LinkOut - more resources