. 2022 Sep 12:2:114.
doi: 10.1038/s43856-022-00178-5. eCollection 2022.

Early stimulated immune responses predict clinical disease severity in hospitalized COVID-19 patients

Affiliations

Early stimulated immune responses predict clinical disease severity in hospitalized COVID-19 patients

Rebecka Svanberg et al. Commun Med (Lond). .

Erratum in

Abstract

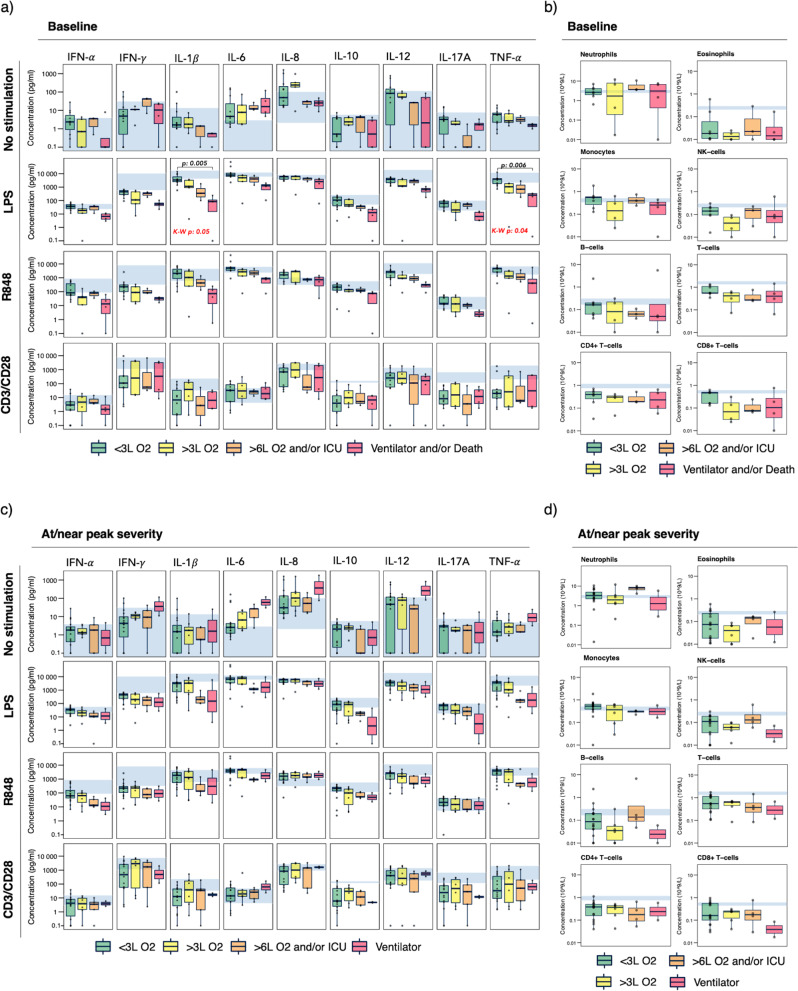
Background: The immune pathogenesis underlying the diverse clinical course of COVID-19 is poorly understood. Currently, there is an unmet need in daily clinical practice for early biomarkers and improved risk stratification tools to help identify and monitor COVID-19 patients at risk of severe disease.

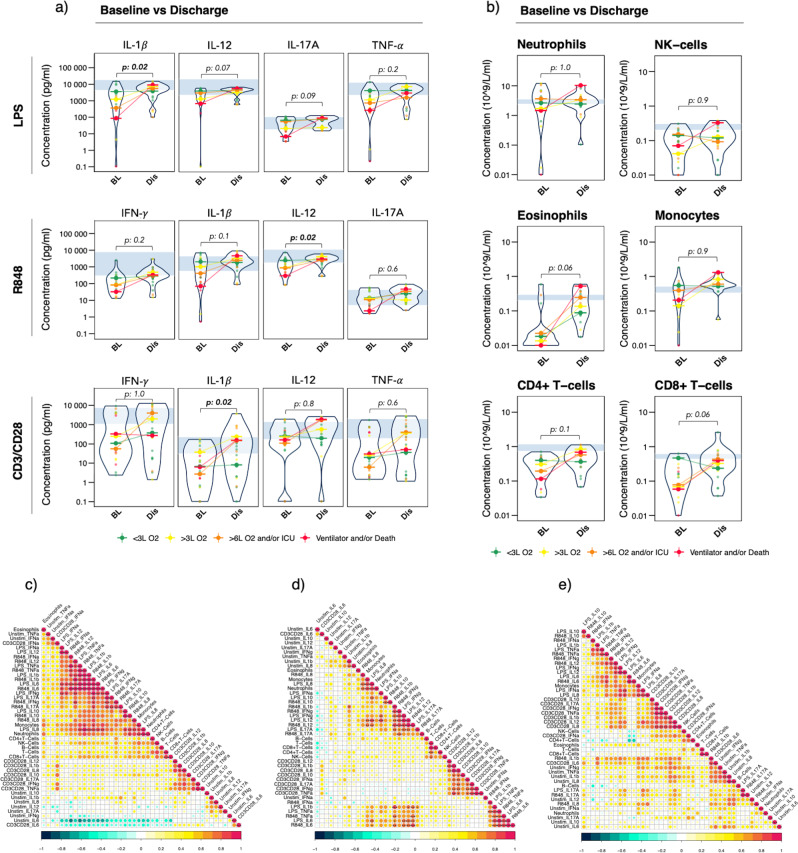
Methods: We performed longitudinal assessment of stimulated immune responses in 30 patients hospitalized with COVID-19. We used the TruCulture whole-blood ligand-stimulation assay applying standardized stimuli to activate distinct immune pathways, allowing quantification of cytokine responses. We further characterized immune cell subsets by flow cytometry and used this deep immunophenotyping data to map the course of clinical disease within and between patients.

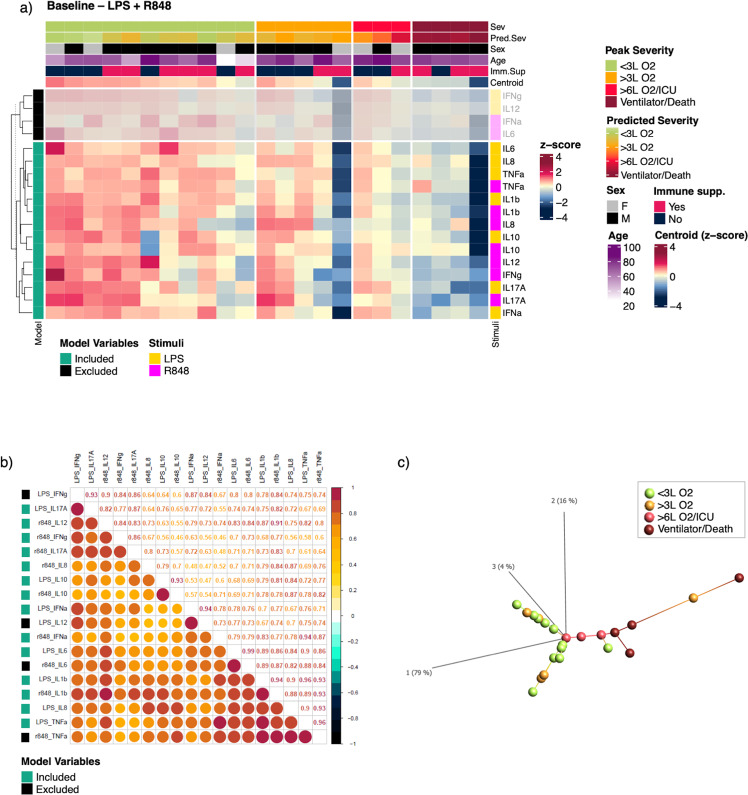
Results: Here we demonstrate impairments in innate immune response pathways at time of COVID-19 hospitalization that are associated with the development of severe disease. We show that these impairments are transient in those discharged from hospital, as illustrated by functional and cellular immune reconstitution. Specifically, we identify lower levels of LPS-stimulated IL-1β, and R848-stimulated IL-12 and IL-17A, at hospital admission to be significantly associated with increasing COVID-19 disease severity during hospitalization. Furthermore, we propose a stimulated immune response signature for predicting risk of developing severe or critical COVID-19 disease at time of hospitalization, to validate in larger cohorts.

Conclusions: We identify early impairments in innate immune responses that are associated with subsequent COVID-19 disease severity. Our findings provide basis for early identification of patients at risk of severe disease which may have significant implications for the early management of patients hospitalized with COVID-19.

Keywords: Innate immunity; Viral infection.


Conflict of interest statement

Competing interestsThe authors declare no competing interests.

Figures

Fig. 1
Fig. 1. The COVIMUN study design and clinical disease severity trajectories of patients hospitalized with COVID-19.
a Flow chart of the COVIMUN study setup. Patients hospitalized with COVID-19 were included in the study. Blood samples for immediate analysis by TruCulture and Flow Cytometry were collected upon hospital admission (baseline), day three, seven, and hereafter weekly until discharge or death. b The clinical disease trajectories of all patients in this cohort (n = 30). Day 0 represents the day of hospitalization due to COVID-19. The time of positive SARS-CoV-2 PCR test, and time of discharge or death are shown. Blue bars illustrate days with symptoms prior to hospitalization. Two patients were hospitalized for other reasons prior to COVID-19 diagnosis (subjects 10 and 12, gray bars). Daily mapping of disease severity during hospital admission are illustrated by the bar colors. c Visual representation of a clinical severity scale defining four grades of disease severity applied throughout this study. d Clinical disease severity grade of all patients (n = 30) at time of hospital admission (admission, day 0), corresponding peak severity grade during hospitalization (peak severity), and corresponding outcome of discharge or death (outcome). COVID-19, coronavirus disease 2019; L O2, liters/minute of oxygen supply; ICU, intensive care unit; SpO2, peripheral blood oxygen saturation.
Fig. 2
Fig. 2. Stimulated immune responses and immune cell constitution at baseline vs at/near peak severity.
a Cytokine levels in response to no stimulation, LPS (bacterial), R848 (viral), and CD3/CD28 (T-cell receptor/co-receptor) at baseline (n = 23, except for CD3/CD28: n = 21). Patients are grouped based on future peak severity: Grade 1 (n = 11, CD3/CD28: n = 10, green), Grade 2 (n = 5, CD3CD28: n = 4, yellow), Grade 3 (n = 3, orange), Grade 4 (n = 4, red). b Immune cell subset counts at baseline (n = 18). Patients are grouped based on future peak severity: Grade 1 (n = 7, green), Grade 2 (n = 4, yellow), Grade 3 (n = 3, orange), Grade 4 (n = 4, red). c Cytokine levels in response to no stimulation, LPS, R848, and CD3/CD28 at/near peak severity (n = 30, except for CD3/CD28: n = 27). Patients are grouped based on severity grade at time of sample collection: Grade 1 (n = 16, CD3/CD28: n = 14, green), Grade 2 (n = 7, CD3/CD28 n = 6, yellow), Grade 3 (n = 5, orange), Grade 4 (n = 2, red). d Immune cell subset counts at/near peak severity (n = 28). Patients are grouped based on severity grade at time of sample collection: Grade 1 (n = 14, green), Grade 2 (n = 7, yellow), Grade 3 (n = 5, orange), Grade 4 (n = 2, red). Box edges represent the 25th and 75th percentiles, whiskers extend towards the most extreme values but no further than ± 1.5 times the interquartile range from the hinge. Hollow dots beyond whiskers represent outliers. Solid dots represent individual measurements. Blue shaded areas represent the normal reference interval. Cytokine concentration levels and immune cell subset counts are presented on a log10 y-axis. Severity groups were compared by the Kruskal-Wallis test and Dunn’s post-hoc test, both with adjustment for multiple testing using Bonferroni. Only statistically significant adjusted p-values are shown, defined as adjusted p < 0.05. LPS lipopolysaccharide, R848 resiquimod, CD cluster of differentiation, IFN interferon, IL interleukin, TNF tumor necrosis factor, NK natural killer, L O2 liters/minute of oxygen supply, ICU intensive care unit.
Fig. 3
Fig. 3. Stimulated immune responses and immune cell constitution at discharge vs baseline, and correlation between immune cell subsets and stimulated immune responses.
a, b Violin plots displaying concentration levels for (a) a subset of cytokines in response to LPS, R848, and CD3/CD28 at discharge (n = 25, except for CD3/CD28: n = 24) vs baseline (n = 23 except for CD3/CD28: n = 21), and b immune cell subsets at discharge (n = 18) vs baseline (n = 28). Solid dots represent individual patient measurements, colored by peak severity group; green = Grade 1, yellow = Grade 2, orange = Grade 3, red = Grade 4. Medians within each severity group at discharge and baseline are connected with a line, colored by peak severity. Data at baseline vs discharge were compared using the Wilcoxon signed-rank test, only including patients with paired baseline- and discharge samples available (n = 18 for immune responses, n = 8 for immune cell constitution). Adjustment for multiple testing was done using Bonferroni and adjusted p < 0.05 was considered statistically significant. ce Correlation matrices of 8 immune cell subsets and 45 TruCulture cytokine variables by Pearson at c baseline, d at/near peak severity, and e discharge. All data were log-transformed cytokine concentrations. Correlation coefficients are visualized by color intensity. Only statistically significant correlations after Bonferroni adjustment are presented;* adjusted p < 0.05, ** adjusted p < 0.01, *** adjusted p < 0.001. BL baseline, Dis discharge, LPS lipopolysaccharide, R848 resiquimod, CD cluster of differentiation, IFN interferon, IL interleukin, TNF tumor necrosis factor, NK natural killer, L O2 liters/minute of oxygen supply, ICU intensive care unit, Unstim no stimulation.
Fig. 4
Fig. 4. Associations between individual cytokine stimulus-response variables and peak severity at baseline vs discharge.
a, b, Associations after adjusting for age between individual cytokine variables (log-transformed cytokine concentration, log(concentration)) at baseline and future peak severity grade (Peak Severity) for a LPS stimulation and b R848 stimulation. c, d Associations after adjusting for age between individual cytokine variables (log-transformed cytokine concentration, log(concentration)) at discharge and previous peak severity grade (Peak Severity) for c LPS stimulation and d R848 stimulation. Shaded areas behind regression lines represent 95% confidence intervals. Individual regression coefficient estimates for the cytokine variable and age are illustrated in a summary plot below each regression plot, hollow dots represent the estimates, bars represent 95% confidence intervals. e, f p-values from all linear regression analyses (n = 45) after adjusting for age on a -log10-axis at e baseline and f discharge. The threshold for statistical significance is shown before adjusting for multiple tests (p = 0.05, blue line) and after Bonferroni-adjustment (p = 0.001, red line). Only associations with p-values smaller than the Bonferroni-adjusted threshold (p < 0.001) were considered statistically significant. g Regression coefficient estimates for the LPS and R848 stimulated cytokine variables and age at baseline vs recovery, hollow dots represent the estimates, bars represent 95% confidence intervals. LPS lipopolysaccharide, R848 resiquimod, CD cluster of differentiation, IFN interferon, IL interleukin, TNF tumor necrosis factor, L O2 liters/minute of oxygen supply, ICU intensive care unit, NULL no stimulation, cd3 CD3/CD28 stimulation, poly Poly:IC (Polyinosinic:polycytidylic acid) stimulation.
Fig. 5
Fig. 5. A stimulation signature based on LPS and R848 stimulated cytokine responses at baseline associated with peak severity.
a Combined LPS and R848 stimulated cytokine variables at baseline. Each column represents a patient, each row represents a stimulus-cytokine variable. Columns are grouped by future peak severity, rows are grouped by inclusion/exclusion in the LPS + R848 model. Hierarchical clustering by Euclidean distance as dissimilarity metric was preformed within groups/splits (dendrogram only shown for rows). The top annotations represent (up-down): “Sev”: future peak severity, “Pred.Sev”: predicted severity in current cohort based on the LPS + R848 LASSO regression model, “Sex”: sex at birth, “Age”: age at time of inclusion in study, “Imm.Sup”: whether an immunosuppressive pre-condition was present, “Centroid”: the row mean value. Row annotations represent (left-right): “Model”: Inclusion/exclusion of variable in the LPS + R848 model, “Stimuli”: the stimulus for each cytokine variable. Data used for visualization were log-transformed and standardized. Data from the variables excluded from the LPS + R848 model have been blurred. b Correlation between all LPS and R848 stimulated cytokine variables by Pearson. All data were log-transformed cytokine concentrations. Row annotation represent inclusion/exclusion of a variable in the LPS + R848 model. c Projection of LPS + R848 data at baseline using isomap revealing a severity gradient in the data structure. LPS lipopolysaccharide, R848 resiquimod, L O2 liters/minute of oxygen supply, ICU intensive care unit.
Fig. 6
Fig. 6. Validation of the immune response signature in a separate cohort.
The LPS + R848 model was validated on a separate cohort of hospitalized COVID-19 patients (n = 20, 5 in each peak severity group). a Sensitivity/recall, specificity, false positive rate (FPR), false negative rate (FNR), positive predictive value (PPV) /precision, negative predictive value (NPV), false discovery rate (FDR), false omission rate (FOR), diagnostic odds ratio (DOR), and Mathew’s correlation coefficient (MCC) are presented for predicting severity grade 1 alone, grade 1–2, grade 3–4, and grade 4 alone. b Cytokine levels in response to LPS and R848 based on baseline data from the validation cohort (n = 20). Patients are grouped based on future peak severity: Grade 1 (n = 5, green), Grade 2 (n = 5, yellow), Grade 3 (n = 5, orange), Grade 4 (n = 5, red). Box edges represent the 25th and 75th percentiles, and whiskers extend towards the most extreme values but no further than ± 1.5 times the interquartile range from the hinge. Hollow dots beyond whiskers represent outliers. Solid dots represent individual measurements. Blue shaded areas represent the normal reference interval. Cytokine concentration levels and immune cell subset counts are presented on a log10 y-axis. LPS lipopolysaccharide, R848 resiquimod, IFN interferon, IL interleukin, TNF tumor necrosis factor, L O2 liters/minute of oxygen supply, ICU intensive care unit.

References

    1. Wang C, et al. COVID-19 in early 2021: current status and looking forward. Signal Transduct. Target. Ther. 2021;6:114. doi: 10.1038/s41392-021-00527-1. - DOI - PMC - PubMed
    1. World Health Organization. COVID-19 weekly epidemiological update. World Heal. Organ. Edition. 2022;84:1–10.
    1. Yang R, Gui X, Xiong Y. Comparison of clinical characteristics of patients with asymptomatic vs symptomatic coronavirus disease 2019 in Wuhan, China. JAMA Netw. open. 2020;3:e2010182. doi: 10.1001/jamanetworkopen.2020.10182. - DOI - PMC - PubMed
    1. Guan W, et al. Clinical characteristics of coronavirus disease 2019 in China. N. Engl. J. Med. 2020;382:1708–1720. doi: 10.1056/NEJMoa2002032. - DOI - PMC - PubMed
    1. Zhou F, et al. Clinical course and risk factors for mortality of adult inpatients with COVID-19 in Wuhan, China: a retrospective cohort study. Lancet. 2020;395:1054–1062. doi: 10.1016/S0140-6736(20)30566-3. - DOI - PMC - PubMed