. 2022 Sep 30;131(8):673-686.
doi: 10.1161/CIRCRESAHA.121.320661. Epub 2022 Sep 14.

Impaired Dynamic Sarcoplasmic Reticulum Ca Buffering in Autosomal Dominant CPVT2

Affiliations

Impaired Dynamic Sarcoplasmic Reticulum Ca Buffering in Autosomal Dominant CPVT2

Matthew J Wleklinski et al. Circ Res. .

Abstract

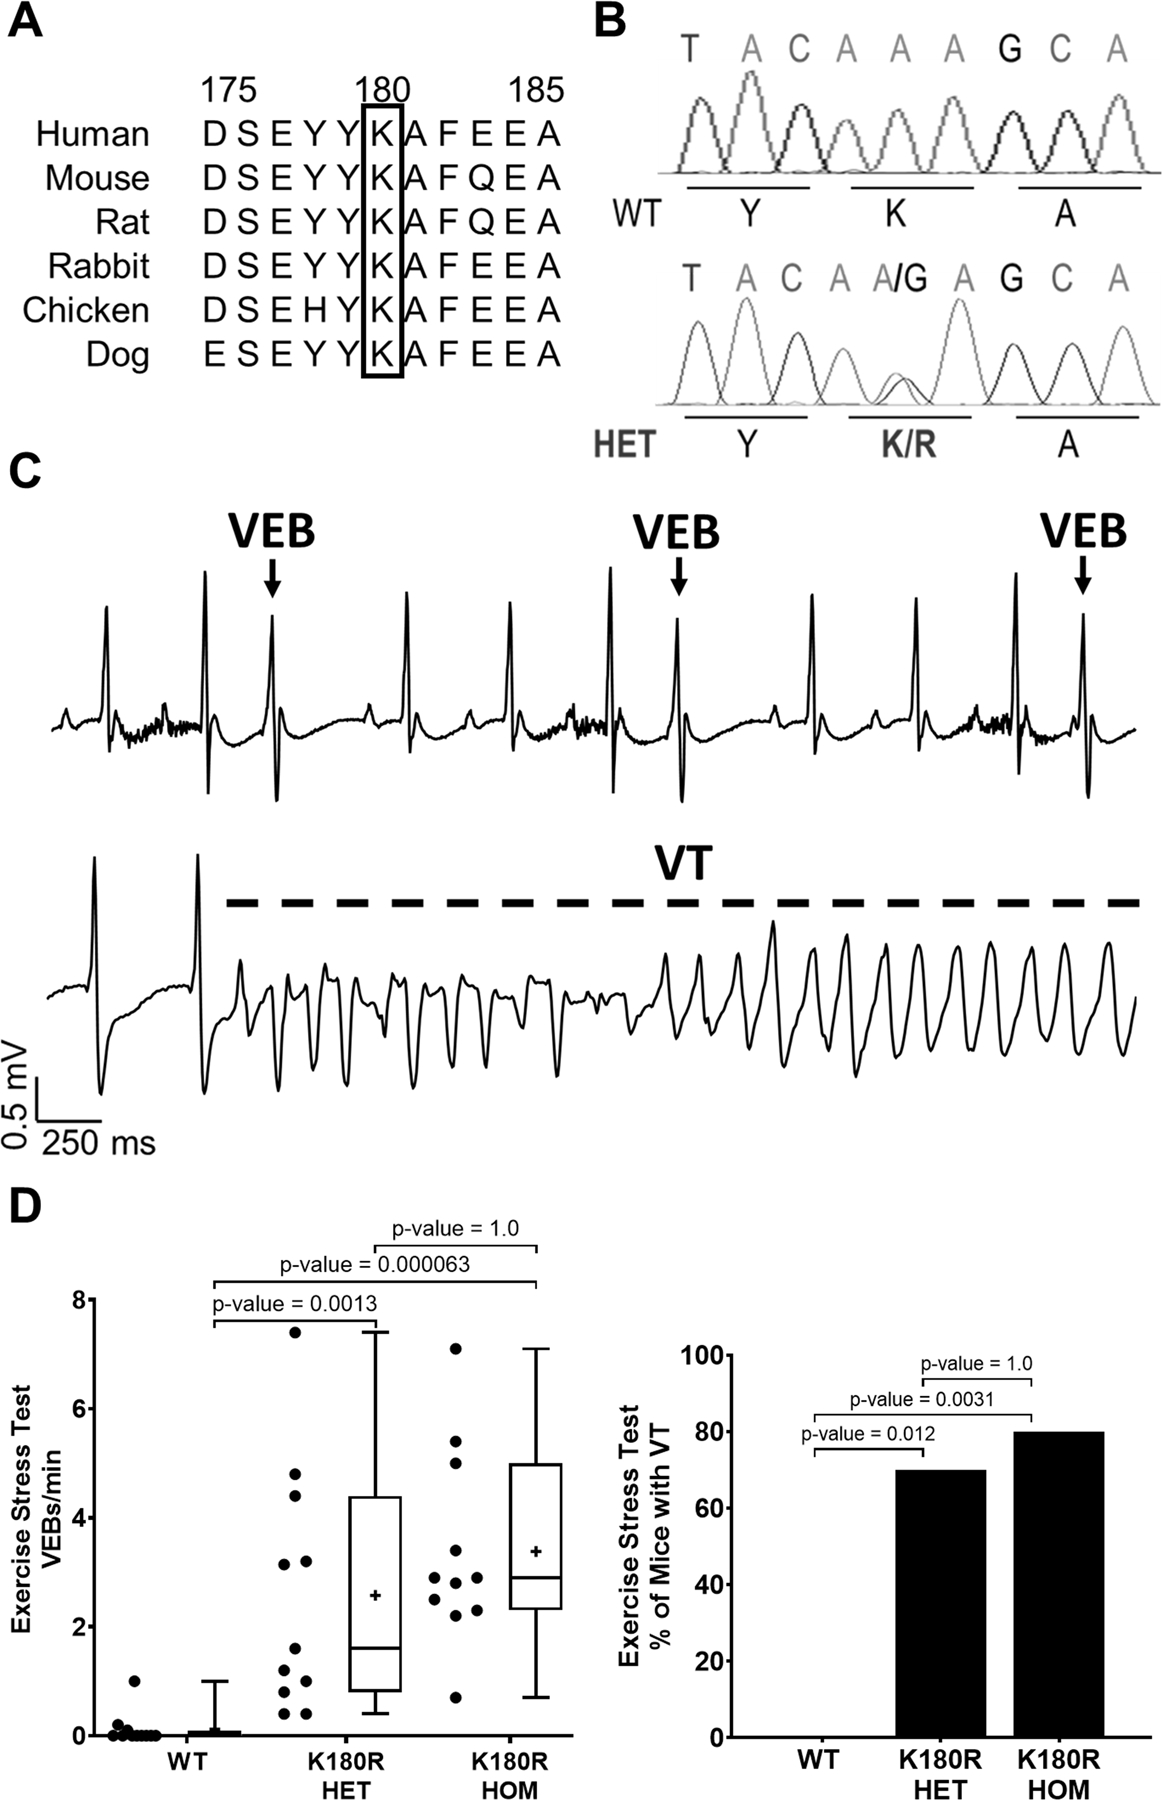
Background: Catecholaminergic polymorphic ventricular tachycardia (CPVT) is a potentially lethal cardiac arrhythmia syndrome triggered by catecholamines released during exercise, stress, or sudden emotion. Variants in the calsequestrin-2 gene (CASQ2), encoding the major calcium (Ca) binding protein in the sarcoplasmic reticulum (SR), are the second most common cause of CPVT. Recently, several CASQ2 gene variants, such as CASQ2-K180R, have been linked to an autosomal dominant form of Casq2-linked CPVT (CPVT2), but the underlying mechanism is not known.

Methods: A K180R mouse model was generated using CRIPSR/Cas9. Heterozygous and homozygous K180R mice were studied using telemetry ECG recordings in vivo. Ventricular cardiomyocytes were isolated and studied using fluorescent Ca indicators and patch clamp. Expression levels and localization of SR Ca-handling proteins were evaluated using Western blotting and immunostaining. Intra-SR Ca kinetics were quantified using low-affinity Ca indicators.

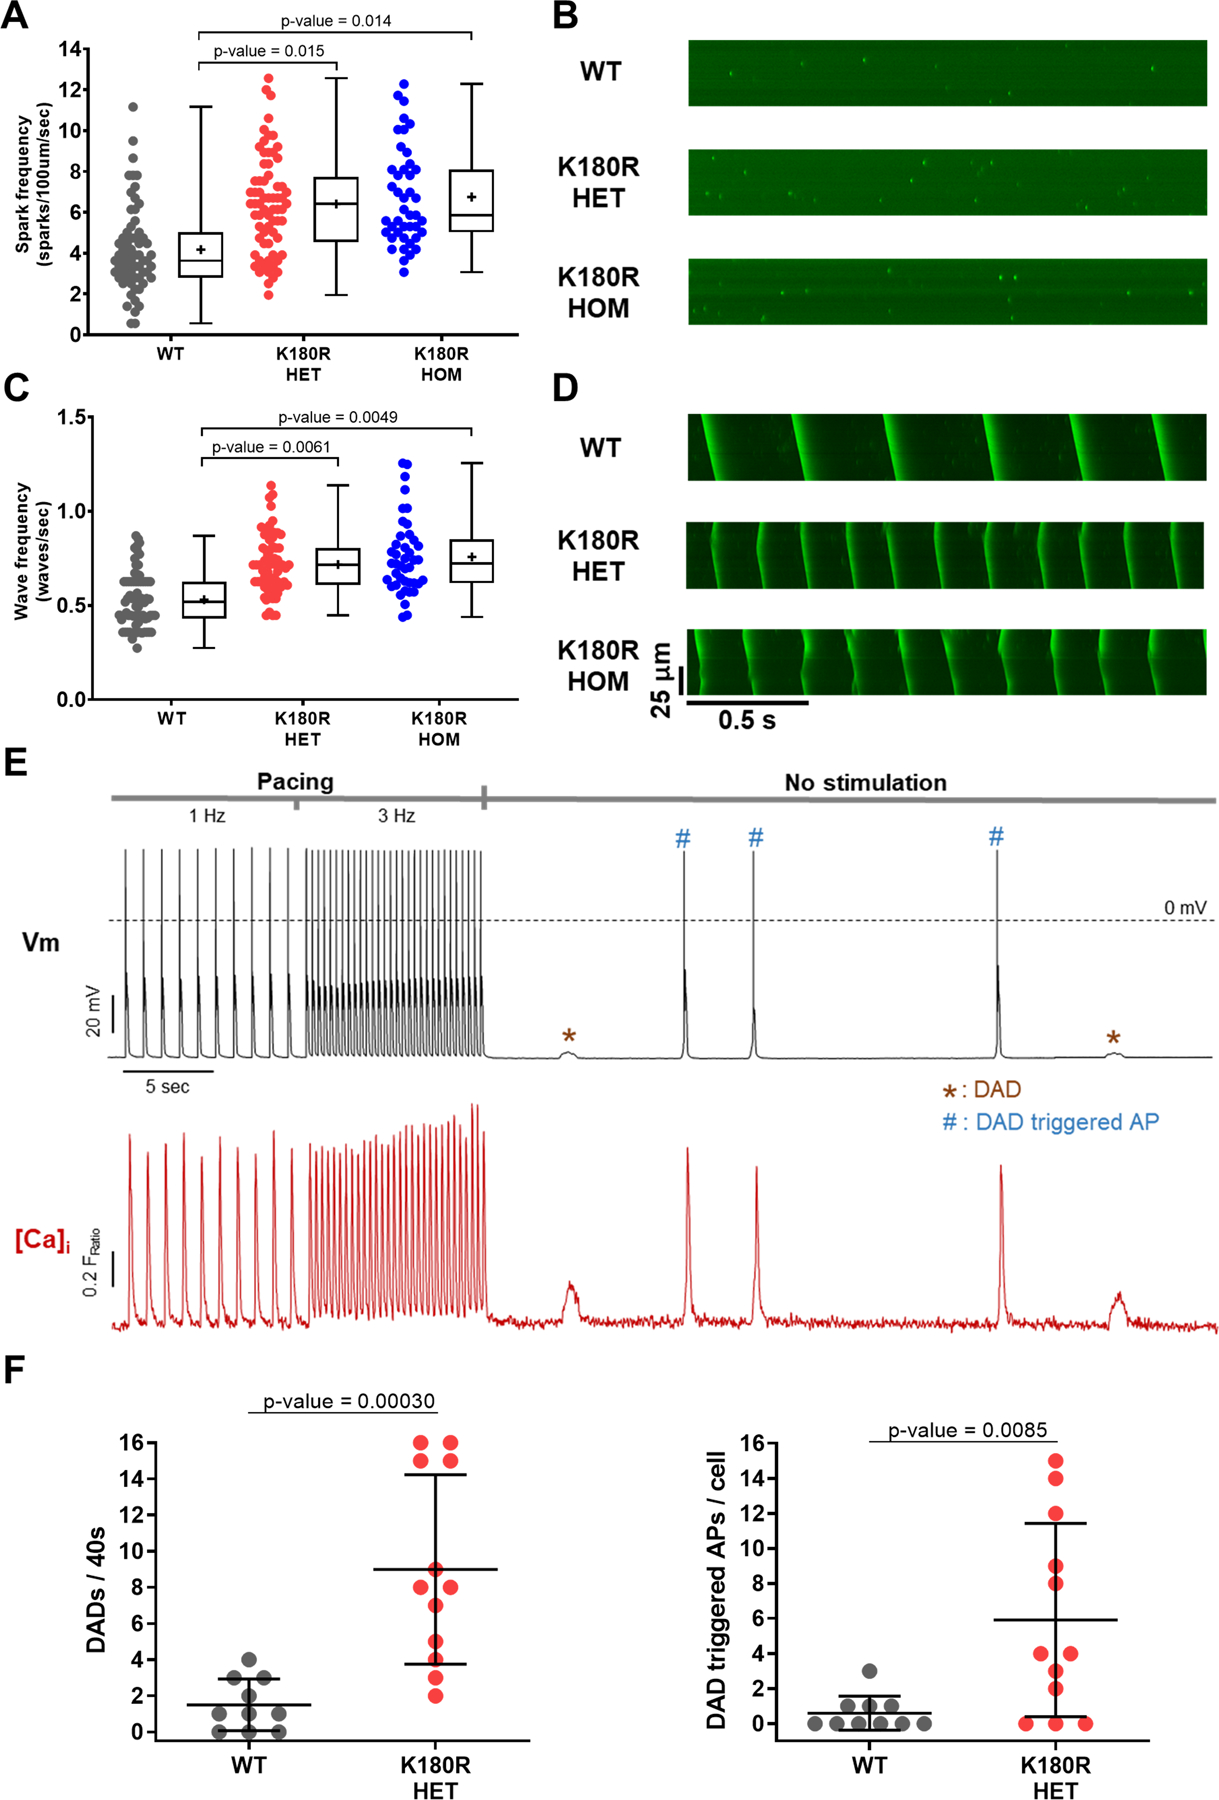
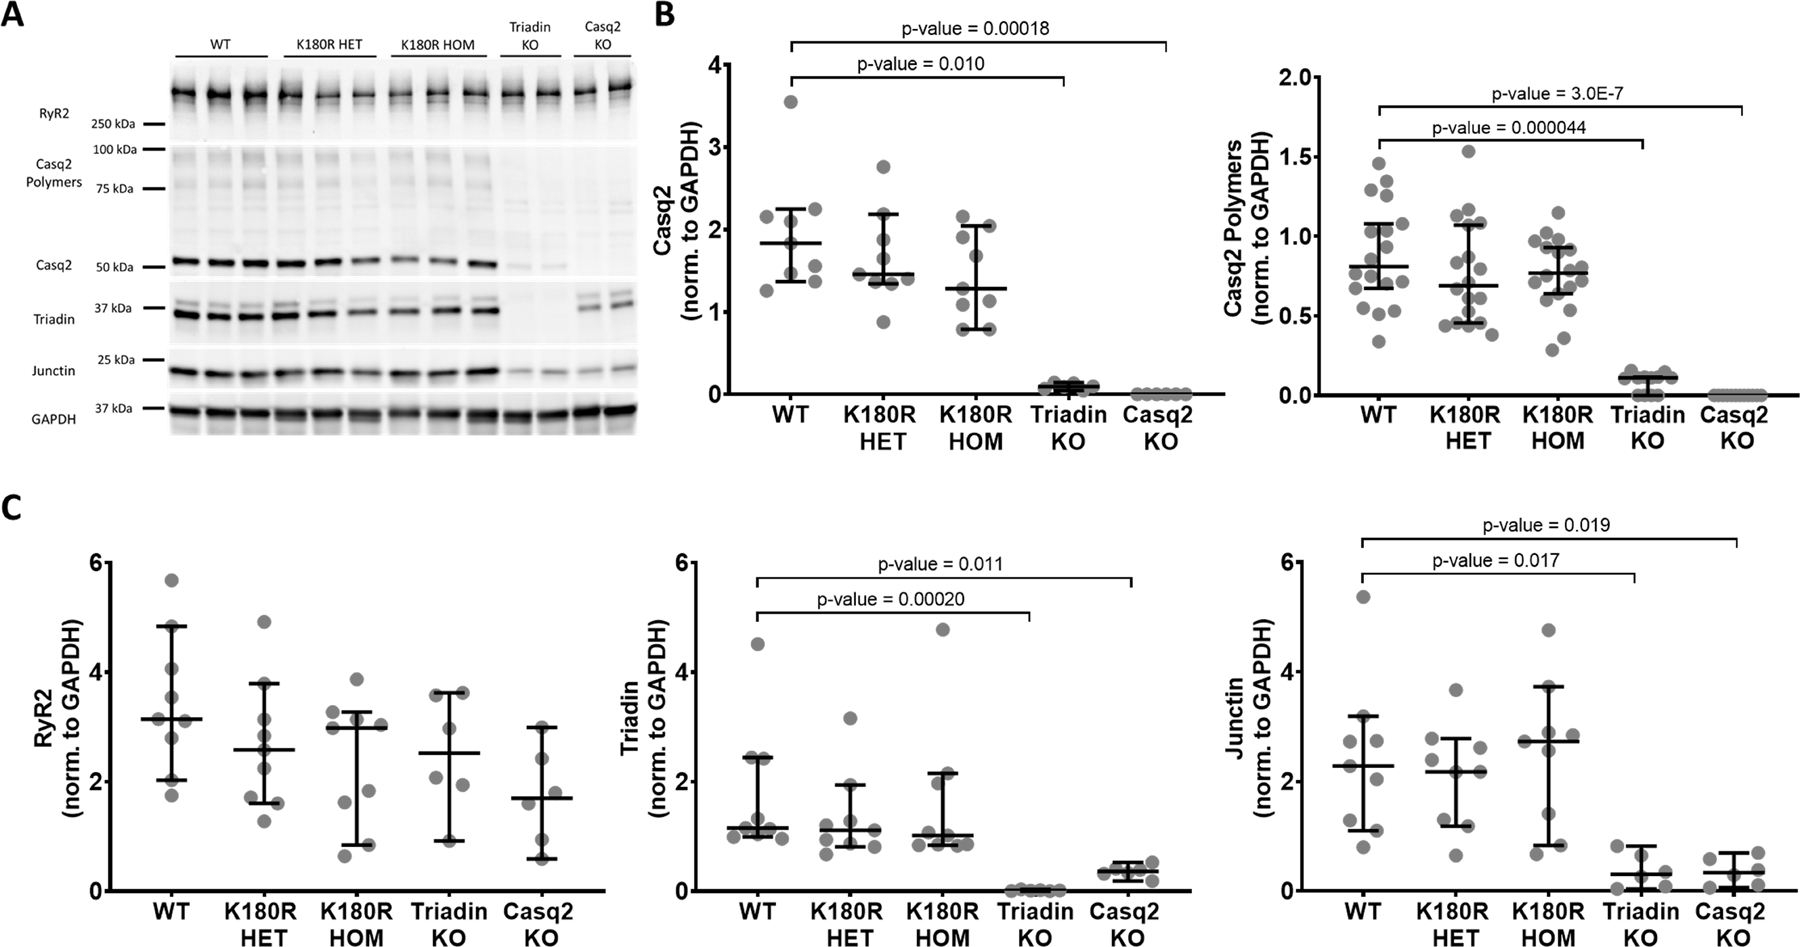
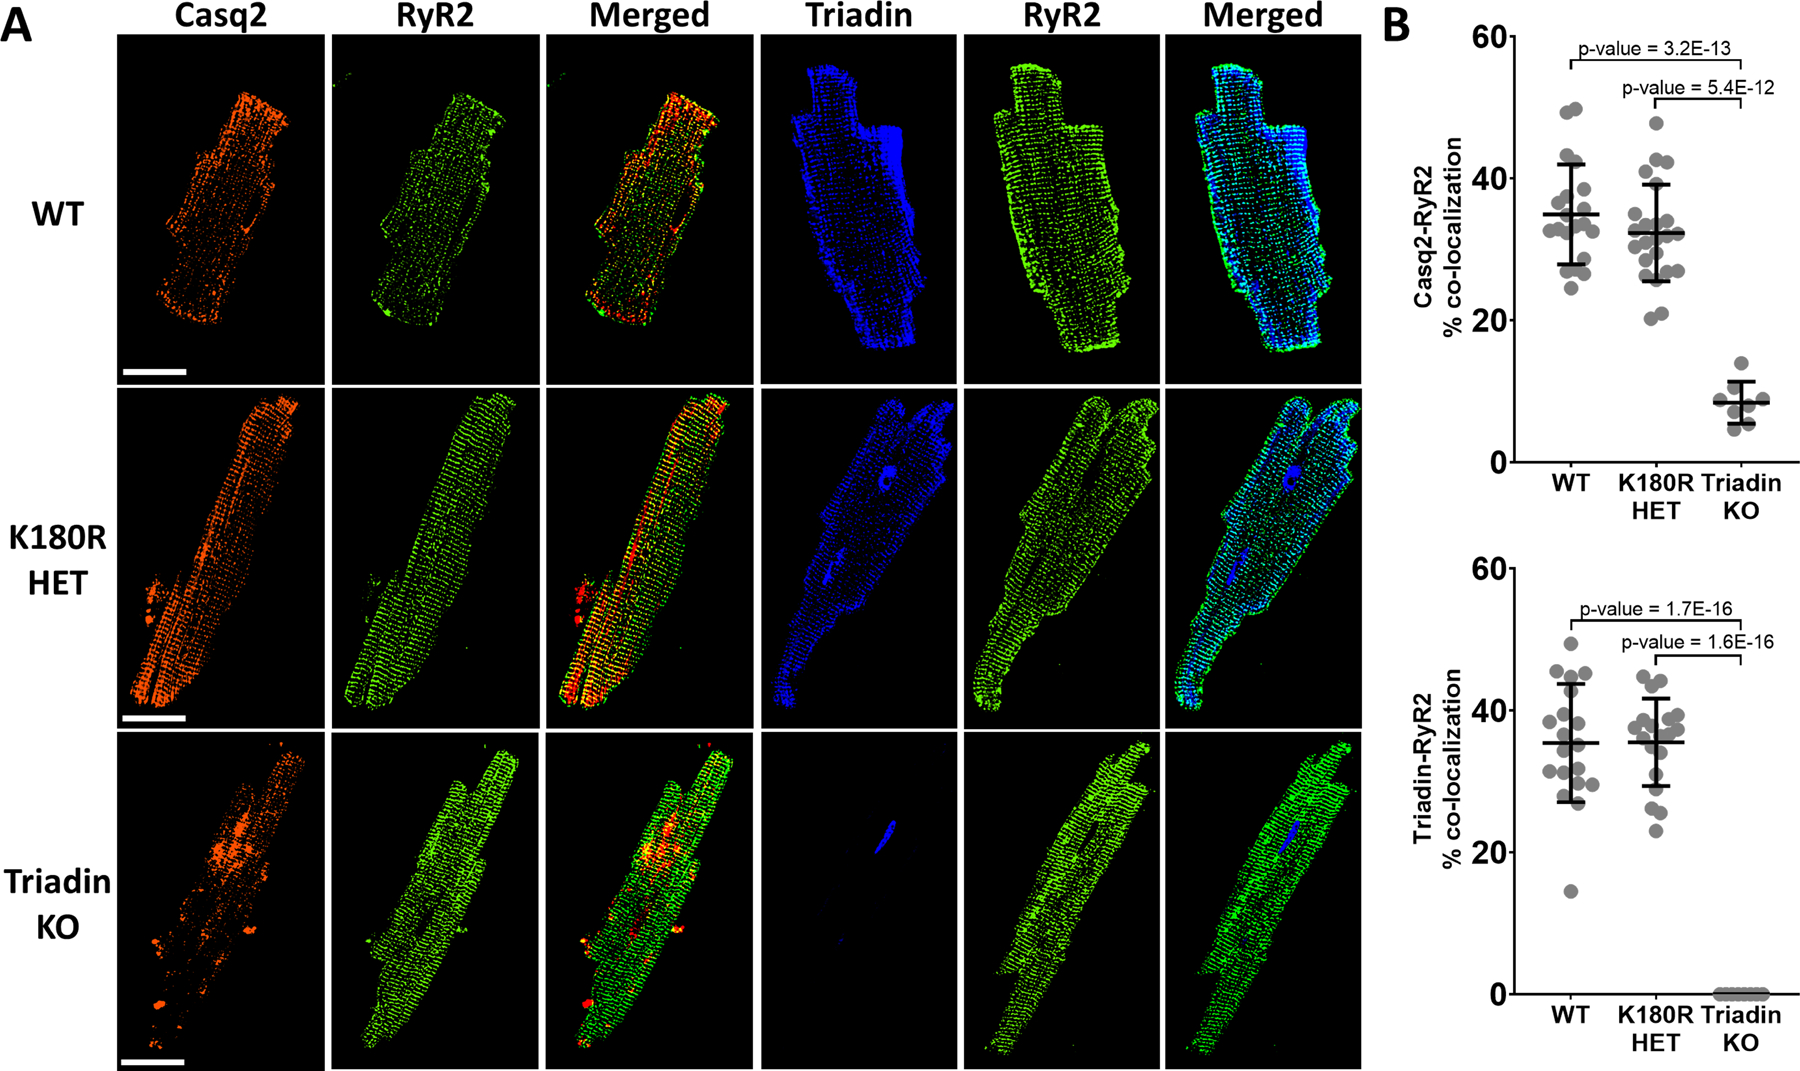
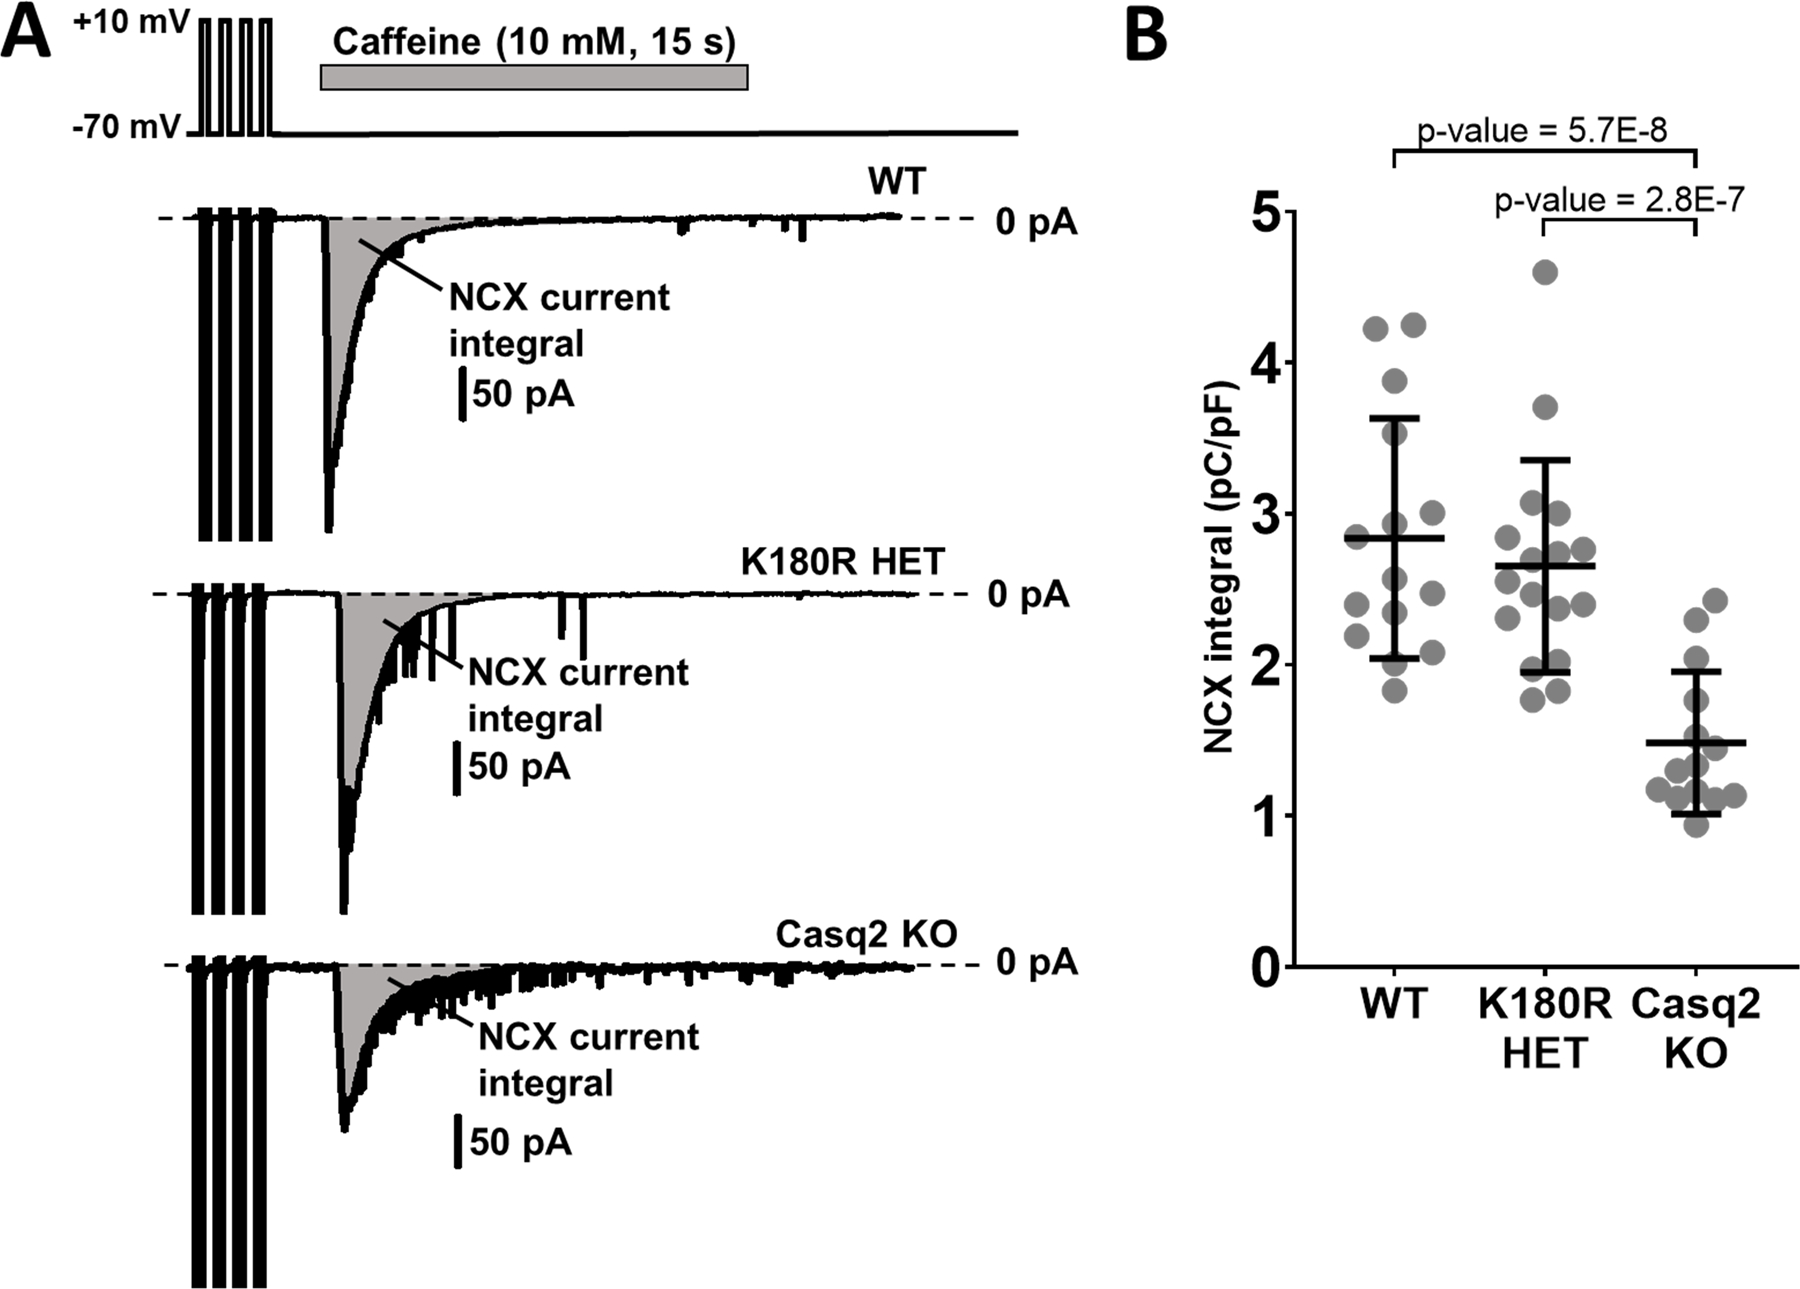
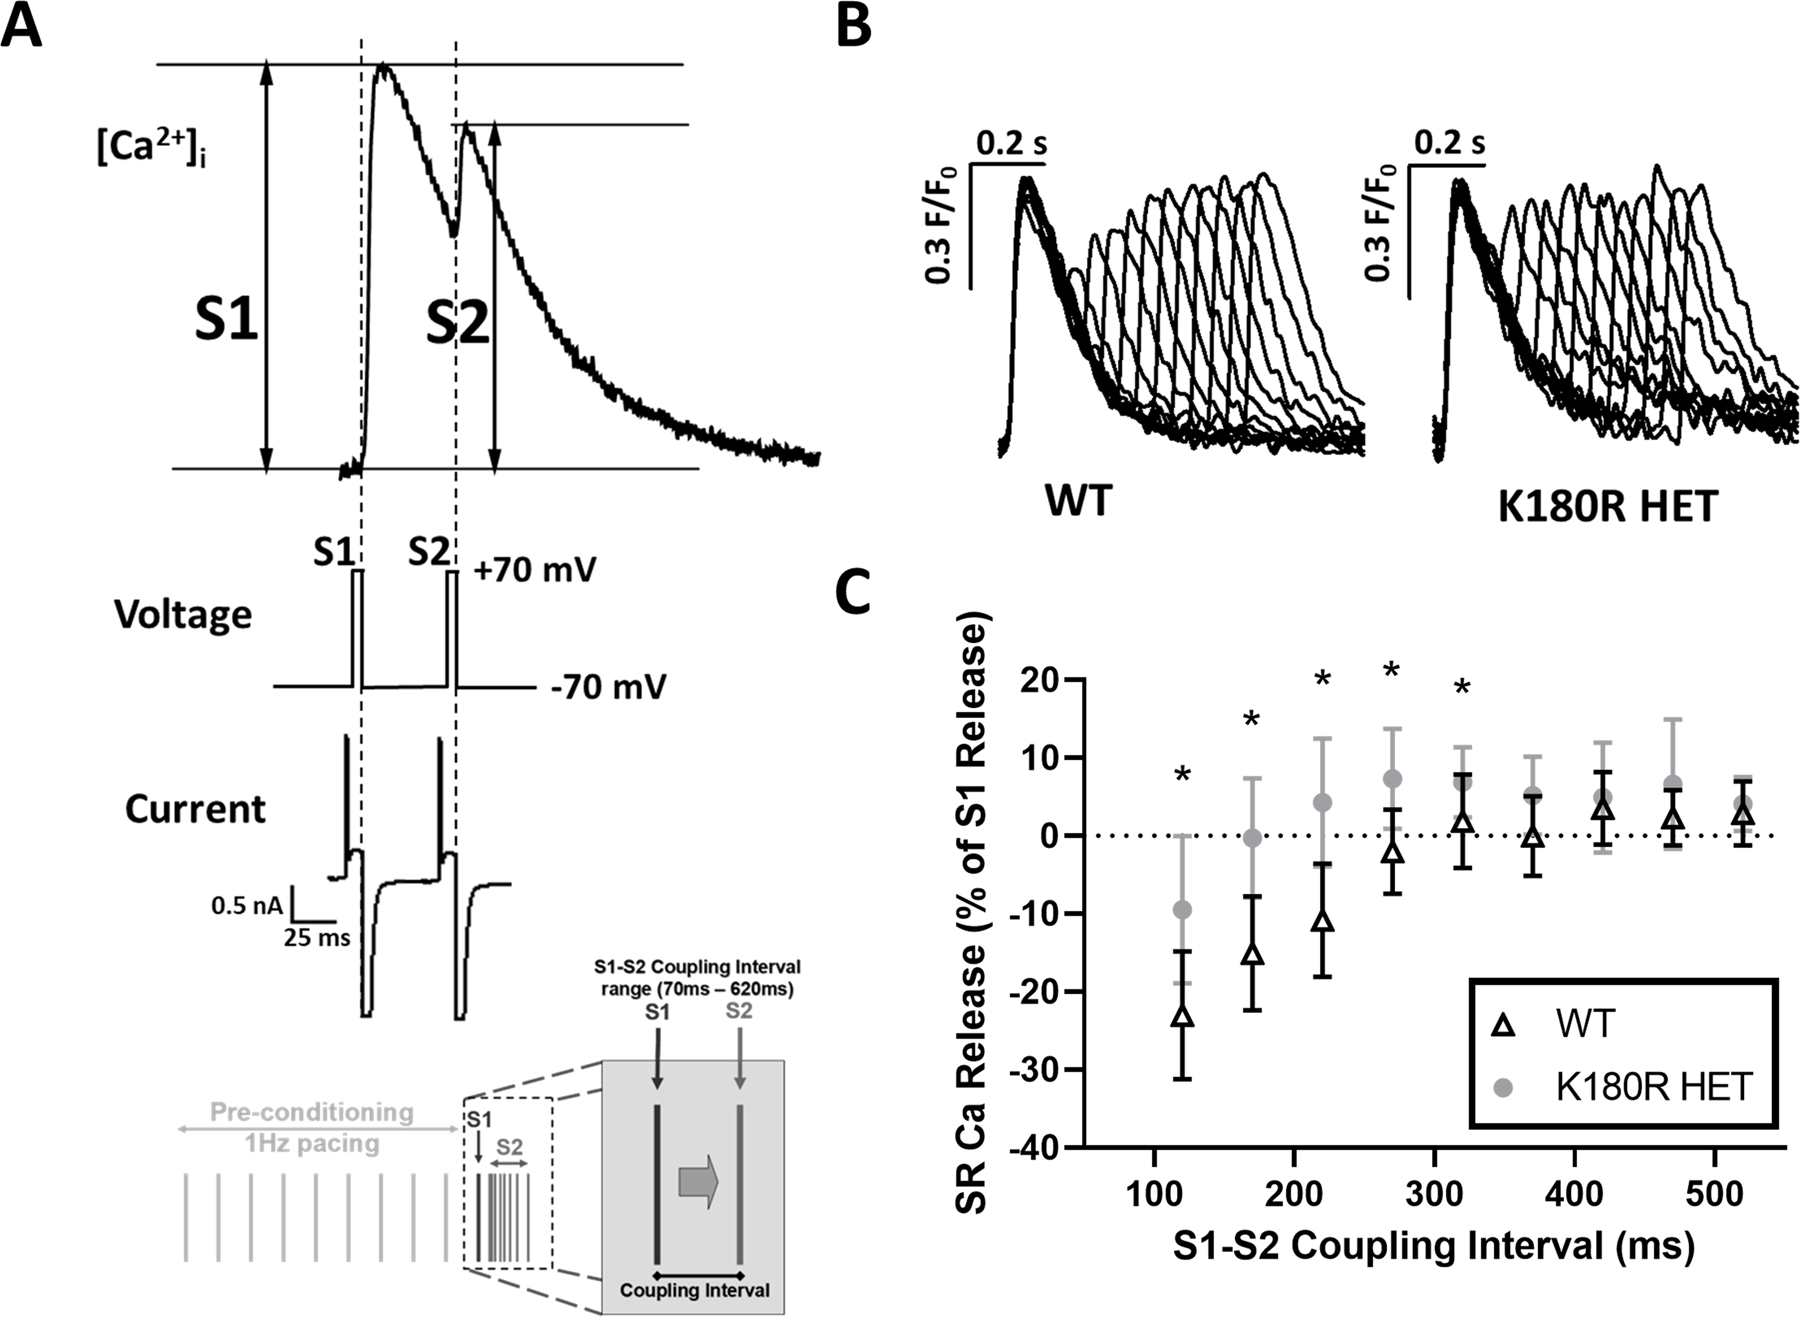
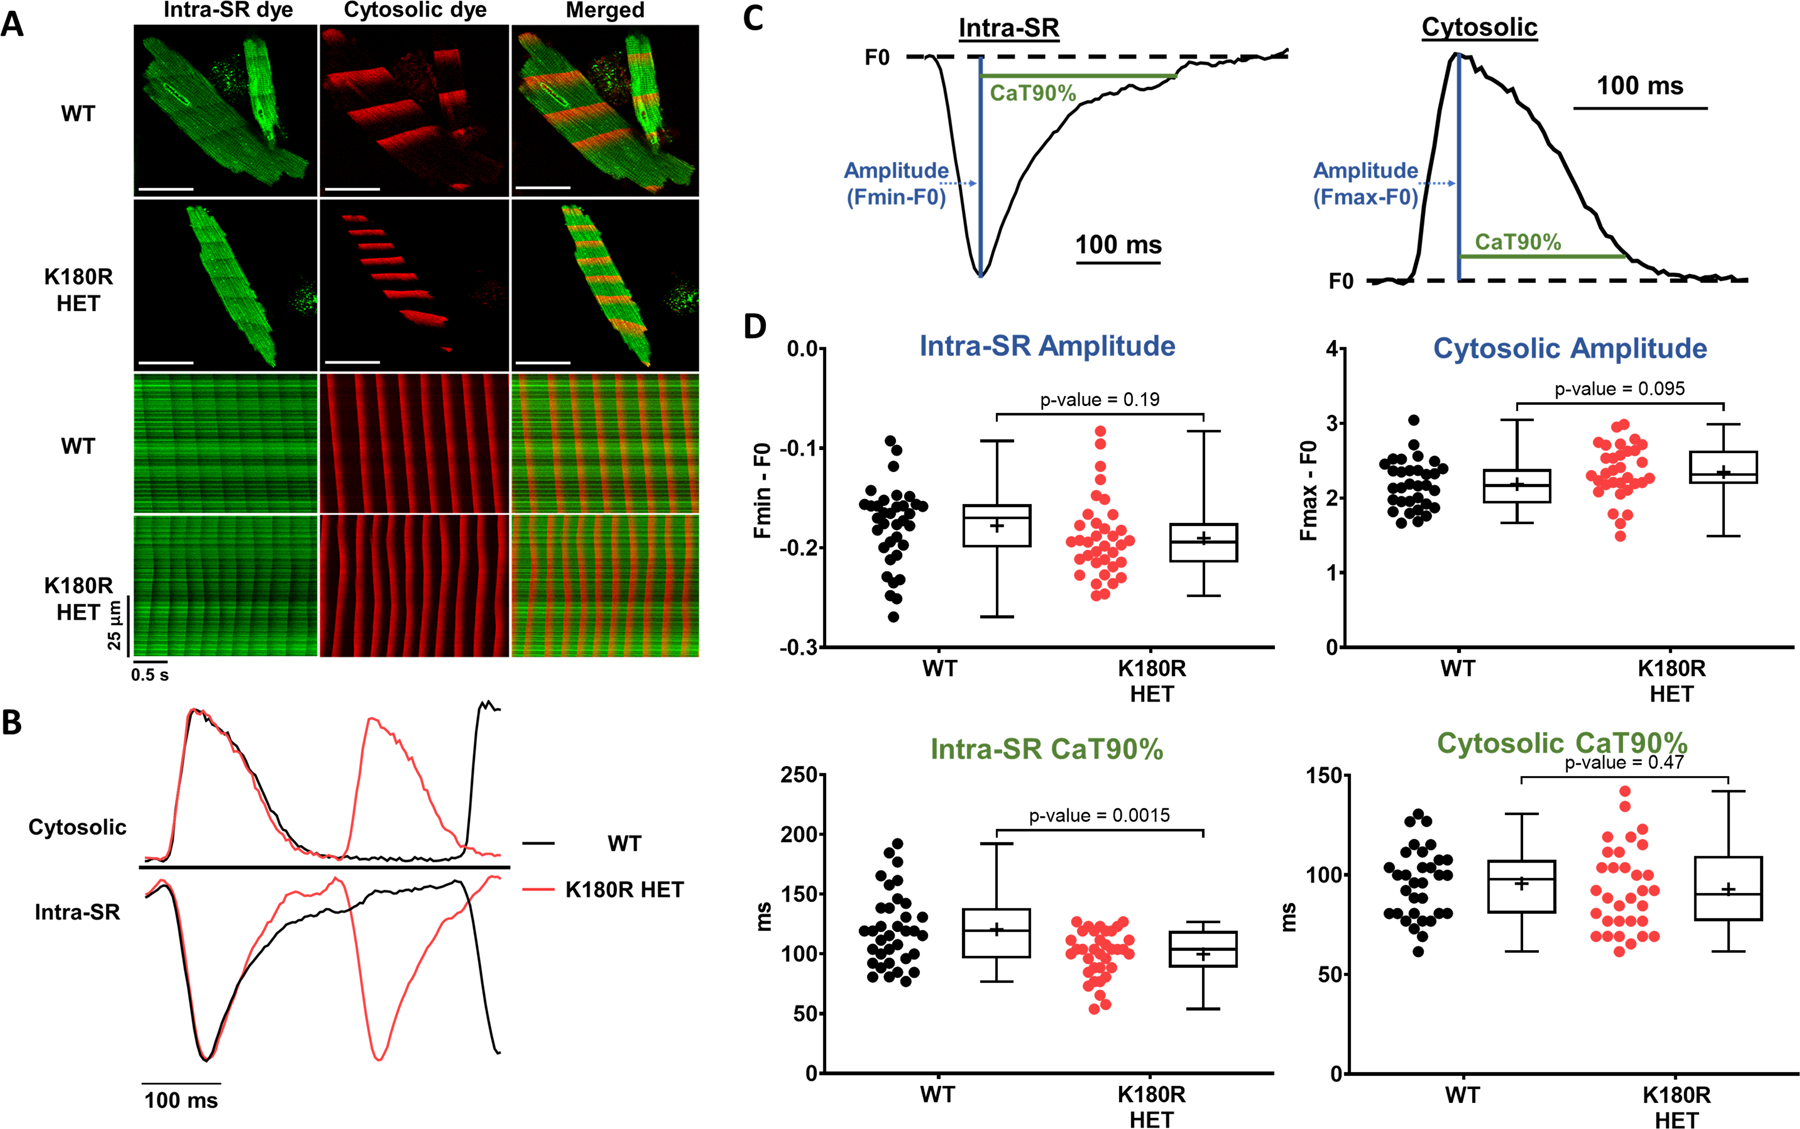
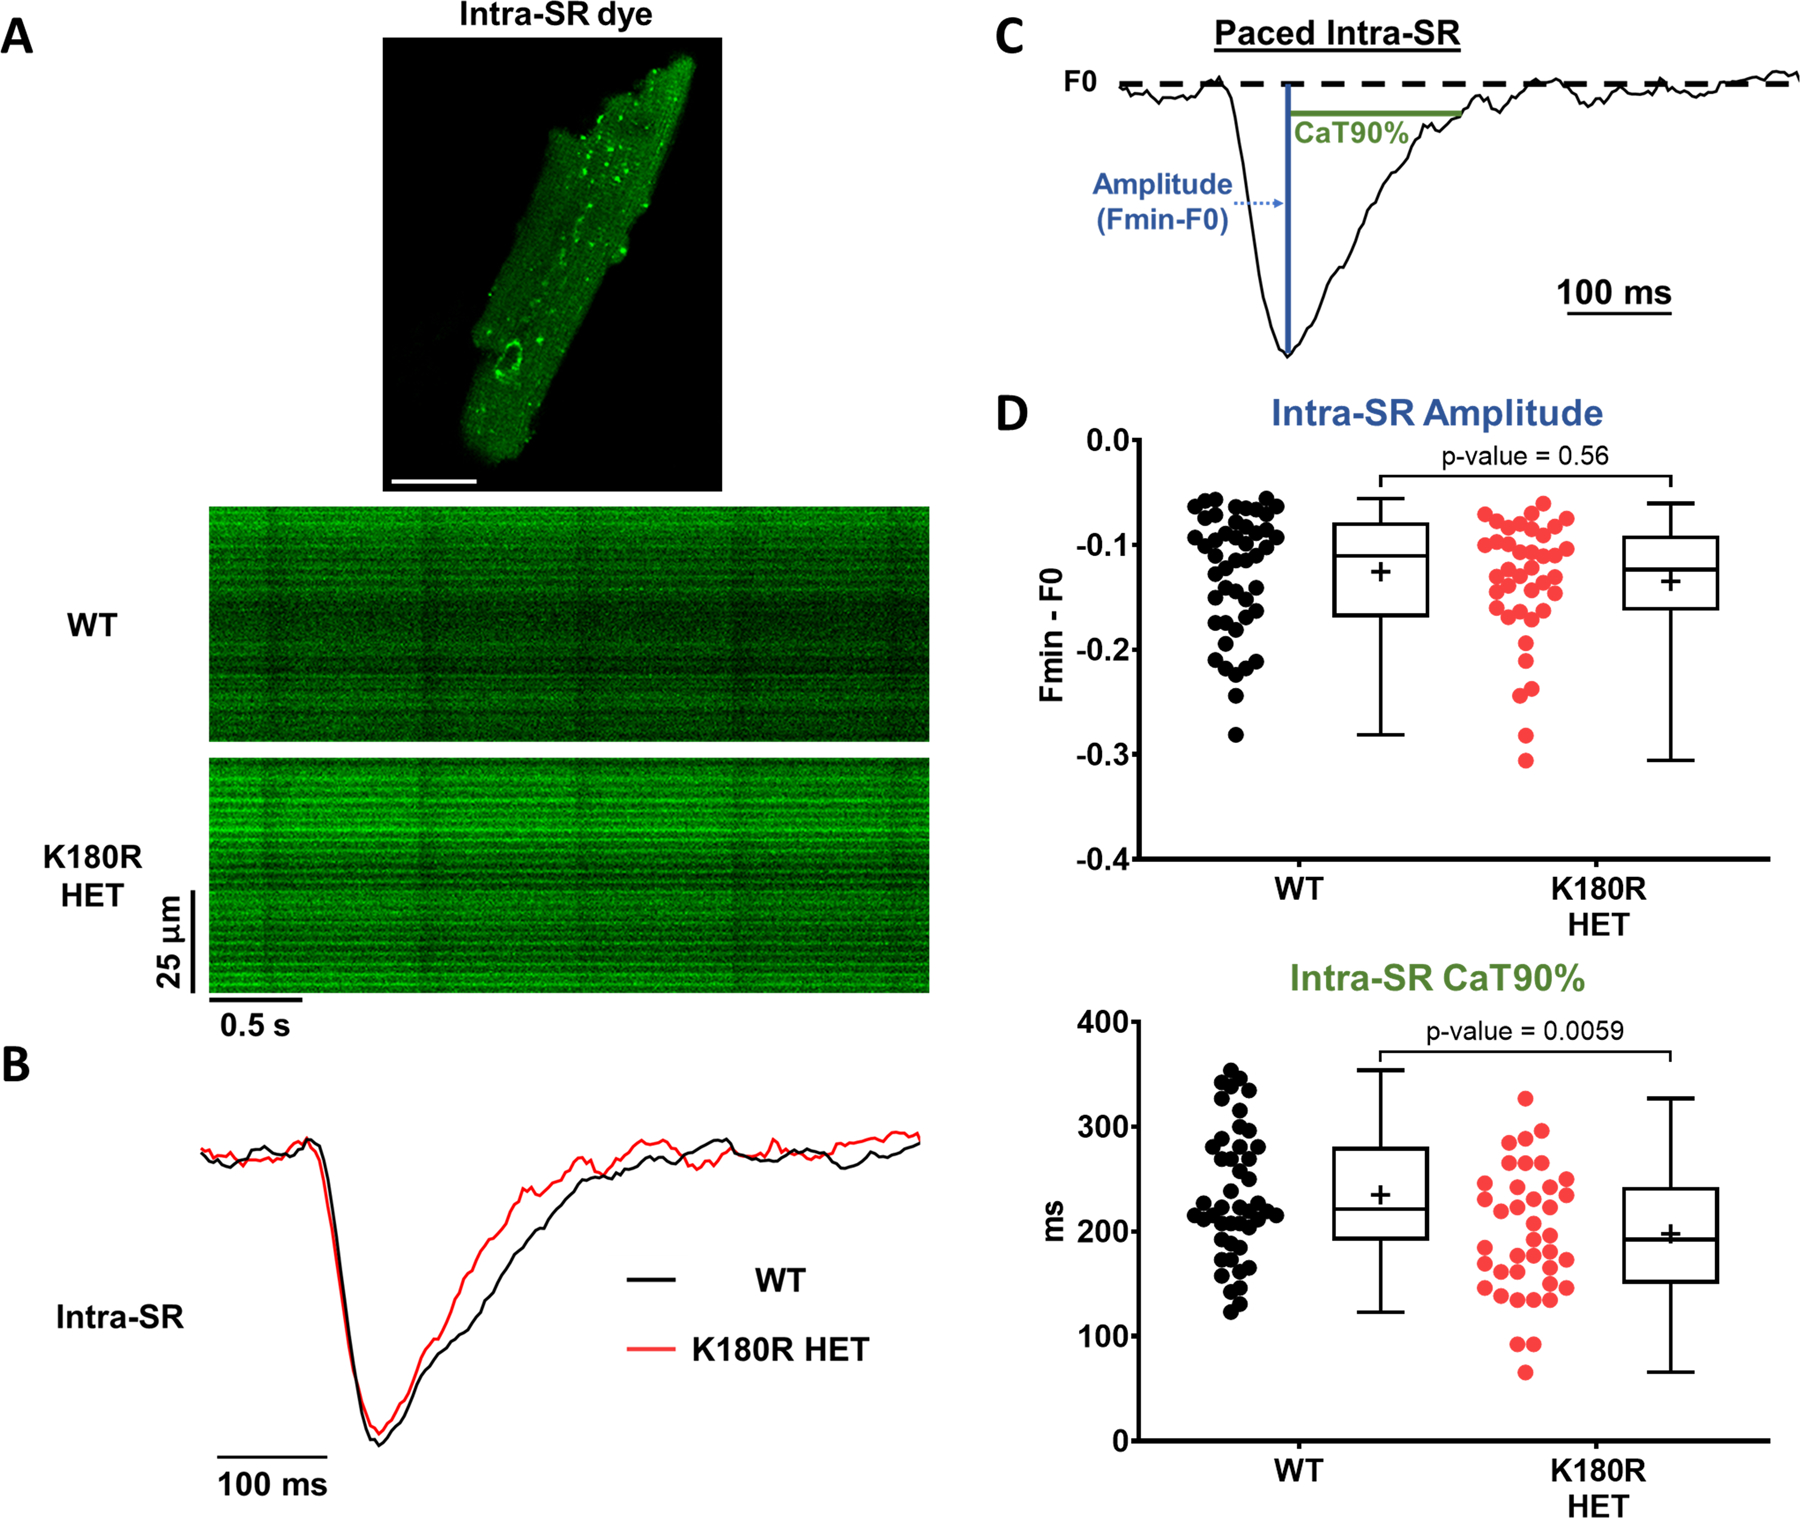
Results: K180R mice exhibit an autosomal dominant CPVT phenotype following exercise or catecholamine stress. Upon catecholamine stress, K180R ventricular cardiomyocytes exhibit increased spontaneous SR Ca release events, triggering delayed afterdepolarizations and spontaneous beats. K180R had no effect on levels of Casq2, Casq2 polymers, or other SR Ca-handling proteins. Intra-SR Ca measurements revealed that K180R impaired dynamic intra-SR Ca buffering, resulting in a more rapid rise of free Ca in the SR during diastole. Steady-state SR Ca buffering and total SR Ca content were not changed. Consistent with the reduced dynamic intra-SR buffering, K180R causes reduced SR Ca release refractoriness.

Conclusions: CASQ2-K180R causes CPVT2 via a heretofore unknown mechanism that differs from CASQ2 variants associated with autosomal recessive CPVT2. Unlike autosomal recessive CASQ2 variants, K180R impairs the dynamic buffering of Ca within the SR without affecting total SR Ca content or Casq2 protein levels. Our data provide insight into the molecular mechanism underlying autosomal dominant CPVT2.

Keywords: calcium; calsequestrin; catecholamine; sarcoplasmic reticulum; tachycardia.


Conflict of interest statement

Disclosures

The authors have declared that no conflict of interest exists.

Figures

Figure 1:
Figure 1:. K180R mice display a CPVT phenotype.
A. Amino acid 180 is conserved across species in CASQ2. B. K180R knockin mice are heterozygous for the AGG mutation. C. Example EKG traces from a K180R HET mouse, immediately after completing an exercise stress test, displaying characteristics of CPVT including ventricular ectopic beats (VEBs) and an episode of ventricular tachycardia (VT) D. Summary data of exercise-induced ventricular ectopy (VEB/min) and VT incidence. Ventricular arrhythmias were quantified during the 10 min period immediately after completion of the treadmill exercise test. n = 11 mice per group. Data displayed as a box and whisker plot. Median is displayed as a line within the box and whisker plot. Mean is displayed as a plus sign within the box and whisker plot. VEB/min data analyzed using Kruskal-Wallis test with Dunn’s multiple comparisons. VT data analyzed using Fisher’s exact test with pairwise Fisher exact test.
Figure 2:
Figure 2:. K180R causes spontaneous SR Ca release events and delayed afterdepolarizations in single cardiomyocytes.
Intracellular Ca handling was examined in permeabilized (panels A-D) and intact (panels E-F) cardiomyocytes. A-D: Saponin-permeabilized cardiomyocytes were incubated in an internal solution containing the Ca indicator (Fluo-4) and free [Ca] of 70 nm for spark measurements (panels A&B) and 190 nm for wave measurements (panels C&D). Cells were imaged using an inverted confocal microscope in line-scan mode. No isoproterenol was present for these experiments. A. Ca spark frequency in WT, K180R HET, and K180R HOM cardiomyocytes. WT; n = 63 cells from 3 hearts. K180R HET; n = 68 cells from 3 hearts. K180R HOM; n = 43 cells from 2 hearts. B. Example line-scan images of Ca sparks in K180R cardiomyocytes. C. Ca wave frequency in WT, K180R HET, and K180R HOM cardiomyocytes. WT n = 71 cells from 3 hearts; K180R HET n = 67 cells from 3 hearts; K180R HOM n = 42 cells from 2 hearts. D. Example line-scan images of Ca waves. Data displayed as a box and whisker plot. Median is displayed as a line within the box and whisker plot. Mean is displayed as a plus sign within the box and whisker plot. E-F: Intact cardiomyocytes were loaded with the Ca indicator Fura-2AM and incubated in normal Tyrode solution containing 2 mM Ca and 1 µM isoproterenol. Membrane potential (Vm) was measured using patch clamp in current clamp mode. Intracellular Ca was measured using a dual-beam excitation fluorescence photometry. E. Examples of simultaneous recordings of [Ca]i and Vm from a K180R HET cardiomyocyte stimulated at 1 and 3 Hz (for 10 s each) followed by 40 s pause. Dotted line indicates 0 mV. For each cardiomyocyte, spontaneous Ca release events and the resulting delayed afterdepolarizations (DAD)s were quantified during the 40s pause. DADs are indicated by * and #, which sometimes generated a DAD-triggered action potential (AP, #). F. Frequency of DADs and DAD-triggered APs. WT n = 10 cells from 5 hearts; K180R HET n = 12 cells from 6 hearts. Data are presented as mean ± SD and were analyzed using a hierarchical statistical model with Bonferroni correction.
Figure 3:
Figure 3:. Levels of cardiac junctional SR proteins are not altered in K180R mice.
Ventricular cellular lysate was collected from isolated mouse hearts and analyzed using western blotting. A. Representative raw western blot image. Triadin knockout and Casq2 knockout mice were used as controls. B. Quantification of Casq2 and Casq2 polymers band density. There was no significant difference between Casq2 and Casq2 polymer protein levels in K180R mice and WT mice. C. Quantification of junctional SR proteins. There was no significant difference in junctional SR protein levels in K180R mice compared to WT. All values were normalized to GAPDH. n = 9 lysates for WT, K180R HET, and K180R HOM. N = 6 lysates for Triadin KO and Casq2 KO. Each lysate was collected from an independent animal. Data displayed as mean ± SD. Data were analyzed using Kruskal-Wallis test with Dunn’s multiple comparison test.
Figure 4:
Figure 4:. K180R does not change intra-SR localization of Casq2.
Cardiomyocytes isolated from K180R mice were stained for Casq2 and RyR2 or triadin and RyR2 to analyze co-localization between junctional SR proteins. A. Immunostaining displaying representative images for each genotype. B. Co-localization analysis was performed and displayed as a percent of overlapping pixels between images. WT n = 20 cells from 2 hearts, K180R HET n = 23 cells from 2 hearts, Triadin KO n = 8 cells from 2 hearts (top panel). WT n = 19 cells from 2 hearts, K180R HET n = 19 cells from 2 hearts, Triadin KO n = 8 cells from 2 hearts (bottom panel). Data displayed as mean ± SD. Data analyzed using a hierarchical statistical model with Bonferroni correction. Scale bar = 50 µM.
Figure 5:
Figure 5:. K180R does not change total SR Ca content.
Total SR Ca content was quantified by integration of NCX current elicited in response to rapid caffeine application. Following four brief membrane depolarizations from −70 mV to +10 mV at 2 Hz to ensure consistent SR Ca loading, caffeine (10 mM) was applied using a rapid solution exchanger for 15 s at a holding potential of −70 mV. Isoproterenol (1 µM) was added to the external solution to activate beta-adrenergic receptors. NCX current integrals were normalized by cell capacitance, a measure of cell size and expressed as pC/pF. A. Representative traces of the NCX currents from 3 groups. B. NCX integral summary data. WT n = 15 cells from 5 hearts; K180R HET n = 17 cells from 4 hearts; Casq2 KO n = 14 cells from 5 hearts. Data displayed as mean ± SD. Data analyzed using a hierarchical statistical model with Bonferroni correction.
Figure 6:
Figure 6:. SR Ca release refractoriness is impaired in K180R cardiomyocytes.
To measure the refractoriness of SR Ca release, isolated cardiomyocytes were loaded with the Ca indicator fluo-4, patched in voltage clamp mode, and a voltage stimulation protocol used as shown in bottom of panel A. Isoproterenol was not used in this experiment. SR Ca release was triggered by L-type Ca tail currents elicited by stepping membrane potential from +70 to −70mV. A. Example [Ca]i fluorescent trace, voltage protocol, and membrane currents elicited during the S1 and S2 voltage step, illustrating how S1 and S2 transient amplitudes were calculated following the restitution protocol. B. Representative Ca transients for WT and K180R HET cells. Traces were normalized to the amplitude of the first peak (S1) and superimposed. C. Average S2 SR Ca release fraction plotted as a function of varying the S1–S2 coupling interval. WT n = 8 cells from 3 hearts; K180R HET n = 10 cells (9 at 120 ms) from 3 hearts. Data displayed as mean ± SD. Data was analyzed using a hierarchical statistical model with Bonferroni correction. *P-values = 0.0039, 0.00034, 0.00041, 0.0026, and 0.045, respectively.
Figure 7:
Figure 7:. K180R decreases dynamic SR Ca buffering without affecting steady-state SR Ca buffering.
Cytosolic and intra-SR free Ca was measured simultaneously using a dual-indicator approach. Briefly, cardiomyocytes were first loaded with an esterified low-affinity Ca indicator that accesses the SR (Calbryte-520L AM). Cells were then permeabilized and loaded with the high-affinity Ca indicator Calbryte-590, potassium salt, to measure cytosolic Ca levels. Cells were imaged using an inverted confocal microscope in line-scan mode. A. Top: Representative images of indicator loading and wave propagation in permeabilized cardiomyocytes. Bottom: Example line scan images for SR and cytosolic fluorescent Ca indicators during Ca waves. Scale bar = 50 µm. B. Representative example trace of fluorescent signals generated from the line scans, illustrating the faster rise of intra-SR Ca in K180R HET cardiomyocytes. C. To compare Ca dynamics between groups, cytosolic Ca transients and intra-SR Ca depletion transients were parameterized by the transient amplitude and time to 90% recovery (CaT90%). D. Summary data of Ca dynamics. Intra-SR data: WT n = 34 cells from 3 hearts; K180R HET n = 35 cells from 3 hearts. Cytosolic data: WT n = 31 cells from 3 hearts for; K180R HET n = 32 cells from 3 hearts. Data reported as mean ± SD. Data analyzed using a hierarchical statistical model with Bonferroni correction.
Figure 8:
Figure 8:. Intra-SR Ca dynamics in intact K180R cardiomyocytes paced at 1 Hz.
Intra-SR Ca was measured in intact cardiomyocytes using the low-affinity Ca indicator Mag-Fluo-4 AM. Cells were incubated in 2 mM Ca normal Tyrode solution without isoproterenol and paced at 1 Hz. Cells were imaged using an inverted confocal microscope in line-scan mode and analyzed using ImageJ. A. Example image of an isolated cardiomyocyte loaded with Mag-Fluo-4 AM (top), with representative line scans paced at 1 Hz (bottom). B. Representative example trace of fluorescent signals generated from the line scans, illustrating the faster rise of intra-SR Ca in K180R HET cardiomyocytes. C. To compare Ca dynamics between groups, cytosolic Ca transients and intra-SR Ca depletion transients were parameterized by the transient amplitude and time to 90% recovery (CaT90%). D. Summary data of intra-SR Ca dynamics. WT n = 47 (amplitude) or 46 (CaT90%) cells from 3 hearts; K180R HET n = 39 cells from 3 hearts. Data reported as mean ± SD. Data analyzed using a hierarchical statistical model with Bonferroni correction.

References

    1. Leenhardt A, Lucet V, Denjoy I, Grau F, Ngoc DD, Coumel P. Catecholaminergic polymorphic ventricular tachycardia in children. A 7-year follow-up of 21 patients. Circulation 1995;91:1512–1519. - PubMed
    1. Pérez-Riera AR, Barbosa-Barros R, de Rezende Barbosa MPC, Daminello-Raimundo R, de Lucca AA, de Abreu LC. Catecholaminergic polymorphic ventricular tachycardia, an update. Ann Noninvasive Electrocardiol 2018;23:e12512. doi: 10.1111/anec.12512 - DOI - PMC - PubMed
    1. Roston TM, Yuchi Z, Kannankeril PJ, Hathaway J, Vinocur JM, Etheridge SP, Potts JE, Maginot KR, Salerno JC, Cohen MI, et al. The clinical and genetic spectrum of catecholaminergic polymorphic ventricular tachycardia: findings from an international multicentre registry. Europace 2018;20:541–547. doi: 10.1093/europace/euw389 - DOI - PMC - PubMed
    1. Lahat H, Pras E, Olender T, Avidan N, Ben-Asher E, Man O, Levy-Nissenbaum E, Khoury A, Lorber A, Goldman B, et al. A missense mutation in a highly conserved region of CASQ2 is associated with autosomal recessive catecholamine-induced polymorphic ventricular tachycardia in Bedouin families from Israel. Am J Hum Genet 2001;69:1378–1384. - PMC - PubMed
    1. Lahat H, Eldar M, Levy-Nissenbaum E, Bahan T, Friedman E, Khoury A, Lorber A, Kastner DL, Goldman B, Pras E. Autosomal recessive catecholamine- or exercise-induced polymorphic ventricular tachycardia: clinical features and assignment of the disease gene to chromosome 1p13–21. Circulation 2001;103:2822–2827. doi: 10.1161/01.cir.103.23.2822 - DOI - PubMed

Publication types

MeSH terms